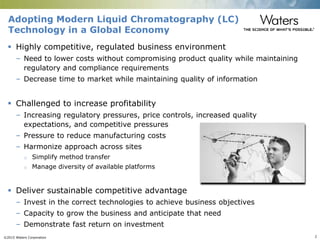
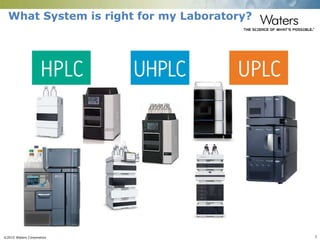
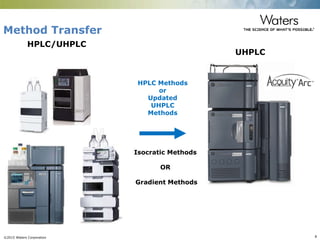
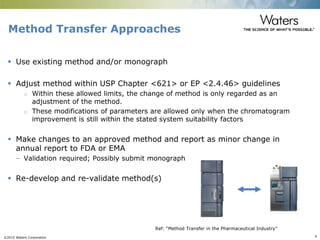
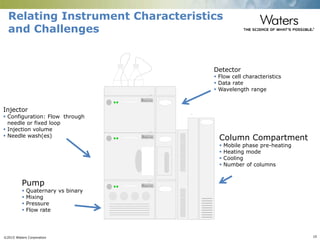
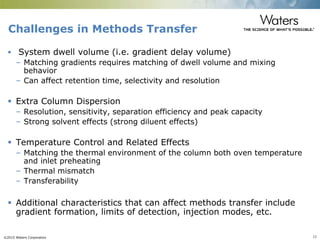
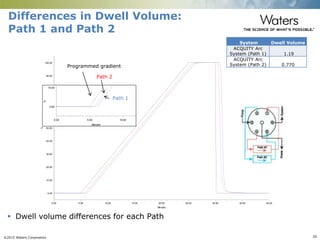
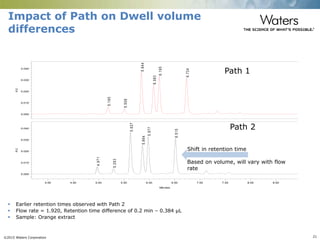
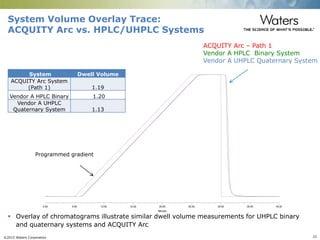
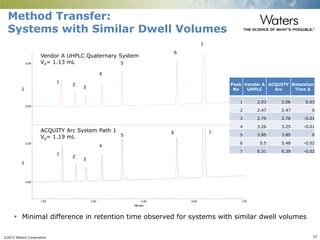
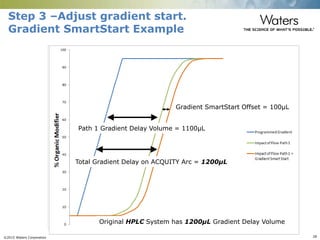
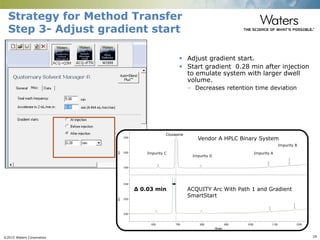
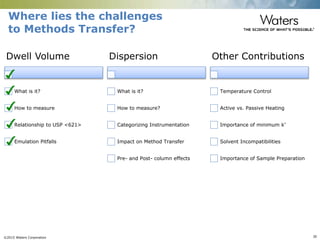
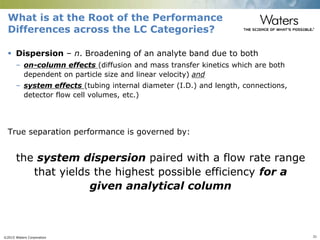
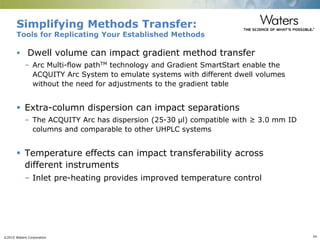
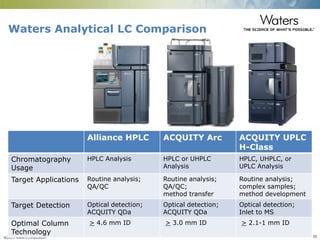
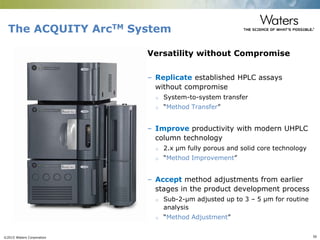
©2015 Waters Corporation 1
Paula Hong, Ph.D.
Principal Scientist
Waters Corporation
Simplifying Methods Transfer:
Novel Tools for Replicating Your
Established Methods on
an ACQUITY Arc™ UHPLC System
©2015 Waters Corporation 2
 Highly competitive, regulated business environment
– Need to lower costs without compromising product quality while maintaining
regulatory and compliance requirements
– Decrease time to market while maintaining quality of information
 Challenged to increase profitability
– Increasing regulatory pressures, price controls, increased quality
expectations, and competitive pressures
– Pressure to reduce manufacturing costs
– Harmonize approach across sites
o Simplify method transfer
o Manage diversity of available platforms
 Deliver sustainable competitive advantage
– Invest in the correct technologies to achieve business objectives
– Capacity to grow the business and anticipate that need
– Demonstrate fast return on investment
Adopting Modern Liquid Chromatography (LC)
Technology in a Global Economy
©2015 Waters Corporation 3
What System is right for my Laboratory?
©2015 Waters Corporation 4
LC Separations Categories
How are these categories differentiated?
Chromatographic Resolution Increases
Overall Run Time Decreases
Method Sensitivity Increases
©2015 Waters Corporation 5
Bridging-the-Gap Between HPLC and
UPLC Technology
HPLC UPLCUHPLC
Extends the ACQUITY family into laboratories
requiring method compatibility with HPLC and
UHPLC (2.x µm) separations
©2015 Waters Corporation 6
The ACQUITY Arc System:
Bridging the Performance Gap
 The ACQUITY Arc System is intended to bridge-the-gap between HPLC and
UPLC Technology.
– Transitioning methods to UPLC will still provide the largest business and
scientific benefits
 However, Waters recognized that for many organizations, that transition is
sometimes a journey rather than an immediate conversion.
– For many organizations, there is an intermediate step that must first take
place to transfer their established methods, per protocol, to a modern LC
platform.
 With the introduction of the ACQUITY Arc System, analytical scientists can
experience method compatibility for HPLC and UHPLC (2.x µm)
separations.
– A single LC platform that allows the efficient transfer, adjustment, or
improvement of methods from any LC platform without compromise.
©2015 Waters Corporation 7
ACQUITY ArcTM System
Detection Technology
• HPLC Detectors
• 2998 PDA, 2489 UV/Vis, 2414 RI, 2475 FLR, 2424 ELS
• ACQUITY QDa Mass Detector
Thermal Management Options
•Core config will include 30cm CH, 30cm CHC or CH30-A
•eCord functionality on the CH30-A
Sample Manager FTN-R
• Utilize FTN with larger 30 µL needle as default
• 50 µL extension loop is standard
• Optional sample compartment cooling
Quaternary Solvent Manager-R
• 9,500 PSI to 5 mL/min
• Quaternary mixing system
• Passive check valves
• Arc Multi-flow pathTM technology (selectable
dwell volume)
System performance
• 25 µL system dispersion (Alliance = 35-40 µL, H-Class = 7 µL)
• Ideally suited 3.0 / 4.6 mm ID columns 2.5 – 10 µm
• Platform extension of ACQUITY family
• Qualification available
©2015 Waters Corporation 8
Method Transfer
HPLC/UHPLC
UHPLC
HPLC Methods
or
Updated
UHPLC
Methods
Isocratic Methods
OR
Gradient Methods
©2015 Waters Corporation 9
Method Transfer Approaches
 Use existing method and/or monograph
 Adjust method within USP Chapter <621> or EP <2.4.46> guidelines
o Within these allowed limits, the change of method is only regarded as an
adjustment of the method.
o These modifications of parameters are allowed only when the chromatogram
improvement is still within the stated system suitability factors
 Make changes to an approved method and report as minor change in
annual report to FDA or EMA
– Validation required; Possibly submit monograph
 Re-develop and re-validate method(s)
Ref: “Method Transfer in the Pharmaceutical Industry”
©2015 Waters Corporation 10
Waters
Waters
Waters
Waters
Relating Instrument Characteristics
and Challenges
Detector
 Flow cell characteristics
 Data rate
 Wavelength range
Injector
 Configuration: Flow through
needle or fixed loop
 Injection volume
 Needle wash(es)
Pump
 Quaternary vs binary
 Mixing
 Pressure
 Flow rate
Column Compartment
 Mobile phase pre-heating
 Heating mode
 Cooling
 Number of columns
©2015 Waters Corporation 11
Challenges in Methods Transfer
 System dwell volume (i.e. gradient delay volume)
– Matching gradients requires matching of dwell volume and mixing
behavior
– Can affect retention time, selectivity and resolution
 Extra Column Dispersion
– Resolution, sensitivity, separation efficiency and peak capacity
– Strong solvent effects (strong diluent effects)
 Temperature Control and Related Effects
– Matching the thermal environment of the column both oven temperature
and inlet preheating
– Thermal mismatch
– Transferability
 Additional characteristics that can affect methods transfer include
gradient formation, limits of detection, injection modes, etc.
©2015 Waters Corporation 12
Where are the different volumes?
Extra-column
Volume
Dwell Volume
Volume between the
point of mixing of
solvents and the head
of an LC column
Volume between the
effective injection point
and the effective
detection point,
excluding the part of the
column containing the
stationary phase
©2015 Waters Corporation 13
Where lies the challenges
to Methods Transfer?
Dwell Volume
What is it?
How to measure
Relationship to USP <621>
Emulation Pitfalls
Dispersion
What is it?
How to measure?
Categorizing Instrumentation
Impact on Method Transfer
Pre- and Post- column effects
Other Contributions
Temperature Control
Active vs. Passive Heating
Importance of minimum k’
Solvent Incompatibilities
Importance of Sample Preparation
©2015 Waters Corporation 14
What is System Dwell Volume?
Solvent Composition
at Mixer
Solvent Composition
at Column Head
Actual mobile phase profile on
original system measured at the
column inlet
0
Injection
x
Dwell volume creates an offset before the solvent
composition change reaches the inlet of column
(i.e., an “isocratic hold” at the beginning of every gradient).
This volume can be thought of in terms of column volumes.
tg
{ }
Time
©2015 Waters Corporation 15
t1/2 (2)
50%
100%
tG
Determining Dwell Volume
𝑡 𝐷 = 𝑡1/2 −
1
2
𝑡 𝐺
𝑉𝐷 = 𝑡 𝐷 𝐹
Time
(min)
Flow
(ml/min)
%
A
%B
-- 1.00 100 0
5 1.00 100 0
25 1.00 0 100
30 1.00 0 100
35 1.00 100 0
A: Water
B: Water with 10mg/L caffeine
: 273 nm
%
0.00
20.00
40.00
60.00
80.00
100.00
Minutes
0.00 5.00 10.00 15.00 20.00 25.00 30.00 35.00 40.00
©2015 Waters Corporation 16
Dwell Volume Measurements
System Dwell Volume (VD) (mL)
Vendor A HPLC Quaternary 1.290
Alliance HPLC
w/2998
1.145
Vendor A HPLC Binary 1.20
Vendor A UHPLC Quaternary 1.13
ACQUITY Arc (Specifications) 1.100 or 0.770
ACQUITY UPLC H-Class 0.375
ACQUITY UPLC I-Class
SM-FTN
0.0725
 Wide range of dwell volume for both quaternary and binary pumps
DetectorInjector Column
Pump A
Pump B
Mixer
Gradient
Proportioning
Valve
DetectorInjectorA
B
C
D
ColumnPump
Binary pump Quaternary pump
Mixer
©2015 Waters Corporation 17
Minutes
0.00 5.00 10.00 15.00 20.00 25.00 30.00
Dwell Volume:
Transferring Methods from HPLC to UPLC
 Dwell volume differences will vary by instrument
UPLC trace
Programmed
gradient
HPLC trace
Delay between UPLC and HPLC
Gradient
delay UPLC
Gradient
delay
HPLC
Equilibration
©2015 Waters Corporation 18
Addressing Method Transfer Challenges:
Emulating System Behavior
 Why is Plug-and-Play Methods Transfer Necessary?
– USP <621> says about gradient methods …” If adjustments are necessary,
only column changes (same packing material) or dwell volume adjustments
are recommended.”
– Changes to gradient methods are perceived as being risky and are poorly
understood.
 How Can HPLC Fluidics Be Emulated?
 Match key fluidic characteristics – match dwell volume and mixing behavior
without changing gradient table
 Model and simulate fluid behavior (Arc Multi-flow pathTM technology)
 Adjust gradient table to account for differences in mixing behavior and dwell
volume (not desirable)
©2015 Waters Corporation 19
Arc Multi-flow path Technology
Tools for Emulating Other HPLC Systems
Select Path 1
Compensates for transferring
methods from LC systems with
variable volume
Flow Path 1
For HPLC Separations
(Larger Dwell volume)
©2015 Waters Corporation 20
%
0.00
10.00
20.00
30.00
40.00
50.00
60.00
70.00
80.00
90.00
100.00
Minutes
0.00 5.00 10.00 15.00 20.00 25.00 30.00 35.00 40.00
%
0.00
10.00
Minutes
0.00 5.00 10.00
Programmed gradient
Path 1
Path 2
Differences in Dwell Volume:
Path 1 and Path 2
System Dwell Volume
ACQUITY Arc
System (Path 1) 1.19
ACQUITY Arc
System (Path 2) 0.770
 Dwell volume differences for each Path
©2015 Waters Corporation 21
Shift in retention time
Based on volume, will vary with flow
rate
Impact of Path on Dwell volume
differences
 Earlier retention times observed with Path 2
 Flow rate = 1.920, Retention time difference of 0.2 min – 0.384 µL
 Sample: Orange extract
Path 1
Path 2
5.185
5.508
5.844
6.083
6.195
6.734
AU
0.000
0.010
0.020
0.030
0.040
4.971
5.293
5.627
5.864
5.977
6.515
AU
0.000
0.010
0.020
0.030
0.040
Minutes
4.00 4.50 5.00 5.50 6.00 6.50 7.00 7.50 8.00 8.50
©2015 Waters Corporation 22
Minutes
0.00 5.00 10.00 15.00 20.00 25.00 30.00 35.00 40.00
System Volume Overlay Trace:
ACQUITY Arc vs. HPLC/UHPLC Systems
Programmed gradient
ACQUITY Arc – Path 1
Vendor A HPLC Binary System
Vendor A UHPLC Quaternary System
 Overlay of chromatograms illustrate similar dwell volume measurements for UHPLC binary
and quaternary systems and ACQUITY Arc
System Dwell Volume
ACQUITY Arc System
(Path 1) 1.19
Vendor A HPLC Binary 1.20
Vendor A UHPLC
Quaternary System 1.13
©2015 Waters Corporation 23
AU
0.00
0.06
AU
0.00
0.05
Minutes
1.50 3.00 4.50 6.00 7.50
Method Transfer:
Systems with Similar Dwell Volumes
 Minimal difference in retention time observed for systems with similar dwell volumes
Vendor A UHPLC Quaternary System
Vd= 1.13 mL
ACQUITY Arc System Path 1
Vd= 1.19 mL
1
2
3
4
5
6
7
1
2
3
4
5
6 7
Peak
No
Vendor A
UHPLC
ACQUITY
Arc
Retention
Time Δ
1 2.03 2.06 0.03
2 2.47 2.47 0
3 2.79 2.78 -0.01
4 3.26 3.25 -0.01
5 3.85 3.85 0
6 5.5 5.48 -0.02
7 6.31 6.29 -0.02
©2015 Waters Corporation 24
0.589
0.745
1.046
1.274
1.391
1.501
1.588
AU
0.00
0.05
0.10
0.15
0.587
0.740
1.030
1.261
1.386
1.501
1.590
AU
0.00
0.05
0.10
0.15
Minutes
0.40 0.60 0.80 1.00 1.20 1.40 1.60 1.80
Binary Method Transfer:
Fast Gradient
 Comparable retention times observed on both HPLC Binary and ACQUITY Arc Systems
 Conditions: 10-80%B in 1.5 minutes at 3.5 mL/min.
Vendor A HPLC Binary System
Vd= 1.20 mL
ACQUITY Arc System, Path 1
Vd= 1.19 mL
©2015 Waters Corporation 25
Arc Multi-flow path Technology
Tools for Emulating Other HPLC Systems
Select Path 1
Gradient
SmartStart
Compensates for transferring
methods from LC systems with
variable volume
Adjust when the gradient starts
relative to the injection
sequence
No impact on gradient table
Flow Path 1
For HPLC Separations
(Larger Dwell volume)
©2015 Waters Corporation 26
Strategy for Method Transfer
1. Transfer method to an ACQUITY Arc. Select Path
with Arc Multi-flow pathTM technology.
– Available on ACQUITY Arc only
– Hardware emulation tool. Emulates dwell volume and mixing behavior
by:
…purposeful hardware design. Select Path 1 or Path 2 to emulate HPLC
or UHPLC
– Compliant ready design
o Both fluidic paths are standard and qualified upon installation.
2. Compare chromatograms, determine any difference in retention
times.
3. If retention time differences are unacceptable, adjust gradient
start relative to injection using Gradient SmartStart. Enter in
midpoint or average difference in time. Re-run method.
©2015 Waters Corporation 27
Strategy for Method Transfer:
Step 1- Select Path
Step 2- Determine retention time Δ
 Path 1 provides retention times that are closer to UHPLC system
AU
0.00
0.02
0.04
AU
0.00
0.02
0.04
AU
0.00
0.02
0.04
Minutes
5.50 6.00 6.50 7.00 7.50 8.00 8.50 9.00 9.50 10.00 10.50 11.00 11.50 12.00 12.50
Vendor A HPLC Binary System
ACQUITY Arc Path 1
ACQUITY Arc Path 2
Δ 0.28 min
Δ 0.55 min
Impurity A
Impurity B
Impurity C
Clozapine
Impurity D
©2015 Waters Corporation 28
Step 3 –Adjust gradient start.
Gradient SmartStart Example
Gradient SmartStart Offset = 100μL
Original HPLC System has 1200μL Gradient Delay Volume
Path 1 Gradient Delay Volume = 1100μL
Total Gradient Delay on ACQUITY Arc = 1200μL
©2015 Waters Corporation 29
Strategy for Method Transfer
Step 3- Adjust gradient start
 Adjust gradient start.
 Start gradient 0.28 min after injection
to emulate system with larger dwell
volume.
– Decreases retention time deviation
Vendor A HPLC Binary System
ACQUITY Arc With Path 1 and Gradient
SmartStart
Δ 0.03 min
Impurity A
Impurity B
Impurity C
Clozapine
Impurity D
©2015 Waters Corporation 30
Where lies the challenges
to Methods Transfer?
Dwell Volume
What is it?
How to measure
Relationship to USP <621>
Emulation Pitfalls
Dispersion
What is it?
How to measure?
Categorizing Instrumentation
Impact on Method Transfer
Pre- and Post- column effects
Other Contributions
Temperature Control
Active vs. Passive Heating
Importance of minimum k’
Solvent Incompatibilities
Importance of Sample Preparation
©2015 Waters Corporation 31
 Dispersion – n. Broadening of an analyte band due to both
– on-column effects (diffusion and mass transfer kinetics which are both
dependent on particle size and linear velocity) and
– system effects (tubing internal diameter (I.D.) and length, connections,
detector flow cell volumes, etc.)
True separation performance is governed by:
the system dispersion paired with a flow rate range
that yields the highest possible efficiency for a
given analytical column
What is at the Root of the Performance
Differences across the LC Categories?
©2015 Waters Corporation 32
Defining the LC Categories
Dispersion > 30 µL
Columns accepted:
• 3.0 – 4.6 mm ID
• 3 - 10 µm particles
Optimal:
• 4.6 mm ID, 5 µm
Typical operating pressure:
• < 6,000 PSI
Dispersion 12 - 30 µL
Columns accepted:
• 2.1 - 4.6 mm ID
• 1.7 - 5 µm particles
Optimal:
• 3.0 mm ID, 2.x µm
Typical operating pressure:
• 6,000 – 15,000 PSI
Dispersion < 12 µL
Columns accepted:
• 1.0 - 4.6 mm ID
• 1.6 - 5 µm particles
Optimal:
• 2.1 mm ID, 1.7 µm
Typical operating pressure:
• 9,000 – 15,000 PSI
Increased flexibility and sample characterization
©2015 Waters Corporation 33
Measuring Extra Column Dispersion
(Bandspread)
AU
0.00
0.50
1.00
1.50
Minutes
0.00 0.10 0.20 0.30 0.40 0.50
 Replace column with low volume union
 Run following method conditions:
– 7:3 Water:Acetonitrile at 0.3mL/min
– Sampling rate: 40Hz, λ = 273 nm
– Sample: 0.16 mg/mL Caffeine 9:1 Acetonitrile:water, 1 µL injection
 Measure peak width at 13.4 % (4σ) or 4.4% (5σ)
 Extra column dispersion (µL) = peak width (min) * flow rate (µL/min)
5σ
4σ
σ
ACQUITY Arc Path 1 and Path 2
©2015 Waters Corporation 34
 Measurements may vary from system to system.
 Variables that can affect bandspread or extra column dispersion-
– Tubing ( ID >length)
– Flow cells
– Preheating
* Measurements were performed using multiple pre-heater, column compartment and flow
cell configurations
Extra Column Dispersion
Measurements
System Extra Column
Dispersion @ 5 
Extra Column
Dispersion @ 4 
Vendor A HPLC Quaternary 27-31* 21-24*
Alliance HPLC
w/2998 µbore FC
36 27
Vendor A UHPLC Quaternary 31-36* 17-25*
ACQUITY Arc System (Path 1 and 2) 25-30* 19-25*
ACQUITY UPLC H-Class with Column
Heater, analytical FC
8 7
ACQUITY UPLC I-Class
SM-FTN
7.5 5
©2015 Waters Corporation 35
Dispersion Impact on Performance:
Isocratic Separations on HPLC, UHPLC and UPLC
AU
0.00
0.20
0.40
0.60
0.80
1.00
Minutes
0.50 1.00 1.50 2.00
AU
0.00
0.20
0.40
0.60
0.80
1.00
Minutes
0.50 1.00 1.50 2.00
AU
0.00
0.20
0.40
0.60
0.80
1.00
Minutes
0.50 1.00 1.50 2.00
AU
0.00
0.20
0.40
0.60
0.80
1.00
Minutes
0.50 1.00 1.50 2.00
AU
0.00
0.20
0.40
0.60
0.80
1.00
Minutes
0.50 1.00 1.50 2.00
AU 0.00
0.20
0.40
0.60
0.80
1.00
Minutes
0.50 1.00 1.50 2.00
AU
0.00
0.20
0.40
0.60
0.80
1.00
Minutes
0.50 1.00 1.50 2.00 2.50
AU
0.00
0.20
0.40
0.60
0.80
1.00
Minutes
0.50 1.00 1.50 2.00 2.50
AU
0.00
0.20
0.40
0.60
0.80
1.00
Minutes
0.50 1.00 1.50 2.00 2.50
UHPLC
Extra column dispersion ~25 µL
UPLC
Extra column dispersion< 10 µL
HPLC
Extra column dispersion >30 µL
2.1x50mm,
1.6µm
3.0x75mm,
2.7µm
4.6x75mm,
2.7µm
*
k’ =1
*
 Strong solvent effects
©2015 Waters Corporation 36
Dispersion Impact on Performance:
Isocratic Separations on HPLC, UHPLC and UPLC
AU
0.00
0.20
0.40
0.60
0.80
1.00
Minutes
0.50 1.00 1.50 2.00
AU
0.00
0.20
0.40
0.60
0.80
1.00
Minutes
0.50 1.00 1.50 2.00
AU
0.00
0.20
0.40
0.60
0.80
1.00
Minutes
0.50 1.00 1.50 2.00
AU
0.00
0.20
0.40
0.60
0.80
1.00
Minutes
0.50 1.00 1.50 2.00
AU
0.00
0.20
0.40
0.60
0.80
1.00
Minutes
0.50 1.00 1.50 2.00
AU 0.00
0.20
0.40
0.60
0.80
1.00
Minutes
0.50 1.00 1.50 2.00
AU
0.00
0.20
0.40
0.60
0.80
1.00
Minutes
0.50 1.00 1.50 2.00 2.50
AU
0.00
0.20
0.40
0.60
0.80
1.00
Minutes
0.50 1.00 1.50 2.00 2.50
AU
0.00
0.20
0.40
0.60
0.80
1.00
Minutes
0.50 1.00 1.50 2.00 2.50
 Strong solvent effects
UHPLC > 3.0 mm ID
Extra column dispersion ~25 µL
UPLC > 2.1 mm ID
Extra column dispersion< 12 µL
HPLC > 4.6 mm ID
Extra column dispersion >30 µL
2.1x50mm,
1.6µm
3.0x75mm,
2.7µm
4.6x75mm,
2.7µm
*
k’ =1
*
©2015 Waters Corporation 37
Dispersion Impact on Performance:
Gradient Separations on UHPLC and UPLC
Column: C18 2.1x 50 mm
USP Assay for Diclazuril
AU
0.000
0.012
0.024
0.036
0.048
AU
0.000
0.012
0.024
0.036
0.048
Minutes
1.75 2.00 2.25 2.50 2.75 3.00 3.25 3.50 3.75 4.00
UHPLC
Extra column dispersion 25 µL
UPLC
Extra column dispersion< 10 µL
1
2
3
4 5 6
USP Res= 1.5
USP Res= 2.0 USP Res= 2.7
USP Res= 1.8
No Compound
1 6 carboxylic acid
2 6-carboxamide
3 Diclazuril
4 Ketone
5 4-amino Derivative
6 Des-cyano derivative
©2015 Waters Corporation 38
AU
-0.02
0.00
0.02
0.04
0.06
0.08
0.10
0.12
0.14
AU
-0.02
0.00
0.02
0.04
0.06
0.08
0.10
0.12
0.14
Minutes
2.20 2.40 2.60 2.80 3.00 3.20 3.40 3.60 3.80 4.00 4.20 4.40
Post Column Dispersion Effect
 System: Alliance HPLC with 2998 (Blue) Detector; Gradient: 5-90% B in 4min
 Column: CORTECS C18+ 2.1 x 75 mm 2.7 µm, Column
 Gradient adjusted for dwell volume differences using integrated software
10 mm Flow Cell
Analytical Flow Cell
8 mm Flow Cell
μbore flow cell
USP Res = 1.6 – 2.5
USP Res = 1.1- 1.8
©2015 Waters Corporation 39
Where lies the challenges
to Methods Transfer?
Dwell Volume
What is it?
How to measure
Relationship to USP <621>
Emulation Pitfalls
Dispersion
What is it?
How to measure?
Categorizing Instrumentation
Impact on Method Transfer
Pre- and Post- column effects
Other Contributions
Temperature Control
Active vs. Passive Heating
Importance of minimum k’
Solvent Incompatibilities
Importance of Sample Preparation
©2015 Waters Corporation 40
Thermal Mismatch:
Impact on Methods Transfer
 Peak distortion due to thermal mismatch (caused by temperature gradient along the length
of the column)
 Column: CORTECS C18+ 2.1 x 75 mm, 2.7 µm; System: Alliance HPLC with 2998 PDA detector
Transfer to HPLC
No mobile phase pre-heating
Transfer to HPLC
Added inlet tubing for
passive pre-heating
Fronting peaks,
broadening
Improved peak
shape and
efficiencies
Original UPLC Method
Active pre-heater
AU
0.000
0.012
0.024
0.036
0.048
AU
0.000
0.012
0.024
0.036
0.048
Minutes
3.00 4.00 5.00 6.00 7.00 8.00 9.00 10.00
AU
0.000
0.015
0.030
0.045
0.060
Minutes
4.00 5.00 6.00 7.00 8.00 9.00 10.00
0.60
0.48
0.48
©2015 Waters Corporation 41
Column Heating Options
CH30-A with new 0.005” APH 30-cm CH and CHC with
new low dispersion passive preheater
©2015 Waters Corporation 42
AU
0.00
0.20
0.40
0.60
0.80
AU
0.00
0.20
0.40
0.60
0.80
Minutes
2.00 3.00 4.00 5.00 6.00 7.00 8.00
Methods for Controlling Mobile Phase
Temperature: Preheating
 Active and passive preheating –
provide similar chromatography if
temperature control is adequate
 Preheating may be affected by
flow rate due to residence time in
the preheater
Passive Preheating
Active Preheating
AU
0.00
0.20
0.40
0.60
0.80
Minutes
2.00 3.00 4.00 5.00 6.00 7.00 8.00
Vendor A UHPLC
System- Passive
Preheating
©2015 Waters Corporation 43
Effect of Mobile Phase Pre-Heating on
Method Transfer
• Temperature control can impact separation and transferability of method
• Column temperature: 30 ˚C
AU
0.00
0.05
0.10
0.15
0.20
Minutes
8.50 9.00 9.50 10.00 10.50 11.00 11.50 12.00
AU
0.00
0.05
0.10
0.15
0.20
Minutes
8.50 9.00 9.50 10.00 10.50 11.00 11.50 12.00
AU
0.00
0.05
0.10
0.15
0.20
Minutes
8.50 9.00 9.50 10.00 10.50 11.00 11.50 12.00
Vendor A HPLC Binary System ACQUITY Arc System-30 CHC
AU
0.00
0.05
0.10
0.15
0.20
Minutes
8.50 9.00 9.50 10.00 10.50 11.00 11.50 12.00
Preheater
Preheater
No PreheaterNo Preheater
Vendor A HPLC Binary System ACQUITY Arc System
©2015 Waters Corporation 44
AU
0.00
0.05
0.10
0.15
0.20
0.25
Minutes
0.50 1.00 1.50 2.00 2.50 3.00
Dispersion Effects with
Low k’ and High Organic Solvent
 Strong solvent effect related to k’ or peak volume
 Injection volume <15% of peak volume if diluent = starting mobile phase, lower if strong solvent diluent used
 Additional strategies: add post injector volume, change to weaker sample diluent
Sample diluent: MeOH
Injection volume: 7.2 µL
Column: 4.6 x 75 mm column
Isocratic separation
Scale to 3.0 x 75 mm column,
3.1 µL injection
Lower injection volume
From 7.2 to 3 µL
Measured extra column dispersion – 9 µL
AU
0.00
0.10
0.20
0.30
0.40
Minutes
0.00 0.50 1.00 1.50 2.00 2.50 3.00 3.50 4.00
Measured extra column dispersion – 11 µL
AU
0.00
0.05
0.10
0.15
0.20
0.25
0.30
AU
0.00
0.10
0.20
0.30
0.40
0.50
0.60
0.70
Minutes
0.10 0.20 0.30 0.40 0.50 0.60 0.70 0.80 0.90 1.00 1.10 1.20 1.30 1.40 1.50 1.60 1.70 1.80 1.90 2.00 2.10 2.20
peak distortion due
to strong solvent
effects
USP Allowable
Changes
©2015 Waters Corporation 45
• Equivalent volume
overload behavior to
Agilent LC Systems in
default configuration
• Improved tolerance of
volume overload with
optional SM-FTN mixer
Sample Manager FTN-R:
Tolerance of High Organic Diluents
Mobile Phase: 10% Acetonitrile
Sample Diluent: 55% Acetonitrile
Test probe: acetophenone k=12.4
Column: 4.6 x 50 mm
ACQUITY Arc
ACQUITY Arc w/ injection mixer
©2015 Waters Corporation 46
Vendor A UHPLC System ACQUITY Arc System
Comparing Strong Solvent
Effects
 Similar strong solvent effects observed for sample eluting in initial isocratic hold of the separation.
 Sample diluent:3:7 Water:Methanol.
 Slight increases in injection volume result in noticeable change in peak shape
 Conditions: XBridge C18, 4.6mm x 100mm, 3.5 µm, Injection volume: 5 µL, Gradient: 5% ACN (0.1% HCOOH) – Isocratic hold
Injection
Volume
Vendor A
UHPLC
ACQUITY
Arc
4.00 1.10 1.07
5.00 1.03 1.04
6.00 0.93 0.98
7.00 0.91
8.00 0.88
9.00 0.82
USP Tailing
AU
0.00
0.02
AU
0.00
0.02
AU
0.00
0.02
AU
0.00
0.02
AU
0.00
0.02
Minutes
2.08 2.34 2.60 2.86 3.12
AU
0.00
0.02
AU
0.00
0.02
AU
0.00
0.02
AU
0.00
0.02
AU
0.00
0.02
Minutes
2.08 2.34 2.60 2.86 3.12
9.0 µL
8.0 µL
6.0 µL
5.0 µL
4.0 µL
©2015 Waters Corporation 47
Where lies the challenges
to Methods Transfer?
Dwell Volume
What is it?
How to measure
Relationship to USP <621>
Emulation Pitfalls
Dispersion
What is it?
How to measure?
Categorizing Instrumentation
Impact on Method Transfer
Pre- and Post- column effects
Other Contributions
Temperature Control
Active vs. Passive Heating
Importance of minimum k’
Solvent Incompatibilities
Importance of Sample Preparation
©2015 Waters Corporation 48
Applications
 Method transfer for wide range of HPLC techniques and
samples, including:
– USP methods
– Small molecules
– Natural products
– Nutraceuticals
– Biomolecules
©2015 Waters Corporation 49
Binary Method Transfer – Fast Gradient
Retention Time Reproducibility (n=6)
 Gradient: 10-80% B in 1.5 minutes Column: XBridge C18 3.5 µm, 4.6 x 50 mm,
 Compounds: 1- 2-acetylfuran; 2- acetanilide, 3- acetophenone, 4- propiphenone, 5-
butylparaben, 6- benzophenone, 7- valerphenone
Agilent 1100 Binary
System
ACQUITY Arc System
Path 1
Waters
Waters
Waters
Waters
AU
0.00
0.02
0.04
0.06
0.08
0.10
0.12
0.14
Minutes
0.40 0.60 0.80 1.00 1.20 1.40 1.60
AU
0.00
0.02
0.04
0.06
0.08
0.10
0.12
0.14
Minutes
0.40 0.60 0.80 1.00 1.20 1.40 1.60 1.80
©2015 Waters Corporation 50
System Suitability Data
Average of n= 6
 All retention times within 0.01 minutes
 Area %RSD’s less than 0.70 on Agilent 1100 Binary ALS (G1316A) and ACQUITY Arc r-FTN.
Compound
Agilent
1100
Binary
ACQUITY
Arc
Δ
1 2-acetylfuran 0.589 0.587 0.002
2 acetanilide 0.744 0.74 0.004
3 acetophenone 1.045 1.03 0.015
4 propiphenone 1.273 1.261 0.012
5 butylparaben 1.39 1.385 0.005
6 benzophenone 1.5 1.501 -0.001
7 valerphenone 1.587 1.59 -0.003
Retention Time %Area RSD’s
*0
0.1
0.2
0.3
0.4
0.5
0.6
0.7
Area%RSD
Agilent1100
Binary
ACQUITY Arc
©2015 Waters Corporation 51
Method Transfer from Agilent 1260:
Water Soluble Vitamins
Chromatographic Conditions
Solvent A: 48 mM Sodium Phosphate, pH 2.5
Solvent B: acetonitrile
Gradient: 4% to 60% B in 12 min.
Column: 4.6 x150 mm XBridge C18, 3.5 µm
Column Temp. 40°C
Flow rate: 1 mL/min
Wavelength: 220 nm
Inj. Volume: 20 µL
Minutes
Agilent 1260
ACQUITY Arc System
Gradient delayed by 0.21 min. or 210 µL
0.00 1.00 2.00 3.00 4.00 5.00 6.00 7.00 8.00 9.00 10.00 11.00 12.00
ThiamineHCl-1.944
Nicotinamide-2.244
PyroidoxineHCl-2.703
FolicAcidDegradant-4.614
D-PantothenicAcid-5.606
FolicAcid-7.094
Cyanocobalamin-7.529
Riboflavin-8.650
©2015 Waters Corporation 52
AU
0.000
0.002
0.004
0.006
0.008
0.010
AU
0.000
0.002
0.004
0.006
0.008
0.010
Retention Time (min)
10.00 15.00 20.00 25.00 30.00 35.00 40.00 45.00 50.00 55.00 60.00 65.00 70.00 75.00 80.00
Transfer HPLC Method to ACQUITY ARC
Gradient : Ion Exchange
System Mode Rs
Relative Peak Area
(%)
K1 K0
x̅ σ x̅ σ
Arc HPLC 2.1 4.78 0.04 70.30 0.11
Agilent 1100 HPLC 1.8 5.14 0.05 69.67 0.28
Sample: Rituximab
K1
K0
K1
K0
Waters
Waters
Waters
Waters
©2015 Waters Corporation 53
Transfer HPLC Method to ACQUITY ARC
Ion Exchange: High repeatability of results
K0
AU
0.00
0.05
0.10
Retention Time (min)
10.00 20.00 30.00 40.00 50.00 60.00 70.00 80.00
6 Injections
AU
-0.0025
0.0000
0.0025
0.0050
0.0075
0.0100
Minutes
30.00 40.00 50.00 60.00
Inj Rs
K0-K1
1 2.11
2 2.10
3 2.08
4 2.11
5 2.15
6 2.14
Injection Area K1
1 269505
2 272294
3 267541
4 266328
5 268459
6 265468
Mean 268265.8
Std. Dev. 2445.71
%RSD 0.91
K1
Sample: Rituximab
K1
K0
©2015 Waters Corporation 54
Simplifying Methods Transfer:
Tools for Replicating Your Established Methods
 Dwell volume can impact gradient method transfer
– Arc Multi-flow pathTM technology and Gradient SmartStart enable the
ACQUITY Arc System to emulate systems with different dwell volumes
without the need for adjustments to the gradient table
 Extra-column dispersion can impact separations
– The ACQUITY Arc has dispersion (25-30 µl) compatible with ≥ 3.0 mm ID
columns and comparable to other UHPLC systems
 Temperature effects can impact transferability across
different instruments
– Inlet pre-heating provides improved temperature control
©2015 Waters Corporation 55
Waters Analytical LC Comparison
Alliance HPLC ACQUITY Arc ACQUITY UPLC
H-Class
Chromatography
Usage
HPLC Analysis HPLC or UHPLC
Analysis
HPLC, UHPLC, or
UPLC Analysis
Target Applications Routine analysis;
QA/QC
Routine analysis;
QA/QC;
method transfer
Routine analysis;
complex samples;
method development
Target Detection Optical detection;
ACQUITY QDa
Optical detection;
ACQUITY QDa
Optical detection;
Inlet to MS
Optimal Column
Technology
> 4.6 mm ID > 3.0 mm ID > 2.1-1 mm ID
©2015 Waters Corporation 56
The ACQUITY ArcTM System
 Versatility without Compromise
– Replicate established HPLC assays
without compromise
o System-to-system transfer
o “Method Transfer”
– Improve productivity with modern UHPLC
column technology
o 2.x µm fully porous and solid core technology
o “Method Improvement”
– Accept method adjustments from earlier
stages in the product development process
o Sub-2-µm adjusted up to 3 – 5 µm for routine
analysis
o “Method Adjustment”
©2015 Waters Corporation 57
ACQUITY Arc System
www.waters.com/arc

Simplifying Chromatographic Methods Transfer: Novel Tools for Replicating Your Established Methods on a Waters ACQUITY Arc System

  • 1.
    ©2015 Waters Corporation1 Paula Hong, Ph.D. Principal Scientist Waters Corporation Simplifying Methods Transfer: Novel Tools for Replicating Your Established Methods on an ACQUITY Arc™ UHPLC System
  • 2.
    ©2015 Waters Corporation2  Highly competitive, regulated business environment – Need to lower costs without compromising product quality while maintaining regulatory and compliance requirements – Decrease time to market while maintaining quality of information  Challenged to increase profitability – Increasing regulatory pressures, price controls, increased quality expectations, and competitive pressures – Pressure to reduce manufacturing costs – Harmonize approach across sites o Simplify method transfer o Manage diversity of available platforms  Deliver sustainable competitive advantage – Invest in the correct technologies to achieve business objectives – Capacity to grow the business and anticipate that need – Demonstrate fast return on investment Adopting Modern Liquid Chromatography (LC) Technology in a Global Economy
  • 3.
    ©2015 Waters Corporation3 What System is right for my Laboratory?
  • 4.
    ©2015 Waters Corporation4 LC Separations Categories How are these categories differentiated? Chromatographic Resolution Increases Overall Run Time Decreases Method Sensitivity Increases
  • 5.
    ©2015 Waters Corporation5 Bridging-the-Gap Between HPLC and UPLC Technology HPLC UPLCUHPLC Extends the ACQUITY family into laboratories requiring method compatibility with HPLC and UHPLC (2.x µm) separations
  • 6.
    ©2015 Waters Corporation6 The ACQUITY Arc System: Bridging the Performance Gap  The ACQUITY Arc System is intended to bridge-the-gap between HPLC and UPLC Technology. – Transitioning methods to UPLC will still provide the largest business and scientific benefits  However, Waters recognized that for many organizations, that transition is sometimes a journey rather than an immediate conversion. – For many organizations, there is an intermediate step that must first take place to transfer their established methods, per protocol, to a modern LC platform.  With the introduction of the ACQUITY Arc System, analytical scientists can experience method compatibility for HPLC and UHPLC (2.x µm) separations. – A single LC platform that allows the efficient transfer, adjustment, or improvement of methods from any LC platform without compromise.
  • 7.
    ©2015 Waters Corporation7 ACQUITY ArcTM System Detection Technology • HPLC Detectors • 2998 PDA, 2489 UV/Vis, 2414 RI, 2475 FLR, 2424 ELS • ACQUITY QDa Mass Detector Thermal Management Options •Core config will include 30cm CH, 30cm CHC or CH30-A •eCord functionality on the CH30-A Sample Manager FTN-R • Utilize FTN with larger 30 µL needle as default • 50 µL extension loop is standard • Optional sample compartment cooling Quaternary Solvent Manager-R • 9,500 PSI to 5 mL/min • Quaternary mixing system • Passive check valves • Arc Multi-flow pathTM technology (selectable dwell volume) System performance • 25 µL system dispersion (Alliance = 35-40 µL, H-Class = 7 µL) • Ideally suited 3.0 / 4.6 mm ID columns 2.5 – 10 µm • Platform extension of ACQUITY family • Qualification available
  • 8.
    ©2015 Waters Corporation8 Method Transfer HPLC/UHPLC UHPLC HPLC Methods or Updated UHPLC Methods Isocratic Methods OR Gradient Methods
  • 9.
    ©2015 Waters Corporation9 Method Transfer Approaches  Use existing method and/or monograph  Adjust method within USP Chapter <621> or EP <2.4.46> guidelines o Within these allowed limits, the change of method is only regarded as an adjustment of the method. o These modifications of parameters are allowed only when the chromatogram improvement is still within the stated system suitability factors  Make changes to an approved method and report as minor change in annual report to FDA or EMA – Validation required; Possibly submit monograph  Re-develop and re-validate method(s) Ref: “Method Transfer in the Pharmaceutical Industry”
  • 10.
    ©2015 Waters Corporation10 Waters Waters Waters Waters Relating Instrument Characteristics and Challenges Detector  Flow cell characteristics  Data rate  Wavelength range Injector  Configuration: Flow through needle or fixed loop  Injection volume  Needle wash(es) Pump  Quaternary vs binary  Mixing  Pressure  Flow rate Column Compartment  Mobile phase pre-heating  Heating mode  Cooling  Number of columns
  • 11.
    ©2015 Waters Corporation11 Challenges in Methods Transfer  System dwell volume (i.e. gradient delay volume) – Matching gradients requires matching of dwell volume and mixing behavior – Can affect retention time, selectivity and resolution  Extra Column Dispersion – Resolution, sensitivity, separation efficiency and peak capacity – Strong solvent effects (strong diluent effects)  Temperature Control and Related Effects – Matching the thermal environment of the column both oven temperature and inlet preheating – Thermal mismatch – Transferability  Additional characteristics that can affect methods transfer include gradient formation, limits of detection, injection modes, etc.
  • 12.
    ©2015 Waters Corporation12 Where are the different volumes? Extra-column Volume Dwell Volume Volume between the point of mixing of solvents and the head of an LC column Volume between the effective injection point and the effective detection point, excluding the part of the column containing the stationary phase
  • 13.
    ©2015 Waters Corporation13 Where lies the challenges to Methods Transfer? Dwell Volume What is it? How to measure Relationship to USP <621> Emulation Pitfalls Dispersion What is it? How to measure? Categorizing Instrumentation Impact on Method Transfer Pre- and Post- column effects Other Contributions Temperature Control Active vs. Passive Heating Importance of minimum k’ Solvent Incompatibilities Importance of Sample Preparation
  • 14.
    ©2015 Waters Corporation14 What is System Dwell Volume? Solvent Composition at Mixer Solvent Composition at Column Head Actual mobile phase profile on original system measured at the column inlet 0 Injection x Dwell volume creates an offset before the solvent composition change reaches the inlet of column (i.e., an “isocratic hold” at the beginning of every gradient). This volume can be thought of in terms of column volumes. tg { } Time
  • 15.
    ©2015 Waters Corporation15 t1/2 (2) 50% 100% tG Determining Dwell Volume 𝑡 𝐷 = 𝑡1/2 − 1 2 𝑡 𝐺 𝑉𝐷 = 𝑡 𝐷 𝐹 Time (min) Flow (ml/min) % A %B -- 1.00 100 0 5 1.00 100 0 25 1.00 0 100 30 1.00 0 100 35 1.00 100 0 A: Water B: Water with 10mg/L caffeine : 273 nm % 0.00 20.00 40.00 60.00 80.00 100.00 Minutes 0.00 5.00 10.00 15.00 20.00 25.00 30.00 35.00 40.00
  • 16.
    ©2015 Waters Corporation16 Dwell Volume Measurements System Dwell Volume (VD) (mL) Vendor A HPLC Quaternary 1.290 Alliance HPLC w/2998 1.145 Vendor A HPLC Binary 1.20 Vendor A UHPLC Quaternary 1.13 ACQUITY Arc (Specifications) 1.100 or 0.770 ACQUITY UPLC H-Class 0.375 ACQUITY UPLC I-Class SM-FTN 0.0725  Wide range of dwell volume for both quaternary and binary pumps DetectorInjector Column Pump A Pump B Mixer Gradient Proportioning Valve DetectorInjectorA B C D ColumnPump Binary pump Quaternary pump Mixer
  • 17.
    ©2015 Waters Corporation17 Minutes 0.00 5.00 10.00 15.00 20.00 25.00 30.00 Dwell Volume: Transferring Methods from HPLC to UPLC  Dwell volume differences will vary by instrument UPLC trace Programmed gradient HPLC trace Delay between UPLC and HPLC Gradient delay UPLC Gradient delay HPLC Equilibration
  • 18.
    ©2015 Waters Corporation18 Addressing Method Transfer Challenges: Emulating System Behavior  Why is Plug-and-Play Methods Transfer Necessary? – USP <621> says about gradient methods …” If adjustments are necessary, only column changes (same packing material) or dwell volume adjustments are recommended.” – Changes to gradient methods are perceived as being risky and are poorly understood.  How Can HPLC Fluidics Be Emulated?  Match key fluidic characteristics – match dwell volume and mixing behavior without changing gradient table  Model and simulate fluid behavior (Arc Multi-flow pathTM technology)  Adjust gradient table to account for differences in mixing behavior and dwell volume (not desirable)
  • 19.
    ©2015 Waters Corporation19 Arc Multi-flow path Technology Tools for Emulating Other HPLC Systems Select Path 1 Compensates for transferring methods from LC systems with variable volume Flow Path 1 For HPLC Separations (Larger Dwell volume)
  • 20.
    ©2015 Waters Corporation20 % 0.00 10.00 20.00 30.00 40.00 50.00 60.00 70.00 80.00 90.00 100.00 Minutes 0.00 5.00 10.00 15.00 20.00 25.00 30.00 35.00 40.00 % 0.00 10.00 Minutes 0.00 5.00 10.00 Programmed gradient Path 1 Path 2 Differences in Dwell Volume: Path 1 and Path 2 System Dwell Volume ACQUITY Arc System (Path 1) 1.19 ACQUITY Arc System (Path 2) 0.770  Dwell volume differences for each Path
  • 21.
    ©2015 Waters Corporation21 Shift in retention time Based on volume, will vary with flow rate Impact of Path on Dwell volume differences  Earlier retention times observed with Path 2  Flow rate = 1.920, Retention time difference of 0.2 min – 0.384 µL  Sample: Orange extract Path 1 Path 2 5.185 5.508 5.844 6.083 6.195 6.734 AU 0.000 0.010 0.020 0.030 0.040 4.971 5.293 5.627 5.864 5.977 6.515 AU 0.000 0.010 0.020 0.030 0.040 Minutes 4.00 4.50 5.00 5.50 6.00 6.50 7.00 7.50 8.00 8.50
  • 22.
    ©2015 Waters Corporation22 Minutes 0.00 5.00 10.00 15.00 20.00 25.00 30.00 35.00 40.00 System Volume Overlay Trace: ACQUITY Arc vs. HPLC/UHPLC Systems Programmed gradient ACQUITY Arc – Path 1 Vendor A HPLC Binary System Vendor A UHPLC Quaternary System  Overlay of chromatograms illustrate similar dwell volume measurements for UHPLC binary and quaternary systems and ACQUITY Arc System Dwell Volume ACQUITY Arc System (Path 1) 1.19 Vendor A HPLC Binary 1.20 Vendor A UHPLC Quaternary System 1.13
  • 23.
    ©2015 Waters Corporation23 AU 0.00 0.06 AU 0.00 0.05 Minutes 1.50 3.00 4.50 6.00 7.50 Method Transfer: Systems with Similar Dwell Volumes  Minimal difference in retention time observed for systems with similar dwell volumes Vendor A UHPLC Quaternary System Vd= 1.13 mL ACQUITY Arc System Path 1 Vd= 1.19 mL 1 2 3 4 5 6 7 1 2 3 4 5 6 7 Peak No Vendor A UHPLC ACQUITY Arc Retention Time Δ 1 2.03 2.06 0.03 2 2.47 2.47 0 3 2.79 2.78 -0.01 4 3.26 3.25 -0.01 5 3.85 3.85 0 6 5.5 5.48 -0.02 7 6.31 6.29 -0.02
  • 24.
    ©2015 Waters Corporation24 0.589 0.745 1.046 1.274 1.391 1.501 1.588 AU 0.00 0.05 0.10 0.15 0.587 0.740 1.030 1.261 1.386 1.501 1.590 AU 0.00 0.05 0.10 0.15 Minutes 0.40 0.60 0.80 1.00 1.20 1.40 1.60 1.80 Binary Method Transfer: Fast Gradient  Comparable retention times observed on both HPLC Binary and ACQUITY Arc Systems  Conditions: 10-80%B in 1.5 minutes at 3.5 mL/min. Vendor A HPLC Binary System Vd= 1.20 mL ACQUITY Arc System, Path 1 Vd= 1.19 mL
  • 25.
    ©2015 Waters Corporation25 Arc Multi-flow path Technology Tools for Emulating Other HPLC Systems Select Path 1 Gradient SmartStart Compensates for transferring methods from LC systems with variable volume Adjust when the gradient starts relative to the injection sequence No impact on gradient table Flow Path 1 For HPLC Separations (Larger Dwell volume)
  • 26.
    ©2015 Waters Corporation26 Strategy for Method Transfer 1. Transfer method to an ACQUITY Arc. Select Path with Arc Multi-flow pathTM technology. – Available on ACQUITY Arc only – Hardware emulation tool. Emulates dwell volume and mixing behavior by: …purposeful hardware design. Select Path 1 or Path 2 to emulate HPLC or UHPLC – Compliant ready design o Both fluidic paths are standard and qualified upon installation. 2. Compare chromatograms, determine any difference in retention times. 3. If retention time differences are unacceptable, adjust gradient start relative to injection using Gradient SmartStart. Enter in midpoint or average difference in time. Re-run method.
  • 27.
    ©2015 Waters Corporation27 Strategy for Method Transfer: Step 1- Select Path Step 2- Determine retention time Δ  Path 1 provides retention times that are closer to UHPLC system AU 0.00 0.02 0.04 AU 0.00 0.02 0.04 AU 0.00 0.02 0.04 Minutes 5.50 6.00 6.50 7.00 7.50 8.00 8.50 9.00 9.50 10.00 10.50 11.00 11.50 12.00 12.50 Vendor A HPLC Binary System ACQUITY Arc Path 1 ACQUITY Arc Path 2 Δ 0.28 min Δ 0.55 min Impurity A Impurity B Impurity C Clozapine Impurity D
  • 28.
    ©2015 Waters Corporation28 Step 3 –Adjust gradient start. Gradient SmartStart Example Gradient SmartStart Offset = 100μL Original HPLC System has 1200μL Gradient Delay Volume Path 1 Gradient Delay Volume = 1100μL Total Gradient Delay on ACQUITY Arc = 1200μL
  • 29.
    ©2015 Waters Corporation29 Strategy for Method Transfer Step 3- Adjust gradient start  Adjust gradient start.  Start gradient 0.28 min after injection to emulate system with larger dwell volume. – Decreases retention time deviation Vendor A HPLC Binary System ACQUITY Arc With Path 1 and Gradient SmartStart Δ 0.03 min Impurity A Impurity B Impurity C Clozapine Impurity D
  • 30.
    ©2015 Waters Corporation30 Where lies the challenges to Methods Transfer? Dwell Volume What is it? How to measure Relationship to USP <621> Emulation Pitfalls Dispersion What is it? How to measure? Categorizing Instrumentation Impact on Method Transfer Pre- and Post- column effects Other Contributions Temperature Control Active vs. Passive Heating Importance of minimum k’ Solvent Incompatibilities Importance of Sample Preparation
  • 31.
    ©2015 Waters Corporation31  Dispersion – n. Broadening of an analyte band due to both – on-column effects (diffusion and mass transfer kinetics which are both dependent on particle size and linear velocity) and – system effects (tubing internal diameter (I.D.) and length, connections, detector flow cell volumes, etc.) True separation performance is governed by: the system dispersion paired with a flow rate range that yields the highest possible efficiency for a given analytical column What is at the Root of the Performance Differences across the LC Categories?
  • 32.
    ©2015 Waters Corporation32 Defining the LC Categories Dispersion > 30 µL Columns accepted: • 3.0 – 4.6 mm ID • 3 - 10 µm particles Optimal: • 4.6 mm ID, 5 µm Typical operating pressure: • < 6,000 PSI Dispersion 12 - 30 µL Columns accepted: • 2.1 - 4.6 mm ID • 1.7 - 5 µm particles Optimal: • 3.0 mm ID, 2.x µm Typical operating pressure: • 6,000 – 15,000 PSI Dispersion < 12 µL Columns accepted: • 1.0 - 4.6 mm ID • 1.6 - 5 µm particles Optimal: • 2.1 mm ID, 1.7 µm Typical operating pressure: • 9,000 – 15,000 PSI Increased flexibility and sample characterization
  • 33.
    ©2015 Waters Corporation33 Measuring Extra Column Dispersion (Bandspread) AU 0.00 0.50 1.00 1.50 Minutes 0.00 0.10 0.20 0.30 0.40 0.50  Replace column with low volume union  Run following method conditions: – 7:3 Water:Acetonitrile at 0.3mL/min – Sampling rate: 40Hz, λ = 273 nm – Sample: 0.16 mg/mL Caffeine 9:1 Acetonitrile:water, 1 µL injection  Measure peak width at 13.4 % (4σ) or 4.4% (5σ)  Extra column dispersion (µL) = peak width (min) * flow rate (µL/min) 5σ 4σ σ ACQUITY Arc Path 1 and Path 2
  • 34.
    ©2015 Waters Corporation34  Measurements may vary from system to system.  Variables that can affect bandspread or extra column dispersion- – Tubing ( ID >length) – Flow cells – Preheating * Measurements were performed using multiple pre-heater, column compartment and flow cell configurations Extra Column Dispersion Measurements System Extra Column Dispersion @ 5  Extra Column Dispersion @ 4  Vendor A HPLC Quaternary 27-31* 21-24* Alliance HPLC w/2998 µbore FC 36 27 Vendor A UHPLC Quaternary 31-36* 17-25* ACQUITY Arc System (Path 1 and 2) 25-30* 19-25* ACQUITY UPLC H-Class with Column Heater, analytical FC 8 7 ACQUITY UPLC I-Class SM-FTN 7.5 5
  • 35.
    ©2015 Waters Corporation35 Dispersion Impact on Performance: Isocratic Separations on HPLC, UHPLC and UPLC AU 0.00 0.20 0.40 0.60 0.80 1.00 Minutes 0.50 1.00 1.50 2.00 AU 0.00 0.20 0.40 0.60 0.80 1.00 Minutes 0.50 1.00 1.50 2.00 AU 0.00 0.20 0.40 0.60 0.80 1.00 Minutes 0.50 1.00 1.50 2.00 AU 0.00 0.20 0.40 0.60 0.80 1.00 Minutes 0.50 1.00 1.50 2.00 AU 0.00 0.20 0.40 0.60 0.80 1.00 Minutes 0.50 1.00 1.50 2.00 AU 0.00 0.20 0.40 0.60 0.80 1.00 Minutes 0.50 1.00 1.50 2.00 AU 0.00 0.20 0.40 0.60 0.80 1.00 Minutes 0.50 1.00 1.50 2.00 2.50 AU 0.00 0.20 0.40 0.60 0.80 1.00 Minutes 0.50 1.00 1.50 2.00 2.50 AU 0.00 0.20 0.40 0.60 0.80 1.00 Minutes 0.50 1.00 1.50 2.00 2.50 UHPLC Extra column dispersion ~25 µL UPLC Extra column dispersion< 10 µL HPLC Extra column dispersion >30 µL 2.1x50mm, 1.6µm 3.0x75mm, 2.7µm 4.6x75mm, 2.7µm * k’ =1 *  Strong solvent effects
  • 36.
    ©2015 Waters Corporation36 Dispersion Impact on Performance: Isocratic Separations on HPLC, UHPLC and UPLC AU 0.00 0.20 0.40 0.60 0.80 1.00 Minutes 0.50 1.00 1.50 2.00 AU 0.00 0.20 0.40 0.60 0.80 1.00 Minutes 0.50 1.00 1.50 2.00 AU 0.00 0.20 0.40 0.60 0.80 1.00 Minutes 0.50 1.00 1.50 2.00 AU 0.00 0.20 0.40 0.60 0.80 1.00 Minutes 0.50 1.00 1.50 2.00 AU 0.00 0.20 0.40 0.60 0.80 1.00 Minutes 0.50 1.00 1.50 2.00 AU 0.00 0.20 0.40 0.60 0.80 1.00 Minutes 0.50 1.00 1.50 2.00 AU 0.00 0.20 0.40 0.60 0.80 1.00 Minutes 0.50 1.00 1.50 2.00 2.50 AU 0.00 0.20 0.40 0.60 0.80 1.00 Minutes 0.50 1.00 1.50 2.00 2.50 AU 0.00 0.20 0.40 0.60 0.80 1.00 Minutes 0.50 1.00 1.50 2.00 2.50  Strong solvent effects UHPLC > 3.0 mm ID Extra column dispersion ~25 µL UPLC > 2.1 mm ID Extra column dispersion< 12 µL HPLC > 4.6 mm ID Extra column dispersion >30 µL 2.1x50mm, 1.6µm 3.0x75mm, 2.7µm 4.6x75mm, 2.7µm * k’ =1 *
  • 37.
    ©2015 Waters Corporation37 Dispersion Impact on Performance: Gradient Separations on UHPLC and UPLC Column: C18 2.1x 50 mm USP Assay for Diclazuril AU 0.000 0.012 0.024 0.036 0.048 AU 0.000 0.012 0.024 0.036 0.048 Minutes 1.75 2.00 2.25 2.50 2.75 3.00 3.25 3.50 3.75 4.00 UHPLC Extra column dispersion 25 µL UPLC Extra column dispersion< 10 µL 1 2 3 4 5 6 USP Res= 1.5 USP Res= 2.0 USP Res= 2.7 USP Res= 1.8 No Compound 1 6 carboxylic acid 2 6-carboxamide 3 Diclazuril 4 Ketone 5 4-amino Derivative 6 Des-cyano derivative
  • 38.
    ©2015 Waters Corporation38 AU -0.02 0.00 0.02 0.04 0.06 0.08 0.10 0.12 0.14 AU -0.02 0.00 0.02 0.04 0.06 0.08 0.10 0.12 0.14 Minutes 2.20 2.40 2.60 2.80 3.00 3.20 3.40 3.60 3.80 4.00 4.20 4.40 Post Column Dispersion Effect  System: Alliance HPLC with 2998 (Blue) Detector; Gradient: 5-90% B in 4min  Column: CORTECS C18+ 2.1 x 75 mm 2.7 µm, Column  Gradient adjusted for dwell volume differences using integrated software 10 mm Flow Cell Analytical Flow Cell 8 mm Flow Cell μbore flow cell USP Res = 1.6 – 2.5 USP Res = 1.1- 1.8
  • 39.
    ©2015 Waters Corporation39 Where lies the challenges to Methods Transfer? Dwell Volume What is it? How to measure Relationship to USP <621> Emulation Pitfalls Dispersion What is it? How to measure? Categorizing Instrumentation Impact on Method Transfer Pre- and Post- column effects Other Contributions Temperature Control Active vs. Passive Heating Importance of minimum k’ Solvent Incompatibilities Importance of Sample Preparation
  • 40.
    ©2015 Waters Corporation40 Thermal Mismatch: Impact on Methods Transfer  Peak distortion due to thermal mismatch (caused by temperature gradient along the length of the column)  Column: CORTECS C18+ 2.1 x 75 mm, 2.7 µm; System: Alliance HPLC with 2998 PDA detector Transfer to HPLC No mobile phase pre-heating Transfer to HPLC Added inlet tubing for passive pre-heating Fronting peaks, broadening Improved peak shape and efficiencies Original UPLC Method Active pre-heater AU 0.000 0.012 0.024 0.036 0.048 AU 0.000 0.012 0.024 0.036 0.048 Minutes 3.00 4.00 5.00 6.00 7.00 8.00 9.00 10.00 AU 0.000 0.015 0.030 0.045 0.060 Minutes 4.00 5.00 6.00 7.00 8.00 9.00 10.00 0.60 0.48 0.48
  • 41.
    ©2015 Waters Corporation41 Column Heating Options CH30-A with new 0.005” APH 30-cm CH and CHC with new low dispersion passive preheater
  • 42.
    ©2015 Waters Corporation42 AU 0.00 0.20 0.40 0.60 0.80 AU 0.00 0.20 0.40 0.60 0.80 Minutes 2.00 3.00 4.00 5.00 6.00 7.00 8.00 Methods for Controlling Mobile Phase Temperature: Preheating  Active and passive preheating – provide similar chromatography if temperature control is adequate  Preheating may be affected by flow rate due to residence time in the preheater Passive Preheating Active Preheating AU 0.00 0.20 0.40 0.60 0.80 Minutes 2.00 3.00 4.00 5.00 6.00 7.00 8.00 Vendor A UHPLC System- Passive Preheating
  • 43.
    ©2015 Waters Corporation43 Effect of Mobile Phase Pre-Heating on Method Transfer • Temperature control can impact separation and transferability of method • Column temperature: 30 ˚C AU 0.00 0.05 0.10 0.15 0.20 Minutes 8.50 9.00 9.50 10.00 10.50 11.00 11.50 12.00 AU 0.00 0.05 0.10 0.15 0.20 Minutes 8.50 9.00 9.50 10.00 10.50 11.00 11.50 12.00 AU 0.00 0.05 0.10 0.15 0.20 Minutes 8.50 9.00 9.50 10.00 10.50 11.00 11.50 12.00 Vendor A HPLC Binary System ACQUITY Arc System-30 CHC AU 0.00 0.05 0.10 0.15 0.20 Minutes 8.50 9.00 9.50 10.00 10.50 11.00 11.50 12.00 Preheater Preheater No PreheaterNo Preheater Vendor A HPLC Binary System ACQUITY Arc System
  • 44.
    ©2015 Waters Corporation44 AU 0.00 0.05 0.10 0.15 0.20 0.25 Minutes 0.50 1.00 1.50 2.00 2.50 3.00 Dispersion Effects with Low k’ and High Organic Solvent  Strong solvent effect related to k’ or peak volume  Injection volume <15% of peak volume if diluent = starting mobile phase, lower if strong solvent diluent used  Additional strategies: add post injector volume, change to weaker sample diluent Sample diluent: MeOH Injection volume: 7.2 µL Column: 4.6 x 75 mm column Isocratic separation Scale to 3.0 x 75 mm column, 3.1 µL injection Lower injection volume From 7.2 to 3 µL Measured extra column dispersion – 9 µL AU 0.00 0.10 0.20 0.30 0.40 Minutes 0.00 0.50 1.00 1.50 2.00 2.50 3.00 3.50 4.00 Measured extra column dispersion – 11 µL AU 0.00 0.05 0.10 0.15 0.20 0.25 0.30 AU 0.00 0.10 0.20 0.30 0.40 0.50 0.60 0.70 Minutes 0.10 0.20 0.30 0.40 0.50 0.60 0.70 0.80 0.90 1.00 1.10 1.20 1.30 1.40 1.50 1.60 1.70 1.80 1.90 2.00 2.10 2.20 peak distortion due to strong solvent effects USP Allowable Changes
  • 45.
    ©2015 Waters Corporation45 • Equivalent volume overload behavior to Agilent LC Systems in default configuration • Improved tolerance of volume overload with optional SM-FTN mixer Sample Manager FTN-R: Tolerance of High Organic Diluents Mobile Phase: 10% Acetonitrile Sample Diluent: 55% Acetonitrile Test probe: acetophenone k=12.4 Column: 4.6 x 50 mm ACQUITY Arc ACQUITY Arc w/ injection mixer
  • 46.
    ©2015 Waters Corporation46 Vendor A UHPLC System ACQUITY Arc System Comparing Strong Solvent Effects  Similar strong solvent effects observed for sample eluting in initial isocratic hold of the separation.  Sample diluent:3:7 Water:Methanol.  Slight increases in injection volume result in noticeable change in peak shape  Conditions: XBridge C18, 4.6mm x 100mm, 3.5 µm, Injection volume: 5 µL, Gradient: 5% ACN (0.1% HCOOH) – Isocratic hold Injection Volume Vendor A UHPLC ACQUITY Arc 4.00 1.10 1.07 5.00 1.03 1.04 6.00 0.93 0.98 7.00 0.91 8.00 0.88 9.00 0.82 USP Tailing AU 0.00 0.02 AU 0.00 0.02 AU 0.00 0.02 AU 0.00 0.02 AU 0.00 0.02 Minutes 2.08 2.34 2.60 2.86 3.12 AU 0.00 0.02 AU 0.00 0.02 AU 0.00 0.02 AU 0.00 0.02 AU 0.00 0.02 Minutes 2.08 2.34 2.60 2.86 3.12 9.0 µL 8.0 µL 6.0 µL 5.0 µL 4.0 µL
  • 47.
    ©2015 Waters Corporation47 Where lies the challenges to Methods Transfer? Dwell Volume What is it? How to measure Relationship to USP <621> Emulation Pitfalls Dispersion What is it? How to measure? Categorizing Instrumentation Impact on Method Transfer Pre- and Post- column effects Other Contributions Temperature Control Active vs. Passive Heating Importance of minimum k’ Solvent Incompatibilities Importance of Sample Preparation
  • 48.
    ©2015 Waters Corporation48 Applications  Method transfer for wide range of HPLC techniques and samples, including: – USP methods – Small molecules – Natural products – Nutraceuticals – Biomolecules
  • 49.
    ©2015 Waters Corporation49 Binary Method Transfer – Fast Gradient Retention Time Reproducibility (n=6)  Gradient: 10-80% B in 1.5 minutes Column: XBridge C18 3.5 µm, 4.6 x 50 mm,  Compounds: 1- 2-acetylfuran; 2- acetanilide, 3- acetophenone, 4- propiphenone, 5- butylparaben, 6- benzophenone, 7- valerphenone Agilent 1100 Binary System ACQUITY Arc System Path 1 Waters Waters Waters Waters AU 0.00 0.02 0.04 0.06 0.08 0.10 0.12 0.14 Minutes 0.40 0.60 0.80 1.00 1.20 1.40 1.60 AU 0.00 0.02 0.04 0.06 0.08 0.10 0.12 0.14 Minutes 0.40 0.60 0.80 1.00 1.20 1.40 1.60 1.80
  • 50.
    ©2015 Waters Corporation50 System Suitability Data Average of n= 6  All retention times within 0.01 minutes  Area %RSD’s less than 0.70 on Agilent 1100 Binary ALS (G1316A) and ACQUITY Arc r-FTN. Compound Agilent 1100 Binary ACQUITY Arc Δ 1 2-acetylfuran 0.589 0.587 0.002 2 acetanilide 0.744 0.74 0.004 3 acetophenone 1.045 1.03 0.015 4 propiphenone 1.273 1.261 0.012 5 butylparaben 1.39 1.385 0.005 6 benzophenone 1.5 1.501 -0.001 7 valerphenone 1.587 1.59 -0.003 Retention Time %Area RSD’s *0 0.1 0.2 0.3 0.4 0.5 0.6 0.7 Area%RSD Agilent1100 Binary ACQUITY Arc
  • 51.
    ©2015 Waters Corporation51 Method Transfer from Agilent 1260: Water Soluble Vitamins Chromatographic Conditions Solvent A: 48 mM Sodium Phosphate, pH 2.5 Solvent B: acetonitrile Gradient: 4% to 60% B in 12 min. Column: 4.6 x150 mm XBridge C18, 3.5 µm Column Temp. 40°C Flow rate: 1 mL/min Wavelength: 220 nm Inj. Volume: 20 µL Minutes Agilent 1260 ACQUITY Arc System Gradient delayed by 0.21 min. or 210 µL 0.00 1.00 2.00 3.00 4.00 5.00 6.00 7.00 8.00 9.00 10.00 11.00 12.00 ThiamineHCl-1.944 Nicotinamide-2.244 PyroidoxineHCl-2.703 FolicAcidDegradant-4.614 D-PantothenicAcid-5.606 FolicAcid-7.094 Cyanocobalamin-7.529 Riboflavin-8.650
  • 52.
    ©2015 Waters Corporation52 AU 0.000 0.002 0.004 0.006 0.008 0.010 AU 0.000 0.002 0.004 0.006 0.008 0.010 Retention Time (min) 10.00 15.00 20.00 25.00 30.00 35.00 40.00 45.00 50.00 55.00 60.00 65.00 70.00 75.00 80.00 Transfer HPLC Method to ACQUITY ARC Gradient : Ion Exchange System Mode Rs Relative Peak Area (%) K1 K0 x̅ σ x̅ σ Arc HPLC 2.1 4.78 0.04 70.30 0.11 Agilent 1100 HPLC 1.8 5.14 0.05 69.67 0.28 Sample: Rituximab K1 K0 K1 K0 Waters Waters Waters Waters
  • 53.
    ©2015 Waters Corporation53 Transfer HPLC Method to ACQUITY ARC Ion Exchange: High repeatability of results K0 AU 0.00 0.05 0.10 Retention Time (min) 10.00 20.00 30.00 40.00 50.00 60.00 70.00 80.00 6 Injections AU -0.0025 0.0000 0.0025 0.0050 0.0075 0.0100 Minutes 30.00 40.00 50.00 60.00 Inj Rs K0-K1 1 2.11 2 2.10 3 2.08 4 2.11 5 2.15 6 2.14 Injection Area K1 1 269505 2 272294 3 267541 4 266328 5 268459 6 265468 Mean 268265.8 Std. Dev. 2445.71 %RSD 0.91 K1 Sample: Rituximab K1 K0
  • 54.
    ©2015 Waters Corporation54 Simplifying Methods Transfer: Tools for Replicating Your Established Methods  Dwell volume can impact gradient method transfer – Arc Multi-flow pathTM technology and Gradient SmartStart enable the ACQUITY Arc System to emulate systems with different dwell volumes without the need for adjustments to the gradient table  Extra-column dispersion can impact separations – The ACQUITY Arc has dispersion (25-30 µl) compatible with ≥ 3.0 mm ID columns and comparable to other UHPLC systems  Temperature effects can impact transferability across different instruments – Inlet pre-heating provides improved temperature control
  • 55.
    ©2015 Waters Corporation55 Waters Analytical LC Comparison Alliance HPLC ACQUITY Arc ACQUITY UPLC H-Class Chromatography Usage HPLC Analysis HPLC or UHPLC Analysis HPLC, UHPLC, or UPLC Analysis Target Applications Routine analysis; QA/QC Routine analysis; QA/QC; method transfer Routine analysis; complex samples; method development Target Detection Optical detection; ACQUITY QDa Optical detection; ACQUITY QDa Optical detection; Inlet to MS Optimal Column Technology > 4.6 mm ID > 3.0 mm ID > 2.1-1 mm ID
  • 56.
    ©2015 Waters Corporation56 The ACQUITY ArcTM System  Versatility without Compromise – Replicate established HPLC assays without compromise o System-to-system transfer o “Method Transfer” – Improve productivity with modern UHPLC column technology o 2.x µm fully porous and solid core technology o “Method Improvement” – Accept method adjustments from earlier stages in the product development process o Sub-2-µm adjusted up to 3 – 5 µm for routine analysis o “Method Adjustment”
  • 57.
    ©2015 Waters Corporation57 ACQUITY Arc System www.waters.com/arc

Editor's Notes

  • #3 Adopting LC Technology in a Global Economy is driven by a number of factors. In a highly competitive regulated business environment there is a need to lower costs..
  • #4 Given these pressures it is not always easy to know which system is right for your laboratory. There are a wide variety of instruments from many different manufacturers and it is not always clear which one will meet your needs.
  • #5 We can think of the numerous systems in 3 broad categories. HPLC, UHPLC and UPLC. While we will discuss some of the specific differences of these categories later, in broad terms we realize as we progress from HPLC to UPLC we observe increases in chromatographic resolution, decrease in overall run time and greater method sensitivity.
  • #6 Over 20 years ago we introduced the Alliance HPLC system. And over 10 years ago we introduced the ACQUITY UPLC System. Now Waters has bridged the gap between HPLC and UPLC with the introduction of the ACQUITY arc system. The system sits within our platform of products and allows method compatibility with HPLC and UHPLC separations. With the introduction of the ACQUITY Arc System, Analytical scientists can experience true plug-and-play method compatibility for HPLC and UHPLC separations.
  • #7 By introducing this new mid-tier system, we acknowledge and recognize that many organizations, for many reasons, cannot make that performance leap all the way to UPLC performance. With the introduction of the ACQUITY Arc System, analytical scientists are able to adopt a modern LC platform, but still continue to support their legacy HPLC methods without issue.
  • #8 Let’s briefly discuss the attributes of the ACQUITY Arc system at a very high level… In terms of system performance, the ACQUITY Arc system has a total system dispersion value of 25 uL. To put this into context, the Alliance HPLC has a dispersion volume of 34 uL. H-Class has a dispersion value of 7 uL. Arc fits in between. Due to these dispersion characteristics, that means the most appropriate column to run on the Arc system is 3.0 mm ID or greater. The pump is a quaternary solvent manager has an upper pressure capability of 9,500 PSI (or 655 bar) with a flow rate range of 5 mL/min. The most differentiated feature that allows our users to seamlessly switch between HPLC and UHPLC mode is the Arc Multi-flow path technology. I will talk about this in more detail a bit later. The sample manager is a familiar flow through needle design. However, we have made adjustments to the design to better accommodate the ability to inject large volumes of samples dissolved in high organic. We also have a lower cost option that can be purchased without sample compartment cooling. There are 3 column heater options, all of which can accommodate 30 cm columns. Two options provide a circulated air style of oven with low dispersion passive solvent preheating and a third option which is a semi-adiabatic environment (still air) with active solvent preheating and eCord Technology for customers that are utilizing 2.7 um CORTECS columns. The detectors are HPLC detectors, with new low dispersion analytical flow cells. At first customer shipment, the only MS we will be supporting is the ACQUITY QDa.
  • #9 As mentioned earlier the ACQUITY arc enables methods transfer from numerous systems to the ACQUITY arc. Including HPLC or Updated UHPLC methods as well as isocratic and gradient separations. As the title of this talk suggests the features of the ACQUITY Arc enable simplified method transfer of HPLC methods tested on a wide range instruments to the ACQUITY Arc System.
  • #10 Before we cover the challenges and tools we can use for methods transfer let us review some of the approaches to methods transfer. Conservative Approach: use existing method Notion that if follow existing monograph will not have trouble with FDA; * FDA has made statements that it intends to look more closely at the quality of generic drugs Note: FDA is not keen on individual product monographs – feel that they inhibit innovation. They prefer you know what you need to measure and measure that in a accurate and meaningful way. Best way to deal with FDA – talk early, talk often. Adjust method within USP 621 – geometrically scale the method using the calculator/column selectivity chart – compendium. USP methods were developed and validated on older column technology and instrumentation. Both column technology and chromatographic system have significantly improved since these methods were developed. By using more modern columns on HPLC instrumentation, separation can be performed faster while meeting the specification listed in the USP monograph. Performance XP 2.5um columns are designed to used on both HPLC and UPLC instruments, allowing chromatographers to realize the benefits of smaller particle size columns and low-dispersion systems. The scalability of these column also facilities updating methods to comply with USP Chapter 621 guidelines. XP column allow older methods to run faster on existing HPLC system, and provide additional chromatographic cost benefits when methods are transferred to UPLC systems. And can more the next step to UPLC – beyond 621 limits…. Made changes to a approved methods and moved to UPLC –and submitted monograph The three compounds: Tramadol HCl (US USP), and Nevirapine and Clarithromycin (both through the Eur Pharmacopeia). The USP Tramadol HCl Impurities Monograph which uses UPLC - it is for the extend release tablets. Nevirapine – AIDS drug; India. Boehringer Ingelheim Pharmaceuticals had patent Clarithromycin -used to treat pharyngitis, tonsillitis, acute maxillary sinusitis, acute bacterial exacerbation of chronic bronchitis. Taisho, Japanese company, filed for patent protection for the drug around 1980. In 1985, Taisho partnered with the American company Abbott Laboratories for the international rights, and Abbott also gained FDA approval for Biaxin in October 1991. The drug went generic in Europe in 2004 and in the US in mid-2005. Re-develop methods: Often necessary to change analytical methods to ensure they remain stability-indicating, take advantage of improved analytical technology, monitor new related substances as a result of changes in synthetic or formulation processes, and improve analytical efficiency (e.g., through automation). Column no longer available Original method no robust - i.e. incorrect choice of column, etc. One customer Historically developed 3 methods for related impurities – want to combine to one for gain in efficiency (we have this example).
  • #11 Regardless of the approach, we need to understand instrument characteristics and how they can impact on methods transfer and the success of methods transfer Pump: Characteristics of the pump that can affect methods transfer include whether it is a binary ( 2 solvents mixed) or quaternary. Typically the former is high pressure mixing while quaternary pump employ low pressure mixing. Additional factors include the operating ranges such as flow rate, pressure limits and compositional accuracy. 2. Injector: There are primarily two different type of injectors. This includes a flow through needle, in which the sample in placed directly into the needle which is then placed in the flow path for injection. Other configurations use a fixed loop sample injector, in this instance the sample is placed into a separate loop which is then placed in the flow path for injection. After injection the sample loop is taken out of the flow path of the mobile phase. Both configurations have different types of needle washes, which are important for carryover and quantitative analyses. Other factors include the useable injection volume. 3. The Column Compartment This is critical for separations which require any temperature above ambient and those separations which are temperature sensitive. Some column compartments provide heating and cooling options while others only provide heating. The heating mechanisms can be static in which the column enclosure is heated or cooled) or circulating (which includes a fan for circulating the heated or cooled environment). In addition there are different types of control of the inlet temperature (pre-heater or heat exchanger). These can be active or passive heating . Active uses some electronic components to heat the mobile phase to the desired temperature while passive involves the mobile phase passing through tubing that is at the desired temperature ( and is within the column compartment). 4. Detector: In methods transfer dispersion within the flow cell can affect methods transfer, particularly for low volume columns in which any extra column dispersion can have a significant contribution to band broadening. In addition factors such as data rate, which can impact dispersion as well, and wavelength range may affect the transfer.
  • #12 While all of these instrument characteristics can affect the success of methods transfer, for the sake of time, in this discussion we will be focusing on only a few instrument attributes and their impact on methods transfer. Briefly those characteristics include: system dwell or gradient delay volume, System or extra column dispersion and temperature control and its effects. Some of the other numerous instrument characteristics that can affect methods transfer - but which will not be discussed - include gradient formation, limits of detection , injection modes.
  • #13 Before we discuss the specific challenges let’s review some of the more common terms: Dwell volume: The volume between the point of mixing of solvents (usually in the mixing chamber or at the proportioning valves in the liquid chromatograph) and the head of an LC column. Important in gradient elution or in isocratic elution situations when changes in solvent composition are made so that the column experiences the composition change in the shortest possible time. Low-pressure mixing systems generally have larger dwell volumes than high-pressure mixing systems. Extracolumn volume: The volume between the effective injection point and the effective detection point, excluding the part of the column containing the stationary phase. It comprises the volumes of the injector, connecting lines and frits, and the detector. It determines the extracolumn effects. Extracolumn effects: The total band broadening effects of all parts of the chromatographic system outside of the column itself. Extracolumn effects must be minimized to maintain the efficiency of a column. Sources of band broadening can include the injector design, injection volume, connecting tubing, endfittings, frits, detector cell volume, and internal detector tubing. The variances of all of these contributions are additive
  • #15 Let’s look at a diagram of how the system volume impacts a gradient separation. In black, we have the composition of the mobile phase at the mixer – we have programmed a gradient. In blue, we have the solvent composition at the head of the column. At the beginning of a gradient, there is solvent already in the system. This solvent is pushed through the system, and through the column – resulting in an isocratic hold at the beginning of every gradient. That system volume creates an offset before the solvent composition we have programmed reaches the head of the column – you can see this offset in the difference in the overlays of the black and blue lines. So how can this affect our method transfer?
  • #16 Dwell Volume is the volume of liquid that must be delivered for a programmed gradient to reach the head of the column. The grey trace in the figure is the programmed gradient. How can dwell volume be measured? The dwell volume then can be calculated using the shown formula at when then gradient is at 50% B   The solvent A is methanol and solvent B is methanol containing a UV absorbing compound for example 15 mg/ml of propylparaben or caffeine. A UV detector is connected directly to the outlet of the gradient system (no column). A small amount of back pressure should be applied to the system at the outlet of the detector (be sure not to exceed the pressure limit of the detector). The gradient is then programmed from zero to 100 % B
  • #17 Here are some system specific measurements of dwell volume and dispersion. The dwell volume measurements were made with the system in its default configuration. While the band spread or extra column volume measurements with the configuration of the instrument as it is intended to be used. (Some instruments have multiple configurations or tubing kits and flow cells which can have a significant impact on band spread). In each of these configurations there were slight differences in the band spread measurements. All the systems are quaternary pumps except for the I-Class ( Last line) What is most noticeable are the differences in system volume both are over a 5x fold range. We will explore now how these characteristics can have an impact on methods transfer. Conditions: Dwell Volume Mobile phase A: 80/20 Water/2-Propanol Mobile phase B: 80/20 Water/2-Propanol with 0.010 mg/L Caffeine Wavelength : 245 nm Flow rate: 0.25 mL/min Restrictor: ISM Capillary Tube, (p/n 700009715)
  • #18 However, as we showed earlier while the dwell volume differences across HPLC’s is not that dramatic, the difference from UPLC to HPLC is greater. In this slide we ran a UV absorbent compound in our Mobile phase B or organic solvent at 0.4mL/min from 5-90% B in 16 minutes. The UV response illustrates the differences in dwell volume across the two systems. The longer gradient hold on the HPLC system is clear in the extended initial hold at the beginning of the gradient. Since the UPLC has a smaller dwell volume, the UPLC gradient (blue) takes much less time to reach the head of the column than in the case of the HPLC (red) which has a larger dwell volume; creating an offset before the solvent composition we have programmed reaches the head of the column . This is why it is important to know the volume of the original and target system. Throughout the gradient we can see the delay in the HPLC trace. Also at the hold at the high organic there also appears to be some difference in the asymptote which indicates that the mixing on the HPLC system requires longer to equilibrate. Lastly the delay at the back end of the gradient clearly shows how equilibration can be affected. For HPLC systems the equilibration time may need to be extended
  • #19 When speaking to generic pharma houses, USP 621 guidance will be an influencing factor on the customers desire or ability to change. Recent adjustments have provided improved flexibility for isocratic assays, but have all but removed the ability to change gradient methods. Understanding this information and the importance of these factors, how can HPLC fluidics be emulated? One manner, in which we are taking with the ACQUITY Arc system, is to match dwell volume and mixing behavior of the system without needing to change the gradient table. Other methods, that are undesireable, are to adjust the gradient table to account for mixing behavior and dwell volume difference or to mask the differences via software as Agilent are doing. The Agilent iSET software manages these differences by delivering a very different gradient than what is actually programmed in the method and registered with the regulatory agencies. This is a very questionable practice that we want to continue to place the seed of doubt.
  • #20 As mentioned before, The ACQUITY Arc system provides the user a very elegant solution that allows the ability to simply select between path 1 and path 2 through a drop down menu selection. In this case, the Flow path 1 was used since we want to emulate hplc dwell volume. If necessary, gradient smartstart can also be used to match retention times. Entries can be made in either volume or time. You can enter difference in retention time between the LC you are transferring from to the Arc. ---- Note: There is an Application Note in the review illustrating the Gradient SmartStart feature in use for a transfer from Agilent LC to ACQUITY Arc. The Application note will be published to www.waters.com by launch of the ACQUITY Arc.
  • #21 If we run the system dwell volume measurement test on both paths of the ACQUITY Arc we can see the difference in the lift off of the gradient. Path 2 (red trace)with the lower dwell volume of 0.770 mL starts the gradient earlier than Path 1(Blue trace).
  • #22 How does this impact our chromatography? Well since the dwell or gradient delay volume is reduced. This results in earlier retention times when
  • #26 As mentioned before, The ACQUITY Arc system provides the user a very elegant solution that allows the ability to simply select between path 1 and path 2 through a drop down menu selection. In this case, the Flow path 1 was used since we want to emulate hplc dwell volume. If necessary, gradient smartstart can also be used to match retention times. Entries can be made in either volume or time. You can enter difference in retention time between the LC you are transferring from to the Arc. ---- Note: There is an Application Note in the review illustrating the Gradient SmartStart feature in use for a transfer from Agilent LC to ACQUITY Arc. The Application note will be published to www.waters.com by launch of the ACQUITY Arc.
  • #33 We have categorized LC systems into 3 categories, HPLC, UHPLC and UPLC based on dispersion. HPLC has a dispersion of 30 uL or greater, UHPLC between 12 – 30 uL and UPLC with a dispersion level less than 12 uL. Due to these dispersion levels, we can appropriately match the right type of column size (volume) with the system dispersion. UPLC, having a very low dispersion volume, provides the greatest flexibility in terms of the columns that can be run on the system. Examples of systems in each category are listed as well where ACQUITY Arc falls within the UHPLC category. The UHPLC category is fairly broad and the systems within that category is also very large. All of Waters competitive systems with the “UHPLC” designation do fall within this dispersion range such as the 1290 UHPLC, Thermo Vanquish as well as the 1260SL.
  • #34 Conditions: Union in place of column Flow rate: 300uL/min Injection Volume: 1uL Sampling Rate: 50Hz Caffeine - 0.050mg/mL (UV Absorbance standard solution 4) Isocratic: 30/70 Water/ACN Column Compartment Temperature: Off Wavelength: 273nm
  • #35 Here are some system specific measurements of dwell volume and dispersion. The dwell volume measurements were made with the system in its default configuration. While the band spread or extra column volume measurements with the configuration of the instrument as it is intended to be used. (Some instruments have multiple configurations or tubing kits and flow cells which can have a significant impact on band spread). In each of these configurations there were slight differences in the band spread measurements. All the systems are quaternary pumps except for the I-Class ( Last line) What is most noticeable are the differences in system volume and band spread – both are over a 5x fold range. We will explore now how these characteristics can have an impact on methods transfer. Conditions: Bandspread: Mobile Phase: 50/50 Water ACN Sample: Caffeine, 0.160 mg/mL in 50:50 Acetonitrile:Water (SQT Kit #700002642 Solution #7 or 6, or 8 ) Flow rate: 0.3 mL/min Injection volume: 1uL Sampling rate: 40 Hz Filter constant: off Union: low volume v- detail (p/n 700002636) Number of injections: 6
  • #36 An appropriate measure of dispersion impact can be done by performing an isocratic separation. Here we can see the impact of various column diameters across different types of LC systems and dispersion values. The smaller the column volume, the more important the system dispersion becomes. Conditions: Isocratic separation, 50:50 0.1% (v/v) TFA in Water:0.1% (v/v) TFA in CAN UHPLC- HPLC- Alliance HPLC ( measured 43 μL); ACQUITY Arc System (not measured, specs 25-30 μL), UPLC- CQUITY UPLC H-Class (measured 8.5 μL). Sample diluent – 1:1 H2O:MeOH UPLC Column: CORTECS C18 1.6 μ m, 2.1 x 50mm; Flow rate: UPLC – 0.3mL/min Injection volume: 1 uL Diluent: 1:1 Water:Methanol Sample concentration: 0.1 mg/mL Sample: 1-Impramine, 2- Chloropromazine; 3,4 - 11-alpha-hydryprogesterone and 17-alpha-hydroxyprogesterone ( same m/z) Wavelength: 254 nm Sampling rate: 10 pts/s UHPLC Column: CORTECS C18 XP 2.7 μm, 3.0 x 75mm; Flow rate: UPLC – 0.612mL/min Injection volume: 3.1 uL Diluent: 1:1 Water:Methanol Sample concentration: 0.1 mg/mL Sample: 1-Impramine, 2- Chloropromazine; 3,4 - 11-alpha-hydryprogesterone and 17-alpha-hydroxyprogesterone ( same m/z) Wavelength: 254 nm Sampling rate: pts/s UPLC Column: CORTECS C18 1.6 μ m, 2.1 x 50mm; Flow rate: UPLC – 0.3mL/min Injection volume: 1 uL Diluent: 1:1 Water:Methanol Sample concentration: 0.1 mg/mL Sample: 1-Impramine, 2- Chloropromazine; 3,4 - 11-alpha-hydryprogesterone and 17-alpha-hydroxyprogesterone ( same m/z) Wavelength: 254 nm Sampling rate: 10 pts/s HPLC Column: CORTECS C18, 2.7 μm, 4.6 x 75 mm; Flow rate: UPLC – 1.44mL/min Injection volume: 7.2 uL Diluent: 1:1 Water:Methanol Sample concentration: 0.1 mg/mL Sample: 1-Impramine, 2- Chloropromazine; 3,4 - 11-alpha-hydryprogesterone and 17-alpha-hydroxyprogesterone ( same m/z) Wavelength: 254 nm Sampling rate: pts/s
  • #37 We can clearly see that we will not achieve adequate performance for column ID’s less than 4.6 mm on HPLC, or less than 3.0 mm ID on UHPLC Conditions: Isocratic separation, 50:50 0.1% (v/v) TFA in Water:0.1% (v/v) TFA in CAN UHPLC- HPLC- Alliance HPLC ( measured 43 μL); ACQUITY Arc System (not measured, specs 25-30 μL), UPLC- CQUITY UPLC H-Class (measured 8.5 μL). Sample diluent – 1:1 H2O:MeOH UPLC Column: CORTECS C18 1.6 μ m, 2.1 x 50mm; Flow rate: UPLC – 0.3mL/min Injection volume: 1 uL Diluent: 1:1 Water:Methanol Sample concentration: 0.1 mg/mL Sample: 1-Impramine, 2- Chloropromazine; 3,4 - 11-alpha-hydryprogesterone and 17-alpha-hydroxyprogesterone ( same m/z) Wavelength: 254 nm Sampling rate: 10 pts/s UHPLC Column: CORTECS C18 XP 2.7 μm, 3.0 x 75mm; Flow rate: UPLC – 0.612mL/min Injection volume: 3.1 uL Diluent: 1:1 Water:Methanol Sample concentration: 0.1 mg/mL Sample: 1-Impramine, 2- Chloropromazine; 3,4 - 11-alpha-hydryprogesterone and 17-alpha-hydroxyprogesterone ( same m/z) Wavelength: 254 nm Sampling rate: pts/s UPLC Column: CORTECS C18 1.6 μ m, 2.1 x 50mm; Flow rate: UPLC – 0.3mL/min Injection volume: 1 uL Diluent: 1:1 Water:Methanol Sample concentration: 0.1 mg/mL Sample: 1-Impramine, 2- Chloropromazine; 3,4 - 11-alpha-hydryprogesterone and 17-alpha-hydroxyprogesterone ( same m/z) Wavelength: 254 nm Sampling rate: 10 pts/s HPLC Column: CORTECS C18, 2.7 μm, 4.6 x 75 mm; Flow rate: UPLC – 1.44mL/min Injection volume: 7.2 uL Diluent: 1:1 Water:Methanol Sample concentration: 0.1 mg/mL Sample: 1-Impramine, 2- Chloropromazine; 3,4 - 11-alpha-hydryprogesterone and 17-alpha-hydroxyprogesterone ( same m/z) Wavelength: 254 nm Sampling rate: pts/s
  • #38 Of course a majority of separations are in gradient form, and this does diminish the impact of extra-column dispersion on the separation. In this case, comparing a gradient USP assay for Diclazuril run on a UHPLC and a UPLC instrument, we can still see an impact on separation performance although less significant than what was observed for the isocratic comparison.
  • #39 Another important part of dispersion and how it can affect a separation is in the post column band broadening. Most of this band broadening is due to the flow cell characteristics and /or the tubing. In the instances where there are multiple flow cells available it is important to optimize the detector for the column dimensions and/or separation, In this example, a 2.1 x 75 mm CORTECS column was run on an Alliance HPLC System, with the analytical 10mm flow cell (8.7 uL) and the 8mm microbore flow cell ( 4.1 uL). The lower dispersion microbore flow cell has a noticeable impact on the resolution of the flavonoids in orange extract, with improved resolution from 1,1-1.8 to 2.5 – 1.6
  • #41 In this example a method on a small ID CORTECS column 2.1 x 75 mm was transferred from a UPLC to an Alliance HPLC system. While the UPLC has an active pre-heater integrated into its design, the Alliance HPLC system originally had no preheating device. In this method transfer the loss of resolution and poor peak shape was evident. However once the same separation was run on the Alliance system with a preheater, the thermal mismatch effects disappeared and the peak shape improved, While the sensitivity is lower due to the greater extra column dispersion of the system, the method transfer is much more acceptable, whether the criteria are resolution or sensitivity, than without the preheating.
  • #42 Column heating technology, as mentioned are offered 3 options. Two of which are Alliance style 30 cm CH and CHC ovens with new lower dispersion passive preheaters. Either of these options can also include an optional 3 column selection valve. The third is the CH30-A for those that can benefit from eCord Technology and active preheating.
  • #44 Temperature preheating can impact
  • #45 As we mentioned before the dispersion within a system can have an impact on methods transfer in terms of the strong solvent effects of the early eluting peaks, particularly when the injection volumes and the column ID’s are larger and strong sample diluents are used. In these instances inadequate mixing between the sample diluent and the mobile phase may occur on a lower dispersion instrument. Again looking at the same isocratic sample with three components with low k’ <1 but this time with a strong sample , we can see the impact in the strong solvent effects. When the method which was originally developed on a 2.1 x 50 mm sub 2 um column was scaled up to 4.6 x 75 mm column, and run on two low dispersion instruments, strong solvent effects were observed for both separations , for the early eluting peaks. The effects were eliminated by lowering the injection volume or scaling the method down to a 3.0 x 75mm column with the appropriate injection volume. This is due to the fact that adequate mixing is occurring between the injection plug and the mobile phase. There are multiple other approaches to minimize these effects: add post injector, pre column volume for better mixing, change sample diluent- given the relationship between peak volume and sample diluent , a weaker diluent allows a larger inject a larger volume.
  • #46 Additionally, one of the challenges with transferring methods on existing platforms, such as the H-Class, is that we have done such a good job managing dispersion, it is not as tolerant of injecting large volumes of samples dissolved in high amounts of organic. About 85% of methods will transfer to H-Class without issue, but there are a certain percentage that do run into this issue. The ACQUITY Arc is designed to accommodate this situation due to its larger volume fluidics. If we look at this graph, the open diamond and triangles are the Agilent LC systems and the closed circles is the ACQUITY Arc system. What we are looking at is that as larger volumes are injected, peaks start to front and then split. We can see that the ACQUITY Arc and Agilent LC’s are very similar in this behavior. An optional post injection mixer can be added to increase the tolerance of these high organic sample diluents even further..
  • #52 Here is a another example of the ability of the ACQUITY Arc System to emulate another LC. In this case showing an HPLC separation of water soluble vitamins using phosphate buffer. In this case, the only adjustment was utilizing gradient smart start which offset the injection from the gradient by 0.21 minutes. This feature is necessary in some cases due to the variable volume nature of the Agilent 1100 and 1260 systems. They can vary as much as 400 uL in dwell volume dependent on the flow rate and pressure that the system is running. Again, Gradient SmartStart does not alter the gradient in any way and has been successfully used in many validated assays by our existing customers.
  • #53 Top is ARC. Upon method transfer : Comparable separation in terms of Rs and relative peak areas for K0 and K1 peaks. --- *Result IDs: 4207, 4208, 4209, 4210, 4211, 4212 (Arc) 4227, 4228, 4237, 4230, 4231 (Agilent) Samples were auto-integrated using Apex Tracking. Note: Slight differences in RT. This could be owed to the differences the two systems . Perhaps due to column manager design . The important thing to note here is that the selectivities are the same across both the separations and the Rs is comparable.
  • #54 The acceptance criteria for Area of K1 was that the %RSD should be NMT 2.0% and the Rs for peak K0-K1 should be NLT 1.5. Clearly, these precision studies show that the transferred method successfully passes the usp acceptance criteria by a wide margin. ------ Additional *Result IDs: 4207, 4208, 4209, 4210, 4211, 4212 (Arc) 4227, 4228, 4237, 4230, 4231 (Agilent) Samples were auto-integrated using Apex Tracking. CEX Results, Precision (Repeatability) Experiment performed in a single day with six injections
  • #55 Lastly the studies illustrate the impact of a number of variable and how these can affect methods transfer
  • #56 If we compare our quaternary based LC portfolio, the greatest amount of flexibility is provided on the H-Class system being able to accommodate HPLC, UHPLC and UPLC analysis. All 3 systems are appropriate for routine analysis and QA/QC. However, more complex samples requiring higher resolution and sensitivity should be conducted on the H-Class. All 3 systems are also appropriate for method development. However, the H-Class system will provide the fastest and most productive method development approach. The Arc system is more geared towards method transfer. And due to the dispersion targets, the most appropriate column ID is smaller as the dispersion of the system is reduced.
  • #57 That is why we developed the ACQUITY Arc System. Significant productivity gains can now be realized by deploying a single LC platform that allows the efficient transfer, adjustment, or improvement of methods from any LC platform without compromise, significantly lowering the barriers to entry. The three key abilities of the system are to: Replicate established assays that were developed on older HPLC platforms. This system is designed to easily move methods from and HPLC platform to ACQUITY Arc by emulating both dwell volume and mixing behavior. In addition to being able to replicate established assays, users can improve their productivity by pairing the system with 2.5-2.7 um UHPLC column technology, without making any manual adjustments to the system Lastly, the ACQUITY Arc is the ideal platform to accept UPLC methods that have been adjusted to larger particle sizes. The ideal scenario would be for an organization to have UPLC from early on the product lifecycle through commercialization. However, more often than not, the LC technology does get diluted as it moves towards commercialization, often taking a UPLC method and downgrading it to a larger particle size. The ACQUITY Arc can make that transition very simple.