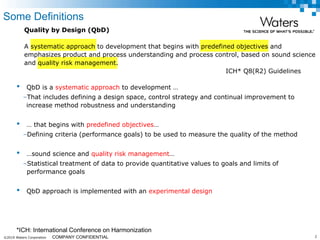
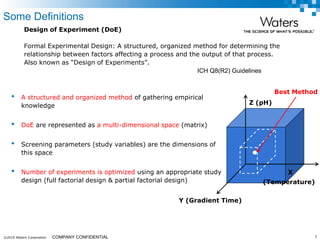
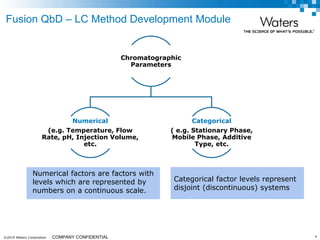
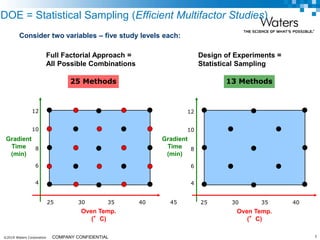
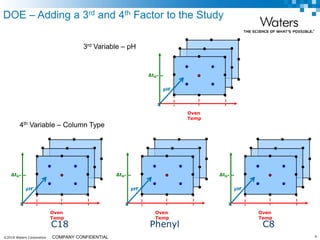
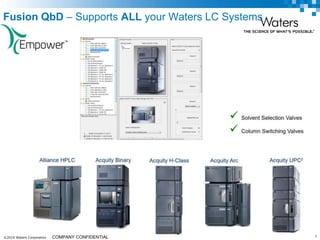
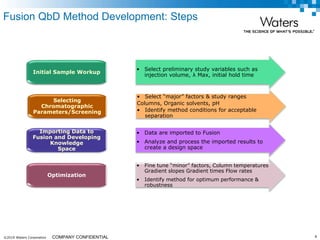
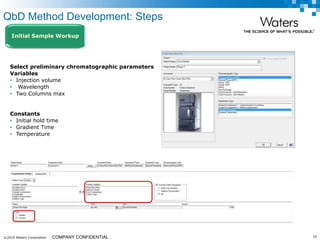
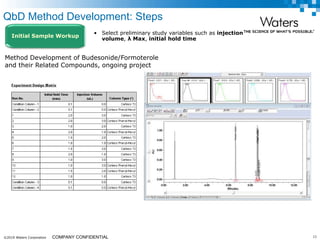
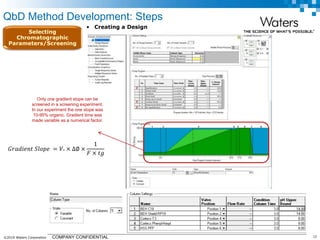
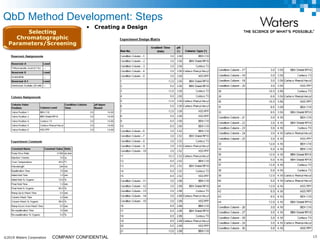
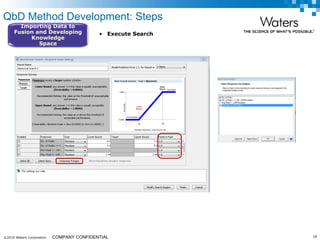
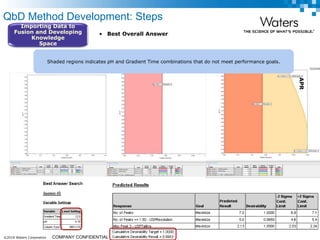
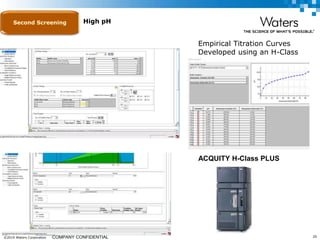
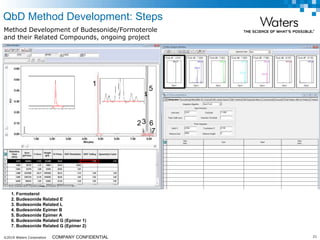
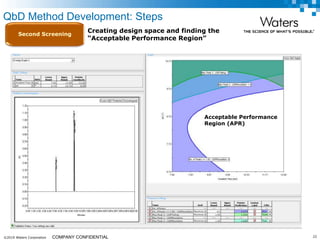
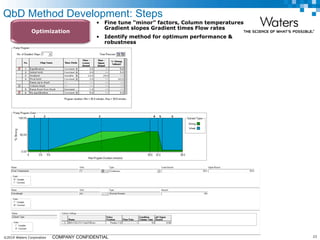
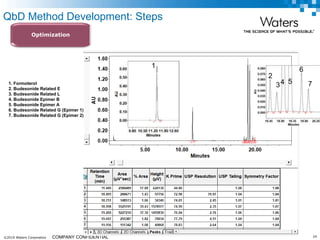
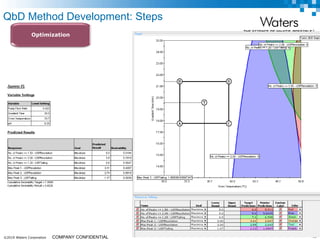
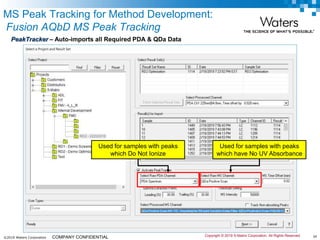
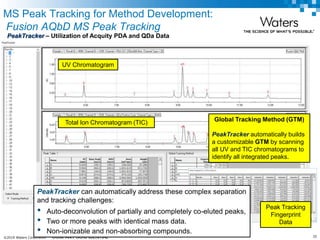
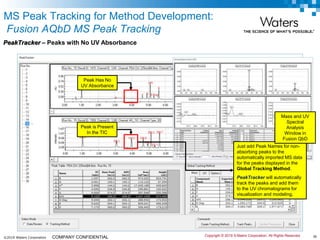
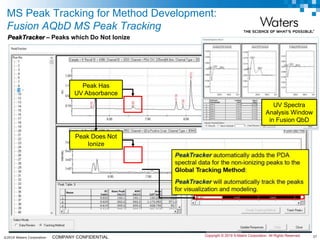
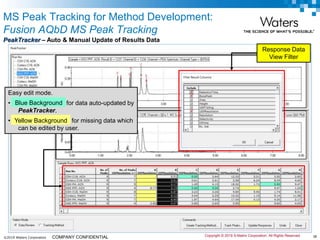
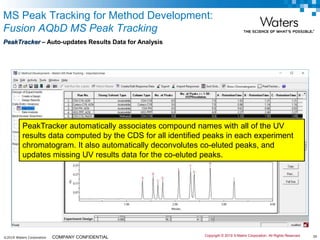
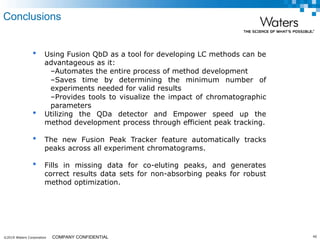
SlideShare a Scribd company logo
1 of 41
©2019 Waters Corporation 1COMPANY CONFIDENTIAL©2019 Waters Corporation COMPANY CONFIDENTIAL
Using Fusion QbD® as an
Analytical Quality by Design
Software for Method Development
Pittcon
20-March-2019
Oral Session: 01:30-2:30
Fadi Alkhateeb, Senior Scientist
Waters Corporation, Milford MA
©2019 Waters Corporation 2COMPANY CONFIDENTIAL
• QbD is a systematic approach to development …
–That includes defining a design space, control strategy and continual improvement to
increase method robustness and understanding
• … that begins with predefined objectives…
–Defining criteria (performance goals) to be used to measure the quality of the method
• …sound science and quality risk management…
–Statistical treatment of data to provide quantitative values to goals and limits of
performance goals
• QbD approach is implemented with an experimental design
*ICH: International Conference on Harmonization
Quality by Design (QbD)
A systematic approach to development that begins with predefined objectives and
emphasizes product and process understanding and process control, based on sound science
and quality risk management.
ICH* Q8(R2) Guidelines
Some Definitions
©2019 Waters Corporation 3COMPANY CONFIDENTIAL
Design of Experiment (DoE)
Formal Experimental Design: A structured, organized method for determining the
relationship between factors affecting a process and the output of that process.
Also known as “Design of Experiments”.
ICH Q8(R2) Guidelines
• A structured and organized method of gathering empirical
knowledge
• DoE are represented as a multi-dimensional space (matrix)
• Screening parameters (study variables) are the dimensions of
this space
• Number of experiments is optimized using an appropriate study
design (full factorial design & partial factorial design)
X
(Temperature)
Y (Gradient Time)
Z (pH)
Best Method
Some Definitions
©2019 Waters Corporation 4COMPANY CONFIDENTIAL
Chromatographic
Parameters
Numerical
(e.g. Temperature, Flow
Rate, pH, Injection Volume,
etc.
Categorical
( e.g. Stationary Phase,
Mobile Phase, Additive
Type, etc.
Fusion QbD – LC Method Development Module
Numerical factors are factors with
levels which are represented by
numbers on a continuous scale.
Categorical factor levels represent
disjoint (discontinuous) systems
©2019 Waters Corporation 5COMPANY CONFIDENTIAL
DOE = Statistical Sampling (Efficient Multifactor Studies)
Consider two variables – five study levels each:
25 Methods
Gradient
Time
(min)
Oven Temp.
(°C)
Full Factorial Approach =
All Possible Combinations
25 30 35 40 45
12
10
8
6
4
13 Methods
Oven Temp.
(°C)
Gradient
Time
(min)
Design of Experiments =
Statistical Sampling
25 30 35 40
12
10
8
6
4
©2019 Waters Corporation 6COMPANY CONFIDENTIAL
DOE – Adding a 3rd and 4th Factor to the Study
3rd Variable – pH
Oven
Temp
∆tG
pH
Oven
Temp
∆tG
pH
C18 Phenyl C8
Oven
Temp
∆tG
pH
Oven
Temp
∆tG
pH
4th Variable – Column Type
©2019 Waters Corporation 7COMPANY CONFIDENTIAL
Fusion QbD – Supports ALL your Waters LC Systems
©2019 Waters Corporation 8COMPANY CONFIDENTIAL
• Select preliminary study variables such as
injection volume, λ Max, initial hold time
• Select “major” factors & study ranges
Columns, Organic solvents, pH
• Identify method conditions for acceptable
separation
• Data are imported to Fusion
• Analyze and process the imported results to
create a design space
• Fine tune “minor” factors, Column temperatures
Gradient slopes Gradient times Flow rates
• Identify method for optimum performance &
robustness
Optimization
Importing Data to
Fusion and Developing
Knowledge
Space
Initial Sample Workup
Selecting
Chromatographic
Parameters/Screening
Fusion QbD Method Development: Steps
©2019 Waters Corporation 9COMPANY CONFIDENTIAL
Method Development for Symbicort® Using Fusion Software
Budesonide, Mwt= 430.53 g/mol
(A pair of epimers) Formoterol, Mwt= 344.41 g/mol
Budesonide Related
Compound L,
Mwt= 428.22 g/mol
Budesonide Related
Compound E,
Mwt= 428.22 g/mol
Budesonide Related
Compound G,
Mwt= 432.25 g/mol
( A pair of epimers)
©2019 Waters Corporation 10COMPANY CONFIDENTIAL
QbD Method Development: Steps
Initial Sample Workup
Select preliminary chromatographic parameters
Variables
• Injection volume
• Wavelength
• Two Columns max
Constants
• Initial hold time
• Gradient Time
• Temperature
©2019 Waters Corporation 11COMPANY CONFIDENTIAL
QbD Method Development: Steps
Initial Sample Workup
• Select preliminary study variables such as injection
volume, λ Max, initial hold time
Method Development of Budesonide/Formoterole
and their Related Compounds, ongoing project
©2019 Waters Corporation 12COMPANY CONFIDENTIAL
QbD Method Development: Steps
Only one gradient slope can be
screened in a screening experiment.
In our experiment the one slope was
10-95% organic. Gradient time was
made variable as a numerical factor.
𝐺𝑟𝑎𝑑𝑖𝑒𝑛𝑡 𝑆𝑙𝑜𝑝𝑒 = 𝑉° × ∆∅ ×
1
𝐹 × 𝑡𝑔
Selecting
Chromatographic
Parameters/Screening
• Creating a Design
©2019 Waters Corporation 13COMPANY CONFIDENTIAL
QbD Method Development: Steps
Selecting
Chromatographic
Parameters/Screening
• Creating a Design
©2019 Waters Corporation 14COMPANY CONFIDENTIAL
QbD Method Development: Steps
Selecting
Chromatographic
Parameters/Screening
• Exporting methods to Empower
©2019 Waters Corporation 15COMPANY CONFIDENTIAL
Fusion Creates all methods and method
sets for Empower (time saving!)
The created Sample Set can be
modified/customized
It also creates all methods and method
sets for equilibration/conditioning.
QbD Method Development: Steps
Selecting
Chromatographic
Parameters/Screening
• Exporting methods to Empower
©2019 Waters Corporation 16COMPANY CONFIDENTIAL
1. Formoterol
2. Budesonide Related E
3. Budesonide Related L
4. Budesonide Epimer B
5. Budesonide Epimer A
6. Budesonide Related G (Epimer 1)
7. Budesonide Related G (Epimer 2)
1
23
4
5
6
7
Method Development of Budesonide/Formoterole
and their Related Compounds, ongoing project
QbD Method Development: Steps
©2019 Waters Corporation 17COMPANY CONFIDENTIAL
Importing Data to
Fusion and Developing
Knowledge
Space
QbD Method Development: Steps
©2019 Waters Corporation 18COMPANY CONFIDENTIAL
Importing Data to
Fusion and Developing
Knowledge
Space
QbD Method Development: Steps
• Execute Search
©2019 Waters Corporation 19COMPANY CONFIDENTIAL
Importing Data to
Fusion and Developing
Knowledge
Space
QbD Method Development: Steps
• Best Overall Answer
Shaded regions indicates pH and Gradient Time combinations that do not meet performance goals.
APR
©2019 Waters Corporation 20COMPANY CONFIDENTIAL
Second Screening
Empirical Titration Curves
Developed using an H-Class
High pH
ACQUITY H-Class PLUS
©2019 Waters Corporation 21COMPANY CONFIDENTIAL
1. Formoterol
2. Budesonide Related E
3. Budesonide Related L
4. Budesonide Epimer B
5. Budesonide Epimer A
6. Budesonide Related G (Epimer 1)
7. Budesonide Related G (Epimer 2)
1
23
4
5
6
7
Method Development of Budesonide/Formoterole
and their Related Compounds, ongoing project
QbD Method Development: Steps
©2019 Waters Corporation 22COMPANY CONFIDENTIAL
Second Screening
Creating design space and finding the
“Acceptable Performance Region”
QbD Method Development: Steps
Acceptable Performance
Region (APR)
©2019 Waters Corporation 23COMPANY CONFIDENTIAL
• Fine tune “minor” factors, Column temperatures
Gradient slopes Gradient times Flow rates
• Identify method for optimum performance &
robustness
Optimization
QbD Method Development: Steps
©2019 Waters Corporation 24COMPANY CONFIDENTIAL
Optimization
QbD Method Development: Steps
1
2
3 5
6
741. Formoterol
2. Budesonide Related E
3. Budesonide Related L
4. Budesonide Epimer B
5. Budesonide Epimer A
6. Budesonide Related G (Epimer 1)
7. Budesonide Related G (Epimer 2)
©2019 Waters Corporation 25COMPANY CONFIDENTIAL
Optimization
QbD Method Development: Steps
©2019 Waters Corporation 26COMPANY CONFIDENTIAL
Tracking Peaks by UV spectra is very difficult
 Chemically related compounds, such as process impurities, and degradation products often have
similar UV Spectra
 Coeluting peaks have spectra that are a blend of the individual peaks
– Difficult to interpret
– Cannot determine which components are coeluting by UV Spectra alone
– For related species, UV tracking requires separate injections using pure standards, which
decreases efficiency of laboratory's workflow
Empower MS Tracking
 Empower MS Peak tracking uses the mass-to-charge (m/z) ratio to automatically track each peak in a
sample injection
 Using mass spectra data for peak tracking enables analytical laboratory to correctly monitor peak
retention during method development experiments
Peak Tracking
MS Peak Tracking for Method Development
©2019 Waters Corporation 27COMPANY CONFIDENTIAL
MS Peak Tracking for Method Development:
Empower 3 MS Peak Tracking
 Specify Spectra for assigned mass
 The Assigned Mass Precision past the decimal point
- Default values of 0 or 1 are suitable for a quadrupole mass
detector
©2019 Waters Corporation 28COMPANY CONFIDENTIAL
Spectra for Assigned Mass
Spectra for
Assigned
Mass
Description
None Peak tracking processing is disabled. As a result,
the Assigned Mass Precision field is disabled.
Apex Peak tracking is enabled and the Base Peak value
obtained from the peak’s apex spectra is copied into
the peak’s Assigned Mass Value field. Enter a value
in the Assigned Mass Precision field to specify how
many digits to display after the decimal when
formatting the Assigned Mass Value field as a string
in the Assigned Mass field.
Combined Peak tracking is enabled and the Base Peak
(Combined) value obtained from the peak’s
combined spectra is copied into the peak’s Assigned
Mass Value field. The combined spectrum is the
average mass spectrum across the peak centered
on the apex. Enter a value in the Assigned Mass
Precision field to specify how many digits to display
after the decimal when formatting the Assigned
Mass Value field as a string in the Assigned Mass
field.
MS Peak Tracking for Method Development:
Empower 3 MS Peak Tracking
% Peak height
Combined
spectra
Peak height
©2019 Waters Corporation 29COMPANY CONFIDENTIAL
 Peak table displays assigned mass
(m/z) to each peak
 Fields in software
– Assigned Mass
– Assigned Mass Value (m/z)
– Notes
CSH C18
Process chromatographic
data
Review Data Window
MS Peak Tracking for Method Development:
Empower 3 MS Peak Tracking
©2019 Waters Corporation 30COMPANY CONFIDENTIAL
Peaks with the Same Assigned Mass
Review Data Window
2 peaks with the
same masses
AU
0.00
0.20
0.40
Minutes
1.00 1.50 2.00 2.50 3.00 3.50
1-286.1
2-300.1
3-342.1
4-316.0
5-182.0
6-202.0
7-202.0
8-224.1
9-258.0
Peak #7 - 2.483 - QDa 1: MS Scan
Leading Apex Trailing
202.0
196.0
202.0 196.0
202.0
2 coeluting peaks
Imp. C: 202.0 m/z
Imp. H: 196.0 m/z
Method development: CSH Phenyl Hexyl
MS Peak Tracking for Method Development:
Empower 3 MS Peak Tracking
©2019 Waters Corporation 31COMPANY CONFIDENTIAL
Manually Modify Assign Mass
Review Data
Manually modify Assigned Mass for peak 7
Right click on the
table to modify
the mass
 Enter the correct mass, and a note explaining why the
change was made
 After you have made your changes, don’t forget to save
the new result
MS Peak Tracking for Method Development:
Empower 3 MS Peak Tracking
©2019 Waters Corporation 32COMPANY CONFIDENTIAL
Manually Modified Mass
Review Data
Manually assigned mass
for peak 7
AU
0.00
0.20
0.40
Minutes
1.00 1.50 2.00 2.50 3.00 3.50
1-286.1
2-300.1
3-342.1
4-316.0
5-182.0
6-202.0
7-196.0
8-224.1
9-258.0
MS Peak Tracking for Method Development:
Empower 3 MS Peak Tracking
©2019 Waters Corporation 33COMPANY CONFIDENTIAL
Facilitate Method Development: Column Screening
AU
0.00
0.15
0.30
AU
0.00
0.20
0.40
AU
0.00
0.15
0.30
AU
0.00
0.12
0.24
Minutes
0.00 0.50 1.00 1.50 2.00 2.50 3.00 3.50 4.00 4.50 5.00
CSH C18
CORTECS C18+
CSH Phenyl Hexyl
HSS PFP
MS Peak Tracking for Method Development:
Empower 3 MS Peak Tracking
©2019 Waters Corporation 34COMPANY CONFIDENTIAL
PeakTracker – Auto-imports all Required PDA & QDa Data
Used for samples with peaks
which Do Not Ionize
Used for samples with peaks
which have No UV Absorbance
Copyright © 2019 S-Matrix Corporation. All Rights Reserved.
MS Peak Tracking for Method Development:
Fusion AQbD MS Peak Tracking
©2019 Waters Corporation 35COMPANY CONFIDENTIAL
PeakTracker – Utilization of Acquity PDA and QDa Data
Peak Tracking
Fingerprint
Data
UV Chromatogram
Total Ion Chromatogram (TIC)
PeakTracker can automatically address these complex separation
and tracking challenges:
• Auto-deconvolution of partially and completely co-eluted peaks,
• Two or more peaks with identical mass data.
• Non-ionizable and non-absorbing compounds.
Global Tracking Method (GTM)
PeakTracker automatically builds
a customizable GTM by scanning
all UV and TIC chromatograms to
identify all integrated peaks.
MS Peak Tracking for Method Development:
Fusion AQbD MS Peak Tracking
©2019 Waters Corporation 36COMPANY CONFIDENTIAL
Peak Has No
UV Absorbance
Peak is Present
In the TIC
Just add Peak Names for non-
absorbing peaks to the
automatically imported MS data
for the peaks displayed in the
Global Tracking Method.
PeakTracker will automatically
track the peaks and add them
to the UV chromatograms for
visualization and modeling.
Mass and UV
Spectral
Analysis
Window in
Fusion QbD
PeakTracker – Peaks with No UV Absorbance
Copyright © 2019 S-Matrix Corporation. All Rights Reserved.
MS Peak Tracking for Method Development:
Fusion AQbD MS Peak Tracking
©2019 Waters Corporation 37COMPANY CONFIDENTIAL
Peak Has
UV Absorbance
Peak Does Not
Ionize
PeakTracker – Peaks which Do Not Ionize
UV Spectra
Analysis Window
in Fusion QbD
Copyright © 2019 S-Matrix Corporation. All Rights Reserved.
MS Peak Tracking for Method Development:
Fusion AQbD MS Peak Tracking
©2019 Waters Corporation 38COMPANY CONFIDENTIAL
PeakTracker – Auto & Manual Update of Results Data
Response Data
View Filter
Easy edit mode.
• Blue background for data auto-updated by
PeakTracker.
• Yellow background for missing data which
can be edited by user.
Blue Background
Yellow Background
Copyright © 2019 S-Matrix Corporation. All Rights Reserved.
MS Peak Tracking for Method Development:
Fusion AQbD MS Peak Tracking
©2019 Waters Corporation 39COMPANY CONFIDENTIAL
PeakTracker – Auto-updates Results Data for Analysis
PeakTracker automatically associates compound names with all of the UV
results data computed by the CDS for all identified peaks in each experiment
chromatogram. It also automatically deconvolutes co-eluted peaks, and
updates missing UV results data for the co-eluted peaks.
Copyright © 2019 S-Matrix Corporation. All Rights Reserved.
MS Peak Tracking for Method Development:
Fusion AQbD MS Peak Tracking
©2019 Waters Corporation 40COMPANY CONFIDENTIAL
• Using Fusion QbD as a tool for developing LC methods can be
advantageous as it:
–Automates the entire process of method development
–Saves time by determining the minimum number of
experiments needed for valid results
–Provides tools to visualize the impact of chromatographic
parameters
• Utilizing the QDa detector and Empower speed up the
method development process through efficient peak tracking.
• The new Fusion Peak Tracker feature automatically tracks
peaks across all experiment chromatograms.
• Fills in missing data for co-eluting peaks, and generates
correct results data sets for non-absorbing peaks for robust
method optimization.
Conclusions
Using Fusion QbD as an Analytical Quality by Design Software for Method Development

More Related Content

What's hot

Bioanalytical Method Validation
Bioanalytical Method ValidationBioanalytical Method Validation
Bioanalytical Method ValidationSanket Shinde
 
HPLC Method Development & Method Validation (mr.s)
HPLC Method Development & Method Validation (mr.s)HPLC Method Development & Method Validation (mr.s)
HPLC Method Development & Method Validation (mr.s)22suresh
 
Nuclear Magnetic Double Resonance (Decoupling).pptx
Nuclear Magnetic Double Resonance (Decoupling).pptxNuclear Magnetic Double Resonance (Decoupling).pptx
Nuclear Magnetic Double Resonance (Decoupling).pptxRushikeshTidake
 
analytical method validation and validation of hplc
analytical method validation and validation of hplcanalytical method validation and validation of hplc
analytical method validation and validation of hplcvenkatesh thota
 
Difference between HPLC and UPLC
Difference between HPLC and UPLCDifference between HPLC and UPLC
Difference between HPLC and UPLCVrushali Tambe
 
Ich guidelines for validation final
Ich guidelines for validation finalIch guidelines for validation final
Ich guidelines for validation finalsumel ashique
 
ICH Q2 Analytical Method Validation
ICH Q2  Analytical Method ValidationICH Q2  Analytical Method Validation
ICH Q2 Analytical Method ValidationNaila Kanwal
 
Method Development and Method Validation for the estimation of Valganciclovir...
Method Development and Method Validation for the estimation of Valganciclovir...Method Development and Method Validation for the estimation of Valganciclovir...
Method Development and Method Validation for the estimation of Valganciclovir...google
 
Analytical method validation 2020
Analytical method validation 2020Analytical method validation 2020
Analytical method validation 2020PRANJAY PATIL
 
Notes* for the subject 'Advanced Pharmaceutical Analysis'
Notes* for the subject 'Advanced Pharmaceutical Analysis'Notes* for the subject 'Advanced Pharmaceutical Analysis'
Notes* for the subject 'Advanced Pharmaceutical Analysis'Sanathoiba Singha
 
Impurities in drug substance (ich q3 a)
Impurities in drug substance (ich q3 a)Impurities in drug substance (ich q3 a)
Impurities in drug substance (ich q3 a)Bhanu Chava
 
HIGH PERFORMANCE LIQUID CHROMATOGRAPHY
HIGH PERFORMANCE LIQUID CHROMATOGRAPHYHIGH PERFORMANCE LIQUID CHROMATOGRAPHY
HIGH PERFORMANCE LIQUID CHROMATOGRAPHYDr Duggirala Mahendra
 
Qualification of analytical instruments
Qualification of analytical instrumentsQualification of analytical instruments
Qualification of analytical instrumentsFaris ameen
 
USFDA guidelines for bioanalytical method validation
USFDA guidelines for bioanalytical method validationUSFDA guidelines for bioanalytical method validation
USFDA guidelines for bioanalytical method validationbhatiaji123
 
THERMAL TECHNIQUE AND DIFFERENTIAL SCANNING CALORIMETRY
THERMAL TECHNIQUE AND DIFFERENTIAL SCANNING CALORIMETRYTHERMAL TECHNIQUE AND DIFFERENTIAL SCANNING CALORIMETRY
THERMAL TECHNIQUE AND DIFFERENTIAL SCANNING CALORIMETRYAmruta Balekundri
 
HPLC method development
HPLC method developmentHPLC method development
HPLC method developmentAmy Mehaboob
 
Analytical method development and validation
Analytical method development and validationAnalytical method development and validation
Analytical method development and validationANANT NAG
 
Analytical method development,validation by uv spectroscopy
Analytical method development,validation by uv spectroscopyAnalytical method development,validation by uv spectroscopy
Analytical method development,validation by uv spectroscopythota lakshmi bhavani
 

What's hot (20)

Bioanalytical Method Validation
Bioanalytical Method ValidationBioanalytical Method Validation
Bioanalytical Method Validation
 
HPLC Method Development & Method Validation (mr.s)
HPLC Method Development & Method Validation (mr.s)HPLC Method Development & Method Validation (mr.s)
HPLC Method Development & Method Validation (mr.s)
 
Nuclear Magnetic Double Resonance (Decoupling).pptx
Nuclear Magnetic Double Resonance (Decoupling).pptxNuclear Magnetic Double Resonance (Decoupling).pptx
Nuclear Magnetic Double Resonance (Decoupling).pptx
 
analytical method validation and validation of hplc
analytical method validation and validation of hplcanalytical method validation and validation of hplc
analytical method validation and validation of hplc
 
Difference between HPLC and UPLC
Difference between HPLC and UPLCDifference between HPLC and UPLC
Difference between HPLC and UPLC
 
Ich guidelines for validation final
Ich guidelines for validation finalIch guidelines for validation final
Ich guidelines for validation final
 
ICH Q2 Analytical Method Validation
ICH Q2  Analytical Method ValidationICH Q2  Analytical Method Validation
ICH Q2 Analytical Method Validation
 
Method Development and Method Validation for the estimation of Valganciclovir...
Method Development and Method Validation for the estimation of Valganciclovir...Method Development and Method Validation for the estimation of Valganciclovir...
Method Development and Method Validation for the estimation of Valganciclovir...
 
Analytical method validation 2020
Analytical method validation 2020Analytical method validation 2020
Analytical method validation 2020
 
Columns in HPLC
Columns in HPLCColumns in HPLC
Columns in HPLC
 
Notes* for the subject 'Advanced Pharmaceutical Analysis'
Notes* for the subject 'Advanced Pharmaceutical Analysis'Notes* for the subject 'Advanced Pharmaceutical Analysis'
Notes* for the subject 'Advanced Pharmaceutical Analysis'
 
Impurities in drug substance (ich q3 a)
Impurities in drug substance (ich q3 a)Impurities in drug substance (ich q3 a)
Impurities in drug substance (ich q3 a)
 
HIGH PERFORMANCE LIQUID CHROMATOGRAPHY
HIGH PERFORMANCE LIQUID CHROMATOGRAPHYHIGH PERFORMANCE LIQUID CHROMATOGRAPHY
HIGH PERFORMANCE LIQUID CHROMATOGRAPHY
 
Qualification of analytical instruments
Qualification of analytical instrumentsQualification of analytical instruments
Qualification of analytical instruments
 
USFDA guidelines for bioanalytical method validation
USFDA guidelines for bioanalytical method validationUSFDA guidelines for bioanalytical method validation
USFDA guidelines for bioanalytical method validation
 
THERMAL TECHNIQUE AND DIFFERENTIAL SCANNING CALORIMETRY
THERMAL TECHNIQUE AND DIFFERENTIAL SCANNING CALORIMETRYTHERMAL TECHNIQUE AND DIFFERENTIAL SCANNING CALORIMETRY
THERMAL TECHNIQUE AND DIFFERENTIAL SCANNING CALORIMETRY
 
HPTLC
HPTLCHPTLC
HPTLC
 
HPLC method development
HPLC method developmentHPLC method development
HPLC method development
 
Analytical method development and validation
Analytical method development and validationAnalytical method development and validation
Analytical method development and validation
 
Analytical method development,validation by uv spectroscopy
Analytical method development,validation by uv spectroscopyAnalytical method development,validation by uv spectroscopy
Analytical method development,validation by uv spectroscopy
 

Similar to Using Fusion QbD as an Analytical Quality by Design Software for Method Development

Considering Quality by Design (QbD) in Analytical Development for Protein The...
Considering Quality by Design (QbD) in Analytical Development for Protein The...Considering Quality by Design (QbD) in Analytical Development for Protein The...
Considering Quality by Design (QbD) in Analytical Development for Protein The...Weijun Li
 
Compressed Timelines for Breakthrough Therapies: Impact on Process Characteri...
Compressed Timelines for Breakthrough Therapies: Impact on Process Characteri...Compressed Timelines for Breakthrough Therapies: Impact on Process Characteri...
Compressed Timelines for Breakthrough Therapies: Impact on Process Characteri...KBI Biopharma
 
Europe User Conference: ADNOC predictive model of gas oil hydrotreater unit f...
Europe User Conference: ADNOC predictive model of gas oil hydrotreater unit f...Europe User Conference: ADNOC predictive model of gas oil hydrotreater unit f...
Europe User Conference: ADNOC predictive model of gas oil hydrotreater unit f...KBC (A Yokogawa Company)
 
Lean Manufacturing Cost Cutting Methods
Lean Manufacturing   Cost Cutting MethodsLean Manufacturing   Cost Cutting Methods
Lean Manufacturing Cost Cutting MethodsExerciseLeanLLC
 
Episode 27 : Project Management Costs
Episode 27 : Project Management Costs Episode 27 : Project Management Costs
Episode 27 : Project Management Costs SAJJAD KHUDHUR ABBAS
 
Choosing the Right Calibrator Webinar Presented by Druck BHGE and Transcat
Choosing the Right Calibrator Webinar Presented by Druck BHGE and TranscatChoosing the Right Calibrator Webinar Presented by Druck BHGE and Transcat
Choosing the Right Calibrator Webinar Presented by Druck BHGE and TranscatTranscat
 
Episode 27 : Project Management Costs
Episode 27 : Project Management Costs Episode 27 : Project Management Costs
Episode 27 : Project Management Costs SAJJAD KHUDHUR ABBAS
 
Statistical solutions to help you with 5 FDA medical devices stages
Statistical solutions to help you with 5 FDA medical devices stagesStatistical solutions to help you with 5 FDA medical devices stages
Statistical solutions to help you with 5 FDA medical devices stagesMinitab, LLC
 
White paper on Quality by Design
White paper on Quality by DesignWhite paper on Quality by Design
White paper on Quality by DesignBir Gujral PhD, MBA
 
International Verified Carbon Standard for Peatlands
International Verified Carbon Standard for PeatlandsInternational Verified Carbon Standard for Peatlands
International Verified Carbon Standard for PeatlandsAberdeen CES
 
GHG Protocl Supply Chain and Product Standard High Level Overview
GHG Protocl Supply Chain and Product Standard High Level OverviewGHG Protocl Supply Chain and Product Standard High Level Overview
GHG Protocl Supply Chain and Product Standard High Level OverviewRanping Song
 
An introduction to EECO2-Energy Efficiency Consultancy Limited
An introduction to EECO2-Energy Efficiency Consultancy LimitedAn introduction to EECO2-Energy Efficiency Consultancy Limited
An introduction to EECO2-Energy Efficiency Consultancy LimitedEECO2
 
EECO2 GMP critical HVAC energy cost reduction
EECO2 GMP critical HVAC energy cost reductionEECO2 GMP critical HVAC energy cost reduction
EECO2 GMP critical HVAC energy cost reductionKeith Beattie
 
QbD and PAT Presentation
QbD and PAT PresentationQbD and PAT Presentation
QbD and PAT Presentationsunp994
 
5 Steps to Achieve More CostEffective Aminebased Carbon Capture Processes at ...
5 Steps to Achieve More CostEffective Aminebased Carbon Capture Processes at ...5 Steps to Achieve More CostEffective Aminebased Carbon Capture Processes at ...
5 Steps to Achieve More CostEffective Aminebased Carbon Capture Processes at ...NazrulIslam657555
 

Similar to Using Fusion QbD as an Analytical Quality by Design Software for Method Development (20)

Considering Quality by Design (QbD) in Analytical Development for Protein The...
Considering Quality by Design (QbD) in Analytical Development for Protein The...Considering Quality by Design (QbD) in Analytical Development for Protein The...
Considering Quality by Design (QbD) in Analytical Development for Protein The...
 
Compressed Timelines for Breakthrough Therapies: Impact on Process Characteri...
Compressed Timelines for Breakthrough Therapies: Impact on Process Characteri...Compressed Timelines for Breakthrough Therapies: Impact on Process Characteri...
Compressed Timelines for Breakthrough Therapies: Impact on Process Characteri...
 
Europe User Conference: ADNOC predictive model of gas oil hydrotreater unit f...
Europe User Conference: ADNOC predictive model of gas oil hydrotreater unit f...Europe User Conference: ADNOC predictive model of gas oil hydrotreater unit f...
Europe User Conference: ADNOC predictive model of gas oil hydrotreater unit f...
 
Qbd continued
Qbd continuedQbd continued
Qbd continued
 
Lean Manufacturing Cost Cutting Methods
Lean Manufacturing   Cost Cutting MethodsLean Manufacturing   Cost Cutting Methods
Lean Manufacturing Cost Cutting Methods
 
Method validation
Method validationMethod validation
Method validation
 
Episode 27 : Project Management Costs
Episode 27 : Project Management Costs Episode 27 : Project Management Costs
Episode 27 : Project Management Costs
 
Choosing the Right Calibrator Webinar Presented by Druck BHGE and Transcat
Choosing the Right Calibrator Webinar Presented by Druck BHGE and TranscatChoosing the Right Calibrator Webinar Presented by Druck BHGE and Transcat
Choosing the Right Calibrator Webinar Presented by Druck BHGE and Transcat
 
Episode 27 : Project Management Costs
Episode 27 : Project Management Costs Episode 27 : Project Management Costs
Episode 27 : Project Management Costs
 
Statistical solutions to help you with 5 FDA medical devices stages
Statistical solutions to help you with 5 FDA medical devices stagesStatistical solutions to help you with 5 FDA medical devices stages
Statistical solutions to help you with 5 FDA medical devices stages
 
Aqbd HPLC method validation presentation
Aqbd HPLC method validation presentationAqbd HPLC method validation presentation
Aqbd HPLC method validation presentation
 
kshitij_resume_R&D
kshitij_resume_R&Dkshitij_resume_R&D
kshitij_resume_R&D
 
White paper on Quality by Design
White paper on Quality by DesignWhite paper on Quality by Design
White paper on Quality by Design
 
International Verified Carbon Standard for Peatlands
International Verified Carbon Standard for PeatlandsInternational Verified Carbon Standard for Peatlands
International Verified Carbon Standard for Peatlands
 
GHG Protocl Supply Chain and Product Standard High Level Overview
GHG Protocl Supply Chain and Product Standard High Level OverviewGHG Protocl Supply Chain and Product Standard High Level Overview
GHG Protocl Supply Chain and Product Standard High Level Overview
 
An introduction to EECO2-Energy Efficiency Consultancy Limited
An introduction to EECO2-Energy Efficiency Consultancy LimitedAn introduction to EECO2-Energy Efficiency Consultancy Limited
An introduction to EECO2-Energy Efficiency Consultancy Limited
 
EECO2 GMP critical HVAC energy cost reduction
EECO2 GMP critical HVAC energy cost reductionEECO2 GMP critical HVAC energy cost reduction
EECO2 GMP critical HVAC energy cost reduction
 
CO4_2015_LOW_36-39
CO4_2015_LOW_36-39CO4_2015_LOW_36-39
CO4_2015_LOW_36-39
 
QbD and PAT Presentation
QbD and PAT PresentationQbD and PAT Presentation
QbD and PAT Presentation
 
5 Steps to Achieve More CostEffective Aminebased Carbon Capture Processes at ...
5 Steps to Achieve More CostEffective Aminebased Carbon Capture Processes at ...5 Steps to Achieve More CostEffective Aminebased Carbon Capture Processes at ...
5 Steps to Achieve More CostEffective Aminebased Carbon Capture Processes at ...
 

More from Waters Corporation

Webinar - Pharmacopeial Modernization: How Will Your Chromatography Workflow ...
Webinar - Pharmacopeial Modernization: How Will Your Chromatography Workflow ...Webinar - Pharmacopeial Modernization: How Will Your Chromatography Workflow ...
Webinar - Pharmacopeial Modernization: How Will Your Chromatography Workflow ...Waters Corporation
 
Empower 3 Chromatography Data Software Infographic
Empower 3 Chromatography Data Software InfographicEmpower 3 Chromatography Data Software Infographic
Empower 3 Chromatography Data Software InfographicWaters Corporation
 
Empower for the Enterprise Infographic
Empower for the Enterprise InfographicEmpower for the Enterprise Infographic
Empower for the Enterprise InfographicWaters Corporation
 
The History of Waters Detectors
The History of Waters DetectorsThe History of Waters Detectors
The History of Waters DetectorsWaters Corporation
 
The Next Generation in LC-MS Data Analysis
The Next Generation in LC-MS Data AnalysisThe Next Generation in LC-MS Data Analysis
The Next Generation in LC-MS Data AnalysisWaters Corporation
 
Simplifying the Screening Workflow for Extractables
Simplifying the Screening Workflow for ExtractablesSimplifying the Screening Workflow for Extractables
Simplifying the Screening Workflow for ExtractablesWaters Corporation
 
Adopting SFC Technology into the Purification Process
Adopting SFC Technology into the Purification ProcessAdopting SFC Technology into the Purification Process
Adopting SFC Technology into the Purification ProcessWaters Corporation
 
Solutions for Botanical Extraction Infographic
Solutions for Botanical Extraction InfographicSolutions for Botanical Extraction Infographic
Solutions for Botanical Extraction InfographicWaters Corporation
 
Large Molecule Analysis by LC-MS - Survey Infographic
Large Molecule Analysis by LC-MS - Survey Infographic Large Molecule Analysis by LC-MS - Survey Infographic
Large Molecule Analysis by LC-MS - Survey Infographic Waters Corporation
 
Infographic: Xevo TQ-XS Mass Spectrometer
Infographic: Xevo TQ-XS Mass SpectrometerInfographic: Xevo TQ-XS Mass Spectrometer
Infographic: Xevo TQ-XS Mass SpectrometerWaters Corporation
 
Tandem Quad Mass Spectrometry Timeline Infographic
Tandem Quad Mass Spectrometry Timeline Infographic Tandem Quad Mass Spectrometry Timeline Infographic
Tandem Quad Mass Spectrometry Timeline Infographic Waters Corporation
 
Antibody Drug Conjugates - Survey
Antibody Drug Conjugates - SurveyAntibody Drug Conjugates - Survey
Antibody Drug Conjugates - SurveyWaters Corporation
 
Pharmaceutical QA/QC Infographic
Pharmaceutical QA/QC InfographicPharmaceutical QA/QC Infographic
Pharmaceutical QA/QC InfographicWaters Corporation
 
How to choose the right T3 column for seperating polar compounds
How to choose the right T3 column for seperating polar compoundsHow to choose the right T3 column for seperating polar compounds
How to choose the right T3 column for seperating polar compoundsWaters Corporation
 
Oasis PRiME HLB infographic: How to select the best SPE method for food matrices
Oasis PRiME HLB infographic: How to select the best SPE method for food matricesOasis PRiME HLB infographic: How to select the best SPE method for food matrices
Oasis PRiME HLB infographic: How to select the best SPE method for food matricesWaters Corporation
 
Simplifying the Screening Workflow for Forensic Toxicology Infographic
Simplifying the Screening Workflow for Forensic Toxicology InfographicSimplifying the Screening Workflow for Forensic Toxicology Infographic
Simplifying the Screening Workflow for Forensic Toxicology InfographicWaters Corporation
 

More from Waters Corporation (20)

Webinar - Pharmacopeial Modernization: How Will Your Chromatography Workflow ...
Webinar - Pharmacopeial Modernization: How Will Your Chromatography Workflow ...Webinar - Pharmacopeial Modernization: How Will Your Chromatography Workflow ...
Webinar - Pharmacopeial Modernization: How Will Your Chromatography Workflow ...
 
Empower 3 Chromatography Data Software Infographic
Empower 3 Chromatography Data Software InfographicEmpower 3 Chromatography Data Software Infographic
Empower 3 Chromatography Data Software Infographic
 
Data Integrity Compliance
Data Integrity Compliance Data Integrity Compliance
Data Integrity Compliance
 
Empower for the Enterprise Infographic
Empower for the Enterprise InfographicEmpower for the Enterprise Infographic
Empower for the Enterprise Infographic
 
The History of Waters Detectors
The History of Waters DetectorsThe History of Waters Detectors
The History of Waters Detectors
 
The Next Generation in LC-MS Data Analysis
The Next Generation in LC-MS Data AnalysisThe Next Generation in LC-MS Data Analysis
The Next Generation in LC-MS Data Analysis
 
Simplifying the Screening Workflow for Extractables
Simplifying the Screening Workflow for ExtractablesSimplifying the Screening Workflow for Extractables
Simplifying the Screening Workflow for Extractables
 
Adopting SFC Technology into the Purification Process
Adopting SFC Technology into the Purification ProcessAdopting SFC Technology into the Purification Process
Adopting SFC Technology into the Purification Process
 
Solutions for Botanical Extraction Infographic
Solutions for Botanical Extraction InfographicSolutions for Botanical Extraction Infographic
Solutions for Botanical Extraction Infographic
 
Large Molecule Analysis by LC-MS - Survey Infographic
Large Molecule Analysis by LC-MS - Survey Infographic Large Molecule Analysis by LC-MS - Survey Infographic
Large Molecule Analysis by LC-MS - Survey Infographic
 
Infographic: Xevo TQ-XS Mass Spectrometer
Infographic: Xevo TQ-XS Mass SpectrometerInfographic: Xevo TQ-XS Mass Spectrometer
Infographic: Xevo TQ-XS Mass Spectrometer
 
Tandem Quad Mass Spectrometry Timeline Infographic
Tandem Quad Mass Spectrometry Timeline Infographic Tandem Quad Mass Spectrometry Timeline Infographic
Tandem Quad Mass Spectrometry Timeline Infographic
 
Antibody Drug Conjugates - Survey
Antibody Drug Conjugates - SurveyAntibody Drug Conjugates - Survey
Antibody Drug Conjugates - Survey
 
Pharmaceutical QA/QC Infographic
Pharmaceutical QA/QC InfographicPharmaceutical QA/QC Infographic
Pharmaceutical QA/QC Infographic
 
How to choose the right T3 column for seperating polar compounds
How to choose the right T3 column for seperating polar compoundsHow to choose the right T3 column for seperating polar compounds
How to choose the right T3 column for seperating polar compounds
 
Master Method Development
Master Method DevelopmentMaster Method Development
Master Method Development
 
Oasis PRiME HLB infographic: How to select the best SPE method for food matrices
Oasis PRiME HLB infographic: How to select the best SPE method for food matricesOasis PRiME HLB infographic: How to select the best SPE method for food matrices
Oasis PRiME HLB infographic: How to select the best SPE method for food matrices
 
Waters eLearning Infographic
Waters eLearning InfographicWaters eLearning Infographic
Waters eLearning Infographic
 
CORTECS Columns Infographic
CORTECS Columns InfographicCORTECS Columns Infographic
CORTECS Columns Infographic
 
Simplifying the Screening Workflow for Forensic Toxicology Infographic
Simplifying the Screening Workflow for Forensic Toxicology InfographicSimplifying the Screening Workflow for Forensic Toxicology Infographic
Simplifying the Screening Workflow for Forensic Toxicology Infographic
 

Recently uploaded

Nightside clouds and disequilibrium chemistry on the hot Jupiter WASP-43b
Nightside clouds and disequilibrium chemistry on the hot Jupiter WASP-43bNightside clouds and disequilibrium chemistry on the hot Jupiter WASP-43b
Nightside clouds and disequilibrium chemistry on the hot Jupiter WASP-43bSérgio Sacani
 
Recombinant DNA technology (Immunological screening)
Recombinant DNA technology (Immunological screening)Recombinant DNA technology (Immunological screening)
Recombinant DNA technology (Immunological screening)PraveenaKalaiselvan1
 
PossibleEoarcheanRecordsoftheGeomagneticFieldPreservedintheIsuaSupracrustalBe...
PossibleEoarcheanRecordsoftheGeomagneticFieldPreservedintheIsuaSupracrustalBe...PossibleEoarcheanRecordsoftheGeomagneticFieldPreservedintheIsuaSupracrustalBe...
PossibleEoarcheanRecordsoftheGeomagneticFieldPreservedintheIsuaSupracrustalBe...Sérgio Sacani
 
Traditional Agroforestry System in India- Shifting Cultivation, Taungya, Home...
Traditional Agroforestry System in India- Shifting Cultivation, Taungya, Home...Traditional Agroforestry System in India- Shifting Cultivation, Taungya, Home...
Traditional Agroforestry System in India- Shifting Cultivation, Taungya, Home...jana861314
 
Nanoparticles synthesis and characterization​ ​
Nanoparticles synthesis and characterization​  ​Nanoparticles synthesis and characterization​  ​
Nanoparticles synthesis and characterization​ ​kaibalyasahoo82800
 
GFP in rDNA Technology (Biotechnology).pptx
GFP in rDNA Technology (Biotechnology).pptxGFP in rDNA Technology (Biotechnology).pptx
GFP in rDNA Technology (Biotechnology).pptxAleenaTreesaSaji
 
Grafana in space: Monitoring Japan's SLIM moon lander in real time
Grafana in space: Monitoring Japan's SLIM moon lander  in real timeGrafana in space: Monitoring Japan's SLIM moon lander  in real time
Grafana in space: Monitoring Japan's SLIM moon lander in real timeSatoshi NAKAHIRA
 
G9 Science Q4- Week 1-2 Projectile Motion.ppt
G9 Science Q4- Week 1-2 Projectile Motion.pptG9 Science Q4- Week 1-2 Projectile Motion.ppt
G9 Science Q4- Week 1-2 Projectile Motion.pptMAESTRELLAMesa2
 
Green chemistry and Sustainable development.pptx
Green chemistry  and Sustainable development.pptxGreen chemistry  and Sustainable development.pptx
Green chemistry and Sustainable development.pptxRajatChauhan518211
 
Zoology 4th semester series (krishna).pdf
Zoology 4th semester series (krishna).pdfZoology 4th semester series (krishna).pdf
Zoology 4th semester series (krishna).pdfSumit Kumar yadav
 
Labelling Requirements and Label Claims for Dietary Supplements and Recommend...
Labelling Requirements and Label Claims for Dietary Supplements and Recommend...Labelling Requirements and Label Claims for Dietary Supplements and Recommend...
Labelling Requirements and Label Claims for Dietary Supplements and Recommend...Lokesh Kothari
 
All-domain Anomaly Resolution Office U.S. Department of Defense (U) Case: “Eg...
All-domain Anomaly Resolution Office U.S. Department of Defense (U) Case: “Eg...All-domain Anomaly Resolution Office U.S. Department of Defense (U) Case: “Eg...
All-domain Anomaly Resolution Office U.S. Department of Defense (U) Case: “Eg...Sérgio Sacani
 
Bentham & Hooker's Classification. along with the merits and demerits of the ...
Bentham & Hooker's Classification. along with the merits and demerits of the ...Bentham & Hooker's Classification. along with the merits and demerits of the ...
Bentham & Hooker's Classification. along with the merits and demerits of the ...Nistarini College, Purulia (W.B) India
 
Presentation Vikram Lander by Vedansh Gupta.pptx
Presentation Vikram Lander by Vedansh Gupta.pptxPresentation Vikram Lander by Vedansh Gupta.pptx
Presentation Vikram Lander by Vedansh Gupta.pptxgindu3009
 
STERILITY TESTING OF PHARMACEUTICALS ppt by DR.C.P.PRINCE
STERILITY TESTING OF PHARMACEUTICALS ppt by DR.C.P.PRINCESTERILITY TESTING OF PHARMACEUTICALS ppt by DR.C.P.PRINCE
STERILITY TESTING OF PHARMACEUTICALS ppt by DR.C.P.PRINCEPRINCE C P
 
Hubble Asteroid Hunter III. Physical properties of newly found asteroids
Hubble Asteroid Hunter III. Physical properties of newly found asteroidsHubble Asteroid Hunter III. Physical properties of newly found asteroids
Hubble Asteroid Hunter III. Physical properties of newly found asteroidsSérgio Sacani
 
CALL ON ➥8923113531 🔝Call Girls Kesar Bagh Lucknow best Night Fun service 🪡
CALL ON ➥8923113531 🔝Call Girls Kesar Bagh Lucknow best Night Fun service  🪡CALL ON ➥8923113531 🔝Call Girls Kesar Bagh Lucknow best Night Fun service  🪡
CALL ON ➥8923113531 🔝Call Girls Kesar Bagh Lucknow best Night Fun service 🪡anilsa9823
 
Recombination DNA Technology (Nucleic Acid Hybridization )
Recombination DNA Technology (Nucleic Acid Hybridization )Recombination DNA Technology (Nucleic Acid Hybridization )
Recombination DNA Technology (Nucleic Acid Hybridization )aarthirajkumar25
 

Recently uploaded (20)

Nightside clouds and disequilibrium chemistry on the hot Jupiter WASP-43b
Nightside clouds and disequilibrium chemistry on the hot Jupiter WASP-43bNightside clouds and disequilibrium chemistry on the hot Jupiter WASP-43b
Nightside clouds and disequilibrium chemistry on the hot Jupiter WASP-43b
 
Recombinant DNA technology (Immunological screening)
Recombinant DNA technology (Immunological screening)Recombinant DNA technology (Immunological screening)
Recombinant DNA technology (Immunological screening)
 
PossibleEoarcheanRecordsoftheGeomagneticFieldPreservedintheIsuaSupracrustalBe...
PossibleEoarcheanRecordsoftheGeomagneticFieldPreservedintheIsuaSupracrustalBe...PossibleEoarcheanRecordsoftheGeomagneticFieldPreservedintheIsuaSupracrustalBe...
PossibleEoarcheanRecordsoftheGeomagneticFieldPreservedintheIsuaSupracrustalBe...
 
Traditional Agroforestry System in India- Shifting Cultivation, Taungya, Home...
Traditional Agroforestry System in India- Shifting Cultivation, Taungya, Home...Traditional Agroforestry System in India- Shifting Cultivation, Taungya, Home...
Traditional Agroforestry System in India- Shifting Cultivation, Taungya, Home...
 
CELL -Structural and Functional unit of life.pdf
CELL -Structural and Functional unit of life.pdfCELL -Structural and Functional unit of life.pdf
CELL -Structural and Functional unit of life.pdf
 
Nanoparticles synthesis and characterization​ ​
Nanoparticles synthesis and characterization​  ​Nanoparticles synthesis and characterization​  ​
Nanoparticles synthesis and characterization​ ​
 
GFP in rDNA Technology (Biotechnology).pptx
GFP in rDNA Technology (Biotechnology).pptxGFP in rDNA Technology (Biotechnology).pptx
GFP in rDNA Technology (Biotechnology).pptx
 
Grafana in space: Monitoring Japan's SLIM moon lander in real time
Grafana in space: Monitoring Japan's SLIM moon lander  in real timeGrafana in space: Monitoring Japan's SLIM moon lander  in real time
Grafana in space: Monitoring Japan's SLIM moon lander in real time
 
G9 Science Q4- Week 1-2 Projectile Motion.ppt
G9 Science Q4- Week 1-2 Projectile Motion.pptG9 Science Q4- Week 1-2 Projectile Motion.ppt
G9 Science Q4- Week 1-2 Projectile Motion.ppt
 
Green chemistry and Sustainable development.pptx
Green chemistry  and Sustainable development.pptxGreen chemistry  and Sustainable development.pptx
Green chemistry and Sustainable development.pptx
 
Zoology 4th semester series (krishna).pdf
Zoology 4th semester series (krishna).pdfZoology 4th semester series (krishna).pdf
Zoology 4th semester series (krishna).pdf
 
Labelling Requirements and Label Claims for Dietary Supplements and Recommend...
Labelling Requirements and Label Claims for Dietary Supplements and Recommend...Labelling Requirements and Label Claims for Dietary Supplements and Recommend...
Labelling Requirements and Label Claims for Dietary Supplements and Recommend...
 
All-domain Anomaly Resolution Office U.S. Department of Defense (U) Case: “Eg...
All-domain Anomaly Resolution Office U.S. Department of Defense (U) Case: “Eg...All-domain Anomaly Resolution Office U.S. Department of Defense (U) Case: “Eg...
All-domain Anomaly Resolution Office U.S. Department of Defense (U) Case: “Eg...
 
Bentham & Hooker's Classification. along with the merits and demerits of the ...
Bentham & Hooker's Classification. along with the merits and demerits of the ...Bentham & Hooker's Classification. along with the merits and demerits of the ...
Bentham & Hooker's Classification. along with the merits and demerits of the ...
 
Engler and Prantl system of classification in plant taxonomy
Engler and Prantl system of classification in plant taxonomyEngler and Prantl system of classification in plant taxonomy
Engler and Prantl system of classification in plant taxonomy
 
Presentation Vikram Lander by Vedansh Gupta.pptx
Presentation Vikram Lander by Vedansh Gupta.pptxPresentation Vikram Lander by Vedansh Gupta.pptx
Presentation Vikram Lander by Vedansh Gupta.pptx
 
STERILITY TESTING OF PHARMACEUTICALS ppt by DR.C.P.PRINCE
STERILITY TESTING OF PHARMACEUTICALS ppt by DR.C.P.PRINCESTERILITY TESTING OF PHARMACEUTICALS ppt by DR.C.P.PRINCE
STERILITY TESTING OF PHARMACEUTICALS ppt by DR.C.P.PRINCE
 
Hubble Asteroid Hunter III. Physical properties of newly found asteroids
Hubble Asteroid Hunter III. Physical properties of newly found asteroidsHubble Asteroid Hunter III. Physical properties of newly found asteroids
Hubble Asteroid Hunter III. Physical properties of newly found asteroids
 
CALL ON ➥8923113531 🔝Call Girls Kesar Bagh Lucknow best Night Fun service 🪡
CALL ON ➥8923113531 🔝Call Girls Kesar Bagh Lucknow best Night Fun service  🪡CALL ON ➥8923113531 🔝Call Girls Kesar Bagh Lucknow best Night Fun service  🪡
CALL ON ➥8923113531 🔝Call Girls Kesar Bagh Lucknow best Night Fun service 🪡
 
Recombination DNA Technology (Nucleic Acid Hybridization )
Recombination DNA Technology (Nucleic Acid Hybridization )Recombination DNA Technology (Nucleic Acid Hybridization )
Recombination DNA Technology (Nucleic Acid Hybridization )
 

Using Fusion QbD as an Analytical Quality by Design Software for Method Development

  • 1. ©2019 Waters Corporation 1COMPANY CONFIDENTIAL©2019 Waters Corporation COMPANY CONFIDENTIAL Using Fusion QbD® as an Analytical Quality by Design Software for Method Development Pittcon 20-March-2019 Oral Session: 01:30-2:30 Fadi Alkhateeb, Senior Scientist Waters Corporation, Milford MA
  • 2. ©2019 Waters Corporation 2COMPANY CONFIDENTIAL • QbD is a systematic approach to development … –That includes defining a design space, control strategy and continual improvement to increase method robustness and understanding • … that begins with predefined objectives… –Defining criteria (performance goals) to be used to measure the quality of the method • …sound science and quality risk management… –Statistical treatment of data to provide quantitative values to goals and limits of performance goals • QbD approach is implemented with an experimental design *ICH: International Conference on Harmonization Quality by Design (QbD) A systematic approach to development that begins with predefined objectives and emphasizes product and process understanding and process control, based on sound science and quality risk management. ICH* Q8(R2) Guidelines Some Definitions
  • 3. ©2019 Waters Corporation 3COMPANY CONFIDENTIAL Design of Experiment (DoE) Formal Experimental Design: A structured, organized method for determining the relationship between factors affecting a process and the output of that process. Also known as “Design of Experiments”. ICH Q8(R2) Guidelines • A structured and organized method of gathering empirical knowledge • DoE are represented as a multi-dimensional space (matrix) • Screening parameters (study variables) are the dimensions of this space • Number of experiments is optimized using an appropriate study design (full factorial design & partial factorial design) X (Temperature) Y (Gradient Time) Z (pH) Best Method Some Definitions
  • 4. ©2019 Waters Corporation 4COMPANY CONFIDENTIAL Chromatographic Parameters Numerical (e.g. Temperature, Flow Rate, pH, Injection Volume, etc. Categorical ( e.g. Stationary Phase, Mobile Phase, Additive Type, etc. Fusion QbD – LC Method Development Module Numerical factors are factors with levels which are represented by numbers on a continuous scale. Categorical factor levels represent disjoint (discontinuous) systems
  • 5. ©2019 Waters Corporation 5COMPANY CONFIDENTIAL DOE = Statistical Sampling (Efficient Multifactor Studies) Consider two variables – five study levels each: 25 Methods Gradient Time (min) Oven Temp. (°C) Full Factorial Approach = All Possible Combinations 25 30 35 40 45 12 10 8 6 4 13 Methods Oven Temp. (°C) Gradient Time (min) Design of Experiments = Statistical Sampling 25 30 35 40 12 10 8 6 4
  • 6. ©2019 Waters Corporation 6COMPANY CONFIDENTIAL DOE – Adding a 3rd and 4th Factor to the Study 3rd Variable – pH Oven Temp ∆tG pH Oven Temp ∆tG pH C18 Phenyl C8 Oven Temp ∆tG pH Oven Temp ∆tG pH 4th Variable – Column Type
  • 7. ©2019 Waters Corporation 7COMPANY CONFIDENTIAL Fusion QbD – Supports ALL your Waters LC Systems
  • 8. ©2019 Waters Corporation 8COMPANY CONFIDENTIAL • Select preliminary study variables such as injection volume, λ Max, initial hold time • Select “major” factors & study ranges Columns, Organic solvents, pH • Identify method conditions for acceptable separation • Data are imported to Fusion • Analyze and process the imported results to create a design space • Fine tune “minor” factors, Column temperatures Gradient slopes Gradient times Flow rates • Identify method for optimum performance & robustness Optimization Importing Data to Fusion and Developing Knowledge Space Initial Sample Workup Selecting Chromatographic Parameters/Screening Fusion QbD Method Development: Steps
  • 9. ©2019 Waters Corporation 9COMPANY CONFIDENTIAL Method Development for Symbicort® Using Fusion Software Budesonide, Mwt= 430.53 g/mol (A pair of epimers) Formoterol, Mwt= 344.41 g/mol Budesonide Related Compound L, Mwt= 428.22 g/mol Budesonide Related Compound E, Mwt= 428.22 g/mol Budesonide Related Compound G, Mwt= 432.25 g/mol ( A pair of epimers)
  • 10. ©2019 Waters Corporation 10COMPANY CONFIDENTIAL QbD Method Development: Steps Initial Sample Workup Select preliminary chromatographic parameters Variables • Injection volume • Wavelength • Two Columns max Constants • Initial hold time • Gradient Time • Temperature
  • 11. ©2019 Waters Corporation 11COMPANY CONFIDENTIAL QbD Method Development: Steps Initial Sample Workup • Select preliminary study variables such as injection volume, λ Max, initial hold time Method Development of Budesonide/Formoterole and their Related Compounds, ongoing project
  • 12. ©2019 Waters Corporation 12COMPANY CONFIDENTIAL QbD Method Development: Steps Only one gradient slope can be screened in a screening experiment. In our experiment the one slope was 10-95% organic. Gradient time was made variable as a numerical factor. 𝐺𝑟𝑎𝑑𝑖𝑒𝑛𝑡 𝑆𝑙𝑜𝑝𝑒 = 𝑉° × ∆∅ × 1 𝐹 × 𝑡𝑔 Selecting Chromatographic Parameters/Screening • Creating a Design
  • 13. ©2019 Waters Corporation 13COMPANY CONFIDENTIAL QbD Method Development: Steps Selecting Chromatographic Parameters/Screening • Creating a Design
  • 14. ©2019 Waters Corporation 14COMPANY CONFIDENTIAL QbD Method Development: Steps Selecting Chromatographic Parameters/Screening • Exporting methods to Empower
  • 15. ©2019 Waters Corporation 15COMPANY CONFIDENTIAL Fusion Creates all methods and method sets for Empower (time saving!) The created Sample Set can be modified/customized It also creates all methods and method sets for equilibration/conditioning. QbD Method Development: Steps Selecting Chromatographic Parameters/Screening • Exporting methods to Empower
  • 16. ©2019 Waters Corporation 16COMPANY CONFIDENTIAL 1. Formoterol 2. Budesonide Related E 3. Budesonide Related L 4. Budesonide Epimer B 5. Budesonide Epimer A 6. Budesonide Related G (Epimer 1) 7. Budesonide Related G (Epimer 2) 1 23 4 5 6 7 Method Development of Budesonide/Formoterole and their Related Compounds, ongoing project QbD Method Development: Steps
  • 17. ©2019 Waters Corporation 17COMPANY CONFIDENTIAL Importing Data to Fusion and Developing Knowledge Space QbD Method Development: Steps
  • 18. ©2019 Waters Corporation 18COMPANY CONFIDENTIAL Importing Data to Fusion and Developing Knowledge Space QbD Method Development: Steps • Execute Search
  • 19. ©2019 Waters Corporation 19COMPANY CONFIDENTIAL Importing Data to Fusion and Developing Knowledge Space QbD Method Development: Steps • Best Overall Answer Shaded regions indicates pH and Gradient Time combinations that do not meet performance goals. APR
  • 20. ©2019 Waters Corporation 20COMPANY CONFIDENTIAL Second Screening Empirical Titration Curves Developed using an H-Class High pH ACQUITY H-Class PLUS
  • 21. ©2019 Waters Corporation 21COMPANY CONFIDENTIAL 1. Formoterol 2. Budesonide Related E 3. Budesonide Related L 4. Budesonide Epimer B 5. Budesonide Epimer A 6. Budesonide Related G (Epimer 1) 7. Budesonide Related G (Epimer 2) 1 23 4 5 6 7 Method Development of Budesonide/Formoterole and their Related Compounds, ongoing project QbD Method Development: Steps
  • 22. ©2019 Waters Corporation 22COMPANY CONFIDENTIAL Second Screening Creating design space and finding the “Acceptable Performance Region” QbD Method Development: Steps Acceptable Performance Region (APR)
  • 23. ©2019 Waters Corporation 23COMPANY CONFIDENTIAL • Fine tune “minor” factors, Column temperatures Gradient slopes Gradient times Flow rates • Identify method for optimum performance & robustness Optimization QbD Method Development: Steps
  • 24. ©2019 Waters Corporation 24COMPANY CONFIDENTIAL Optimization QbD Method Development: Steps 1 2 3 5 6 741. Formoterol 2. Budesonide Related E 3. Budesonide Related L 4. Budesonide Epimer B 5. Budesonide Epimer A 6. Budesonide Related G (Epimer 1) 7. Budesonide Related G (Epimer 2)
  • 25. ©2019 Waters Corporation 25COMPANY CONFIDENTIAL Optimization QbD Method Development: Steps
  • 26. ©2019 Waters Corporation 26COMPANY CONFIDENTIAL Tracking Peaks by UV spectra is very difficult  Chemically related compounds, such as process impurities, and degradation products often have similar UV Spectra  Coeluting peaks have spectra that are a blend of the individual peaks – Difficult to interpret – Cannot determine which components are coeluting by UV Spectra alone – For related species, UV tracking requires separate injections using pure standards, which decreases efficiency of laboratory's workflow Empower MS Tracking  Empower MS Peak tracking uses the mass-to-charge (m/z) ratio to automatically track each peak in a sample injection  Using mass spectra data for peak tracking enables analytical laboratory to correctly monitor peak retention during method development experiments Peak Tracking MS Peak Tracking for Method Development
  • 27. ©2019 Waters Corporation 27COMPANY CONFIDENTIAL MS Peak Tracking for Method Development: Empower 3 MS Peak Tracking  Specify Spectra for assigned mass  The Assigned Mass Precision past the decimal point - Default values of 0 or 1 are suitable for a quadrupole mass detector
  • 28. ©2019 Waters Corporation 28COMPANY CONFIDENTIAL Spectra for Assigned Mass Spectra for Assigned Mass Description None Peak tracking processing is disabled. As a result, the Assigned Mass Precision field is disabled. Apex Peak tracking is enabled and the Base Peak value obtained from the peak’s apex spectra is copied into the peak’s Assigned Mass Value field. Enter a value in the Assigned Mass Precision field to specify how many digits to display after the decimal when formatting the Assigned Mass Value field as a string in the Assigned Mass field. Combined Peak tracking is enabled and the Base Peak (Combined) value obtained from the peak’s combined spectra is copied into the peak’s Assigned Mass Value field. The combined spectrum is the average mass spectrum across the peak centered on the apex. Enter a value in the Assigned Mass Precision field to specify how many digits to display after the decimal when formatting the Assigned Mass Value field as a string in the Assigned Mass field. MS Peak Tracking for Method Development: Empower 3 MS Peak Tracking % Peak height Combined spectra Peak height
  • 29. ©2019 Waters Corporation 29COMPANY CONFIDENTIAL  Peak table displays assigned mass (m/z) to each peak  Fields in software – Assigned Mass – Assigned Mass Value (m/z) – Notes CSH C18 Process chromatographic data Review Data Window MS Peak Tracking for Method Development: Empower 3 MS Peak Tracking
  • 30. ©2019 Waters Corporation 30COMPANY CONFIDENTIAL Peaks with the Same Assigned Mass Review Data Window 2 peaks with the same masses AU 0.00 0.20 0.40 Minutes 1.00 1.50 2.00 2.50 3.00 3.50 1-286.1 2-300.1 3-342.1 4-316.0 5-182.0 6-202.0 7-202.0 8-224.1 9-258.0 Peak #7 - 2.483 - QDa 1: MS Scan Leading Apex Trailing 202.0 196.0 202.0 196.0 202.0 2 coeluting peaks Imp. C: 202.0 m/z Imp. H: 196.0 m/z Method development: CSH Phenyl Hexyl MS Peak Tracking for Method Development: Empower 3 MS Peak Tracking
  • 31. ©2019 Waters Corporation 31COMPANY CONFIDENTIAL Manually Modify Assign Mass Review Data Manually modify Assigned Mass for peak 7 Right click on the table to modify the mass  Enter the correct mass, and a note explaining why the change was made  After you have made your changes, don’t forget to save the new result MS Peak Tracking for Method Development: Empower 3 MS Peak Tracking
  • 32. ©2019 Waters Corporation 32COMPANY CONFIDENTIAL Manually Modified Mass Review Data Manually assigned mass for peak 7 AU 0.00 0.20 0.40 Minutes 1.00 1.50 2.00 2.50 3.00 3.50 1-286.1 2-300.1 3-342.1 4-316.0 5-182.0 6-202.0 7-196.0 8-224.1 9-258.0 MS Peak Tracking for Method Development: Empower 3 MS Peak Tracking
  • 33. ©2019 Waters Corporation 33COMPANY CONFIDENTIAL Facilitate Method Development: Column Screening AU 0.00 0.15 0.30 AU 0.00 0.20 0.40 AU 0.00 0.15 0.30 AU 0.00 0.12 0.24 Minutes 0.00 0.50 1.00 1.50 2.00 2.50 3.00 3.50 4.00 4.50 5.00 CSH C18 CORTECS C18+ CSH Phenyl Hexyl HSS PFP MS Peak Tracking for Method Development: Empower 3 MS Peak Tracking
  • 34. ©2019 Waters Corporation 34COMPANY CONFIDENTIAL PeakTracker – Auto-imports all Required PDA & QDa Data Used for samples with peaks which Do Not Ionize Used for samples with peaks which have No UV Absorbance Copyright © 2019 S-Matrix Corporation. All Rights Reserved. MS Peak Tracking for Method Development: Fusion AQbD MS Peak Tracking
  • 35. ©2019 Waters Corporation 35COMPANY CONFIDENTIAL PeakTracker – Utilization of Acquity PDA and QDa Data Peak Tracking Fingerprint Data UV Chromatogram Total Ion Chromatogram (TIC) PeakTracker can automatically address these complex separation and tracking challenges: • Auto-deconvolution of partially and completely co-eluted peaks, • Two or more peaks with identical mass data. • Non-ionizable and non-absorbing compounds. Global Tracking Method (GTM) PeakTracker automatically builds a customizable GTM by scanning all UV and TIC chromatograms to identify all integrated peaks. MS Peak Tracking for Method Development: Fusion AQbD MS Peak Tracking
  • 36. ©2019 Waters Corporation 36COMPANY CONFIDENTIAL Peak Has No UV Absorbance Peak is Present In the TIC Just add Peak Names for non- absorbing peaks to the automatically imported MS data for the peaks displayed in the Global Tracking Method. PeakTracker will automatically track the peaks and add them to the UV chromatograms for visualization and modeling. Mass and UV Spectral Analysis Window in Fusion QbD PeakTracker – Peaks with No UV Absorbance Copyright © 2019 S-Matrix Corporation. All Rights Reserved. MS Peak Tracking for Method Development: Fusion AQbD MS Peak Tracking
  • 37. ©2019 Waters Corporation 37COMPANY CONFIDENTIAL Peak Has UV Absorbance Peak Does Not Ionize PeakTracker – Peaks which Do Not Ionize UV Spectra Analysis Window in Fusion QbD Copyright © 2019 S-Matrix Corporation. All Rights Reserved. MS Peak Tracking for Method Development: Fusion AQbD MS Peak Tracking
  • 38. ©2019 Waters Corporation 38COMPANY CONFIDENTIAL PeakTracker – Auto & Manual Update of Results Data Response Data View Filter Easy edit mode. • Blue background for data auto-updated by PeakTracker. • Yellow background for missing data which can be edited by user. Blue Background Yellow Background Copyright © 2019 S-Matrix Corporation. All Rights Reserved. MS Peak Tracking for Method Development: Fusion AQbD MS Peak Tracking
  • 39. ©2019 Waters Corporation 39COMPANY CONFIDENTIAL PeakTracker – Auto-updates Results Data for Analysis PeakTracker automatically associates compound names with all of the UV results data computed by the CDS for all identified peaks in each experiment chromatogram. It also automatically deconvolutes co-eluted peaks, and updates missing UV results data for the co-eluted peaks. Copyright © 2019 S-Matrix Corporation. All Rights Reserved. MS Peak Tracking for Method Development: Fusion AQbD MS Peak Tracking
  • 40. ©2019 Waters Corporation 40COMPANY CONFIDENTIAL • Using Fusion QbD as a tool for developing LC methods can be advantageous as it: –Automates the entire process of method development –Saves time by determining the minimum number of experiments needed for valid results –Provides tools to visualize the impact of chromatographic parameters • Utilizing the QDa detector and Empower speed up the method development process through efficient peak tracking. • The new Fusion Peak Tracker feature automatically tracks peaks across all experiment chromatograms. • Fills in missing data for co-eluting peaks, and generates correct results data sets for non-absorbing peaks for robust method optimization. Conclusions