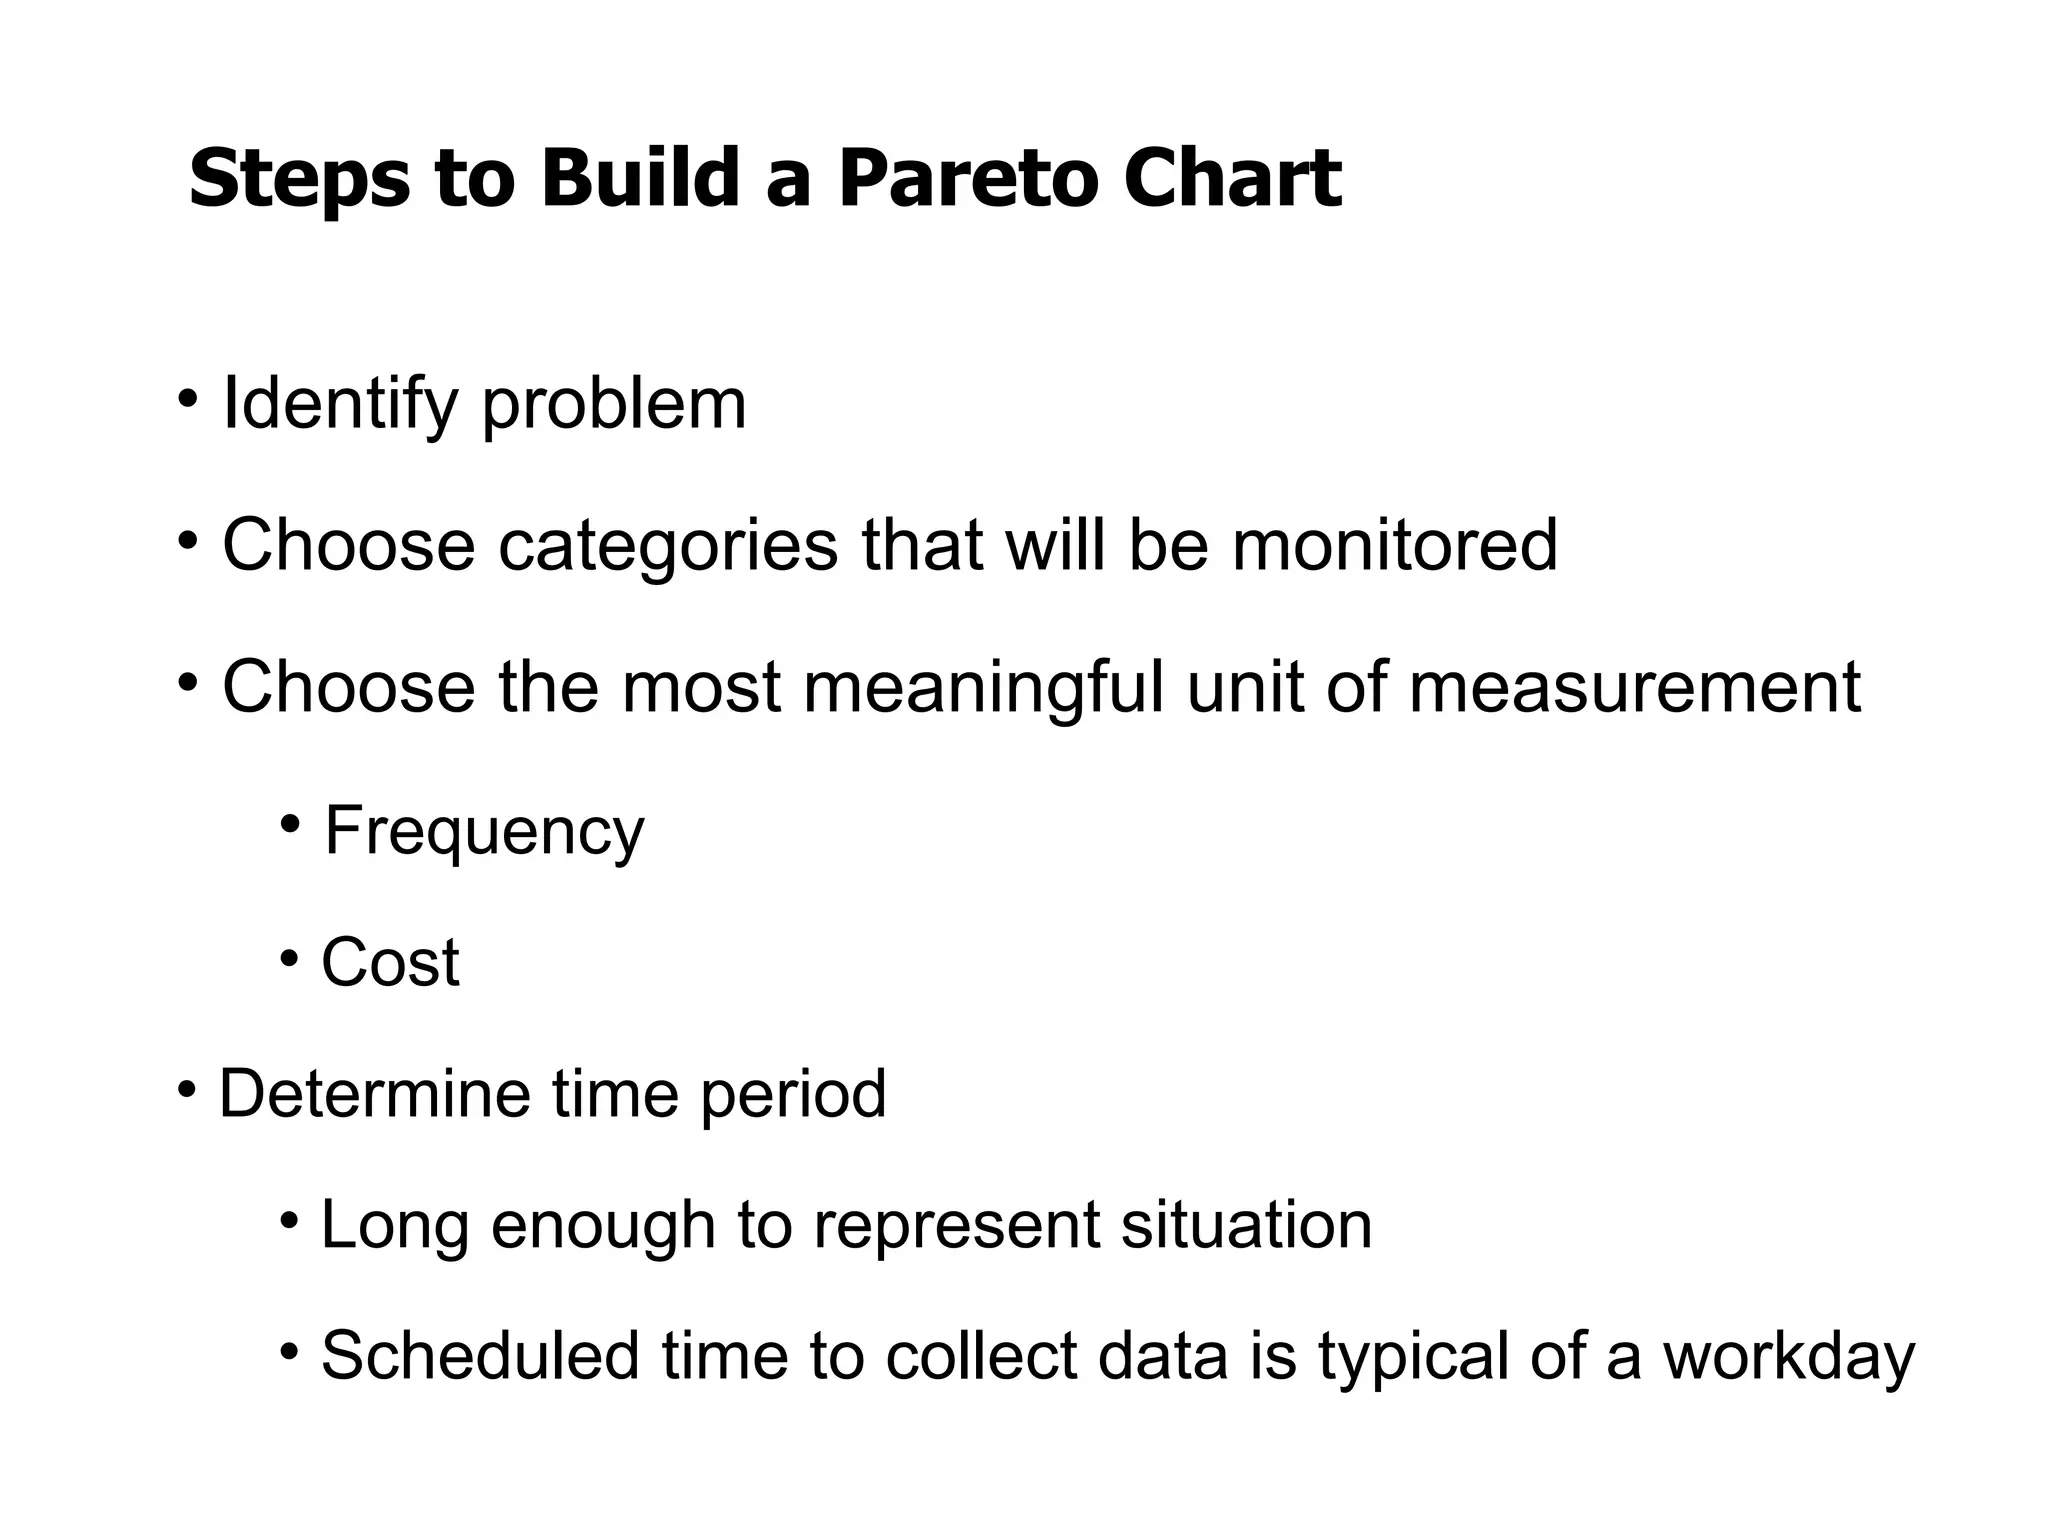
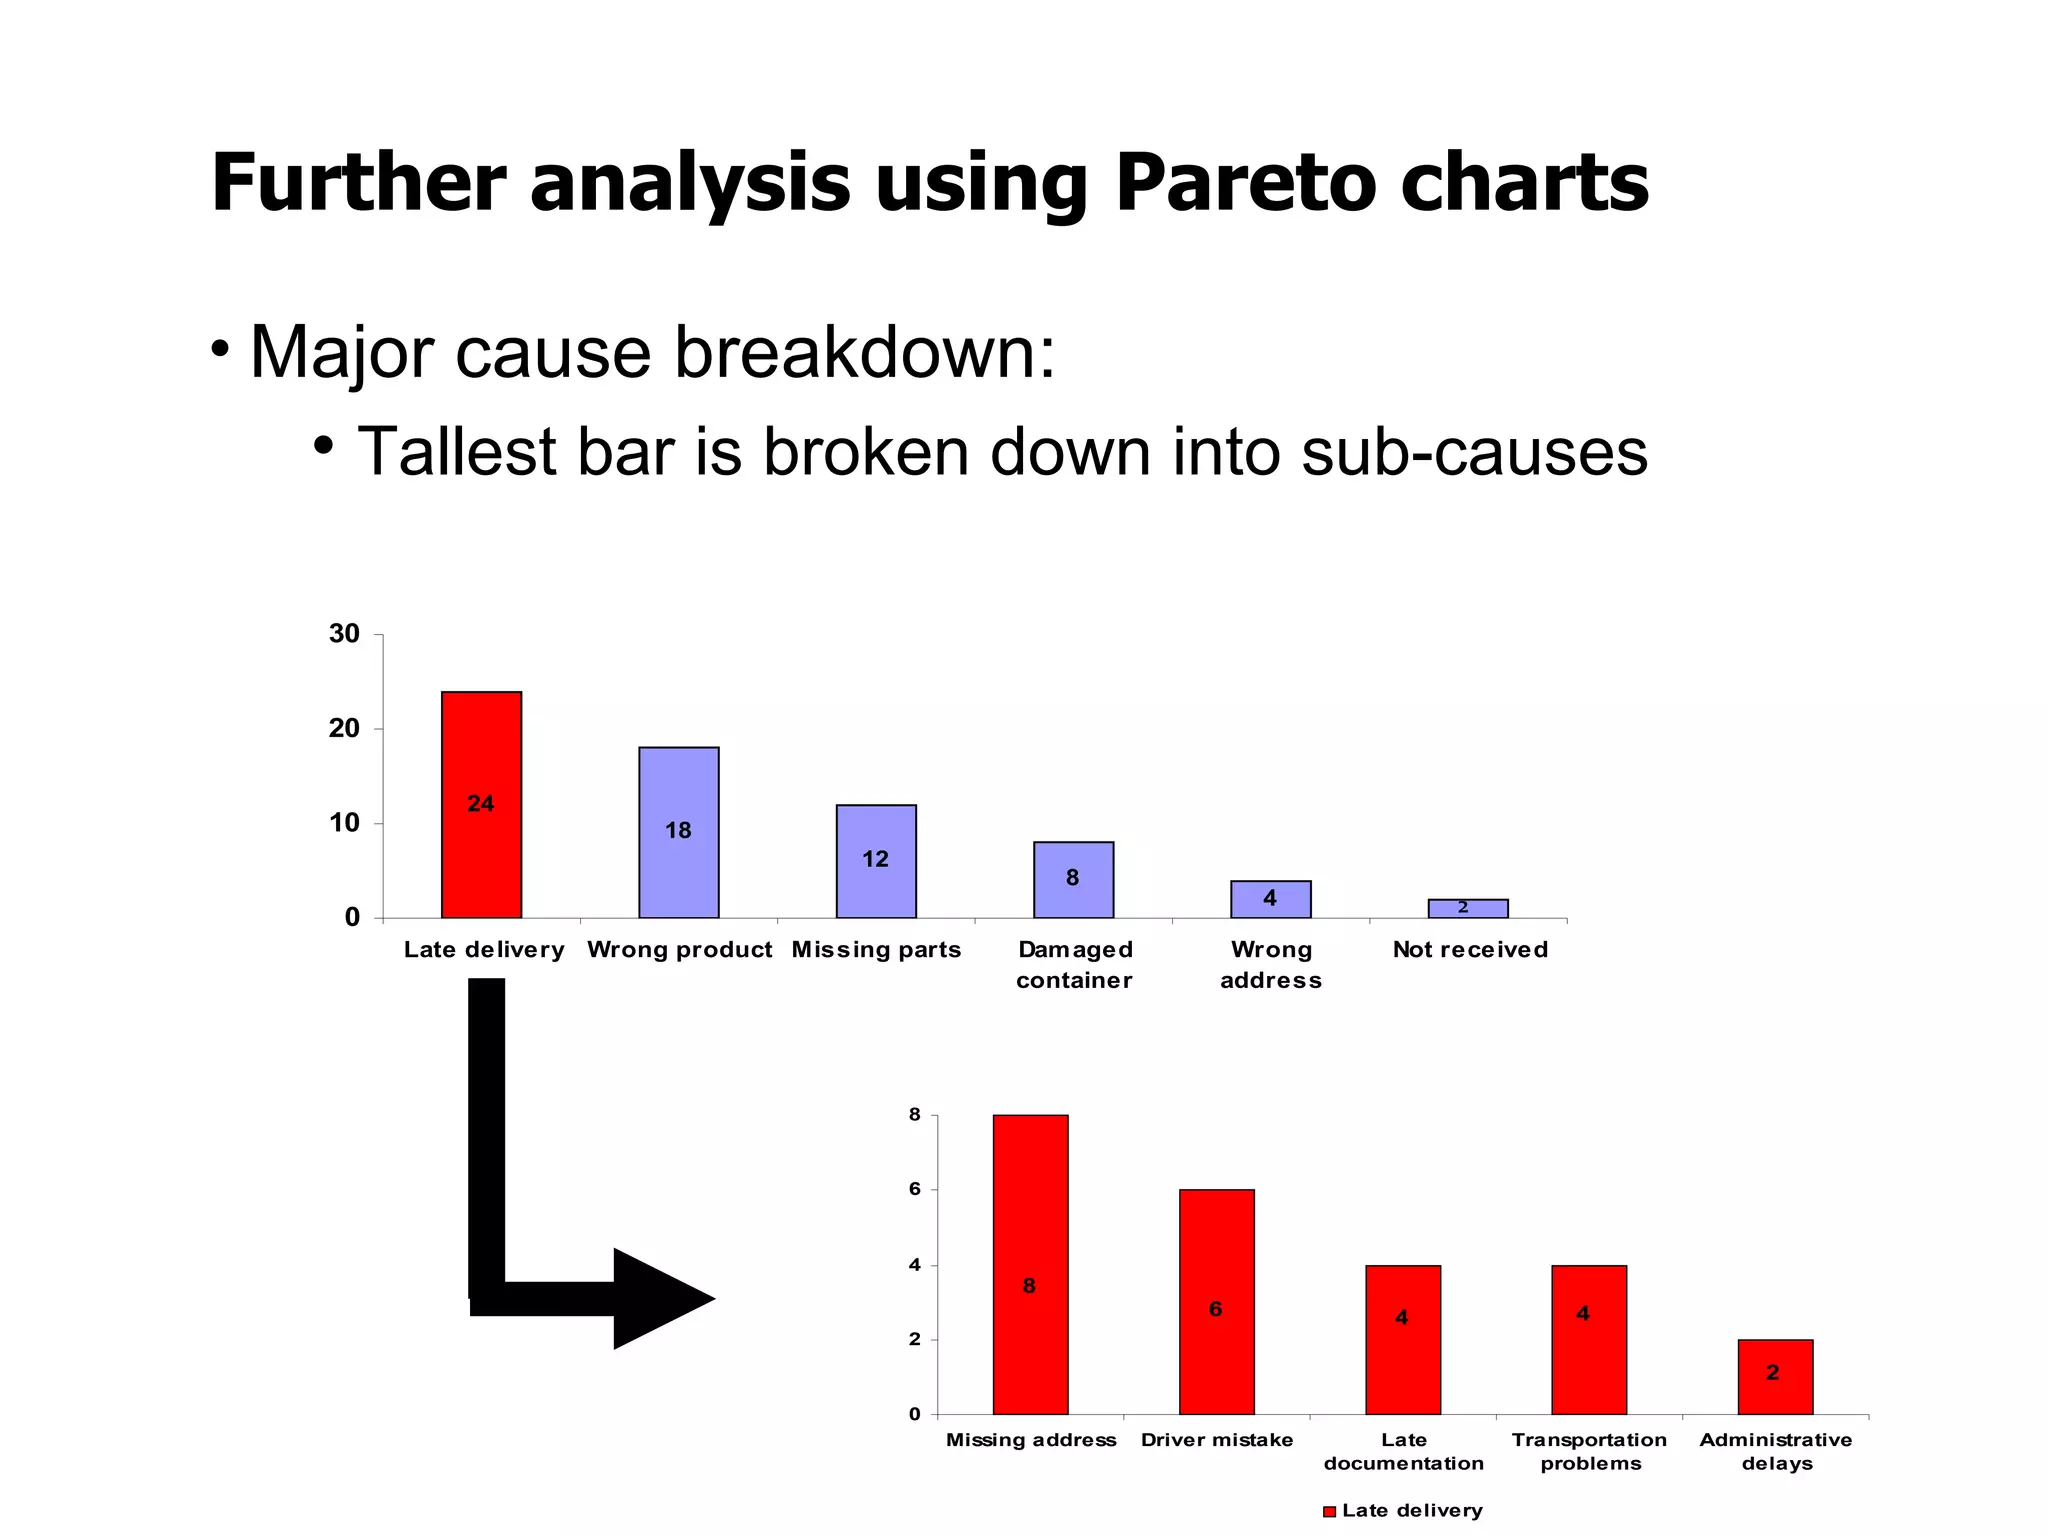
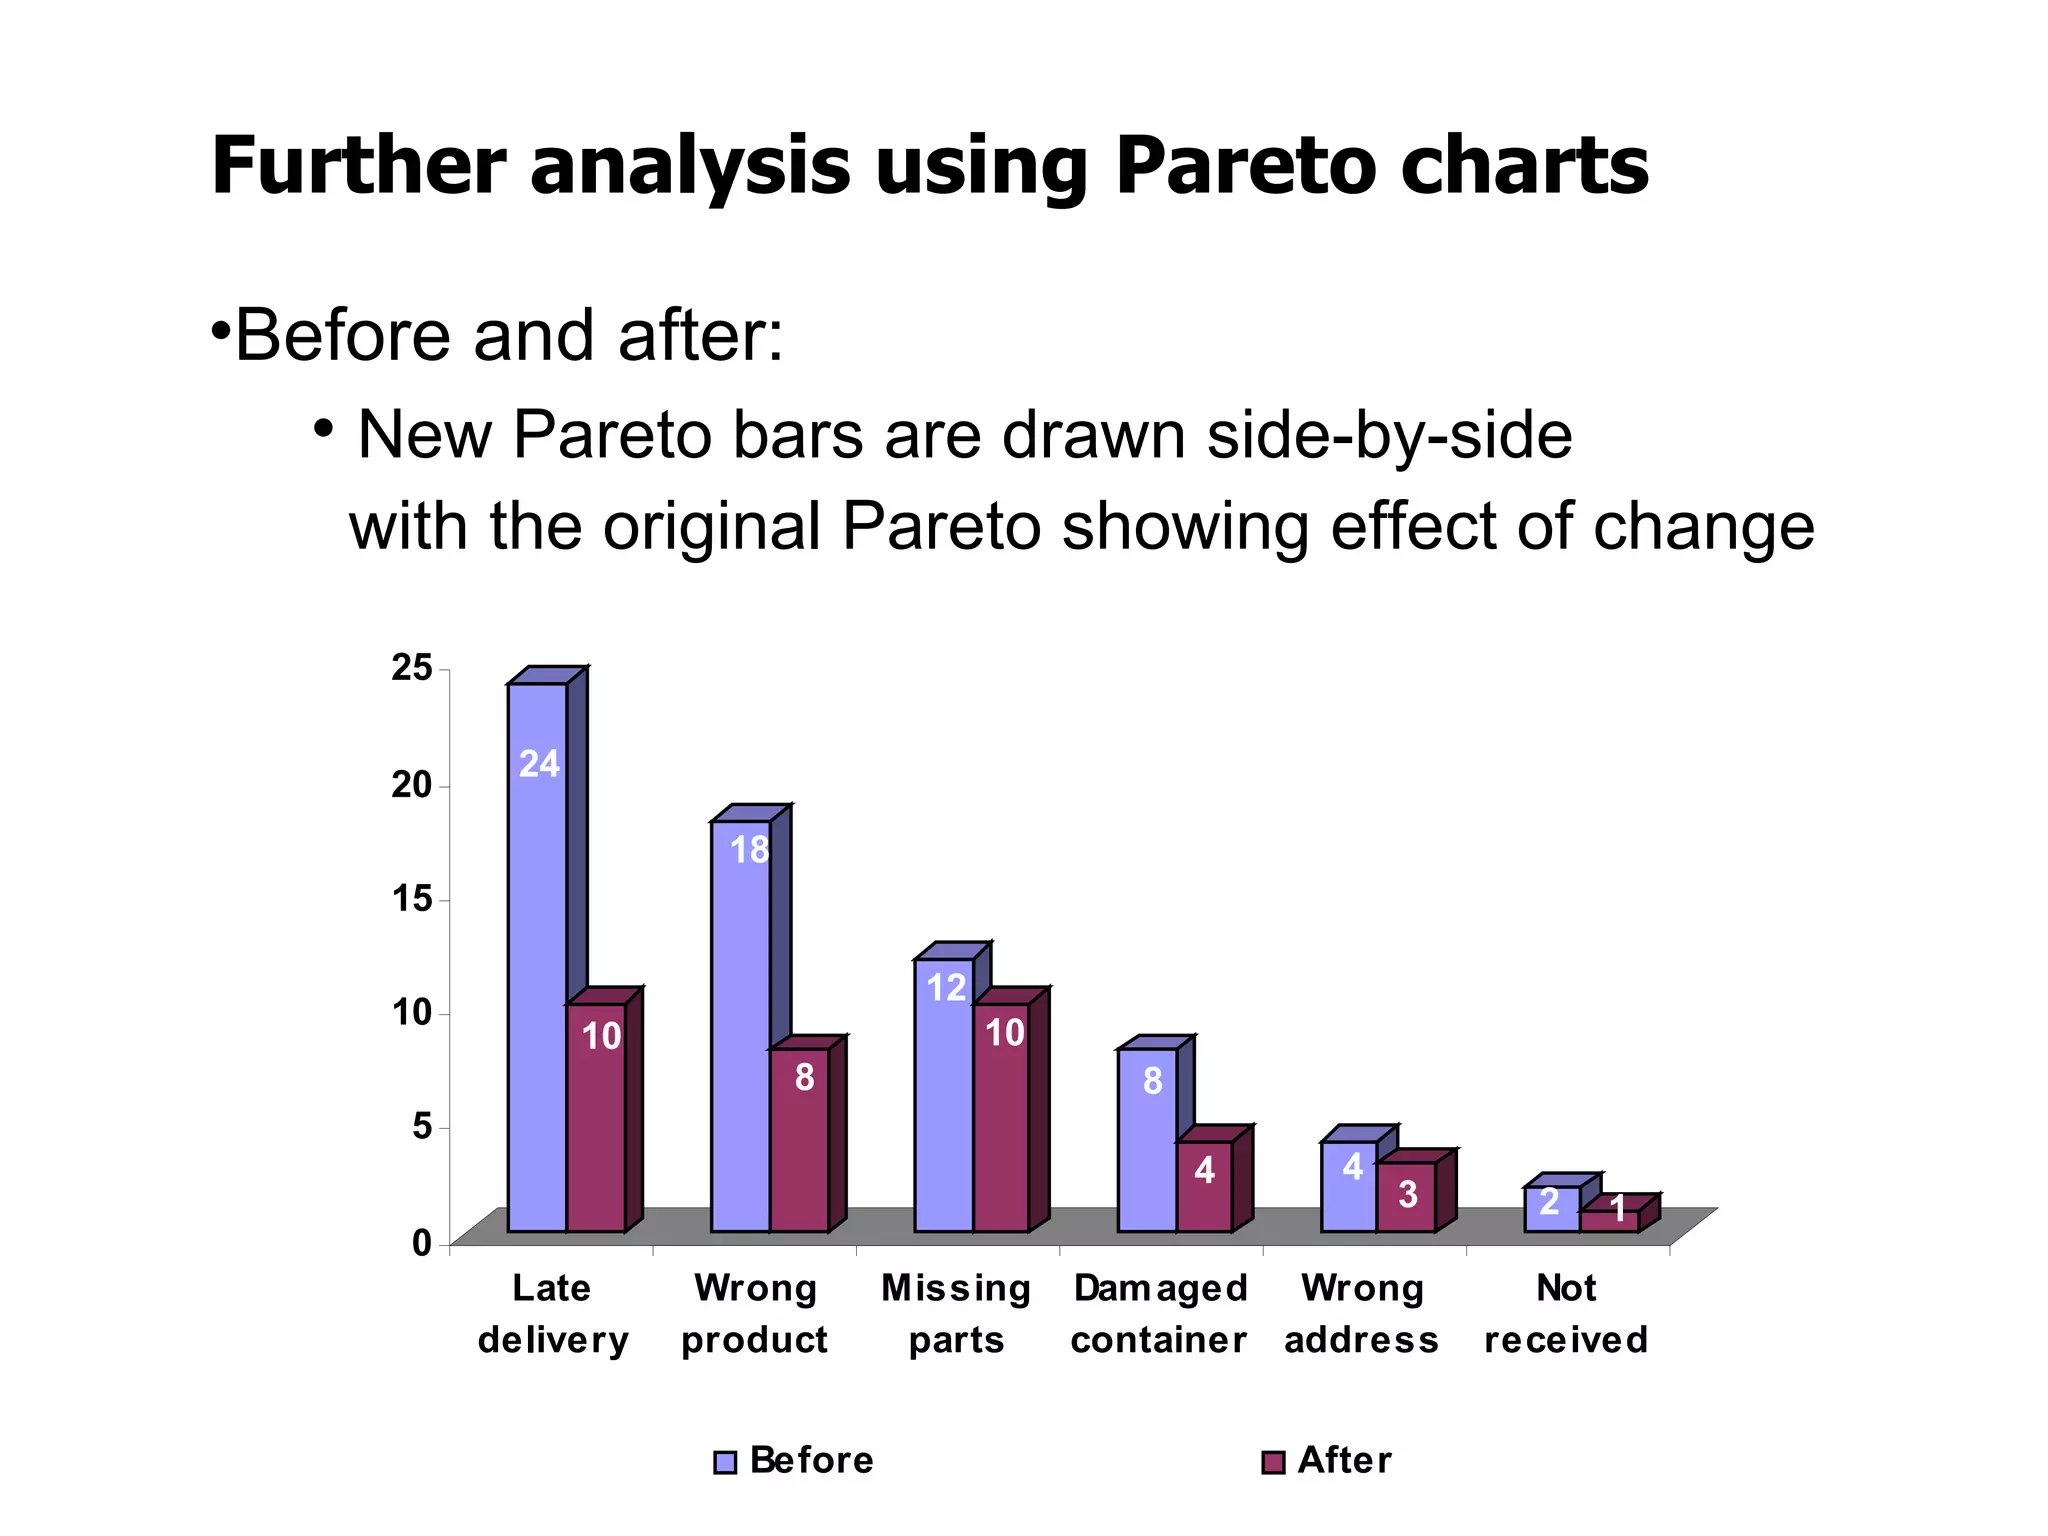
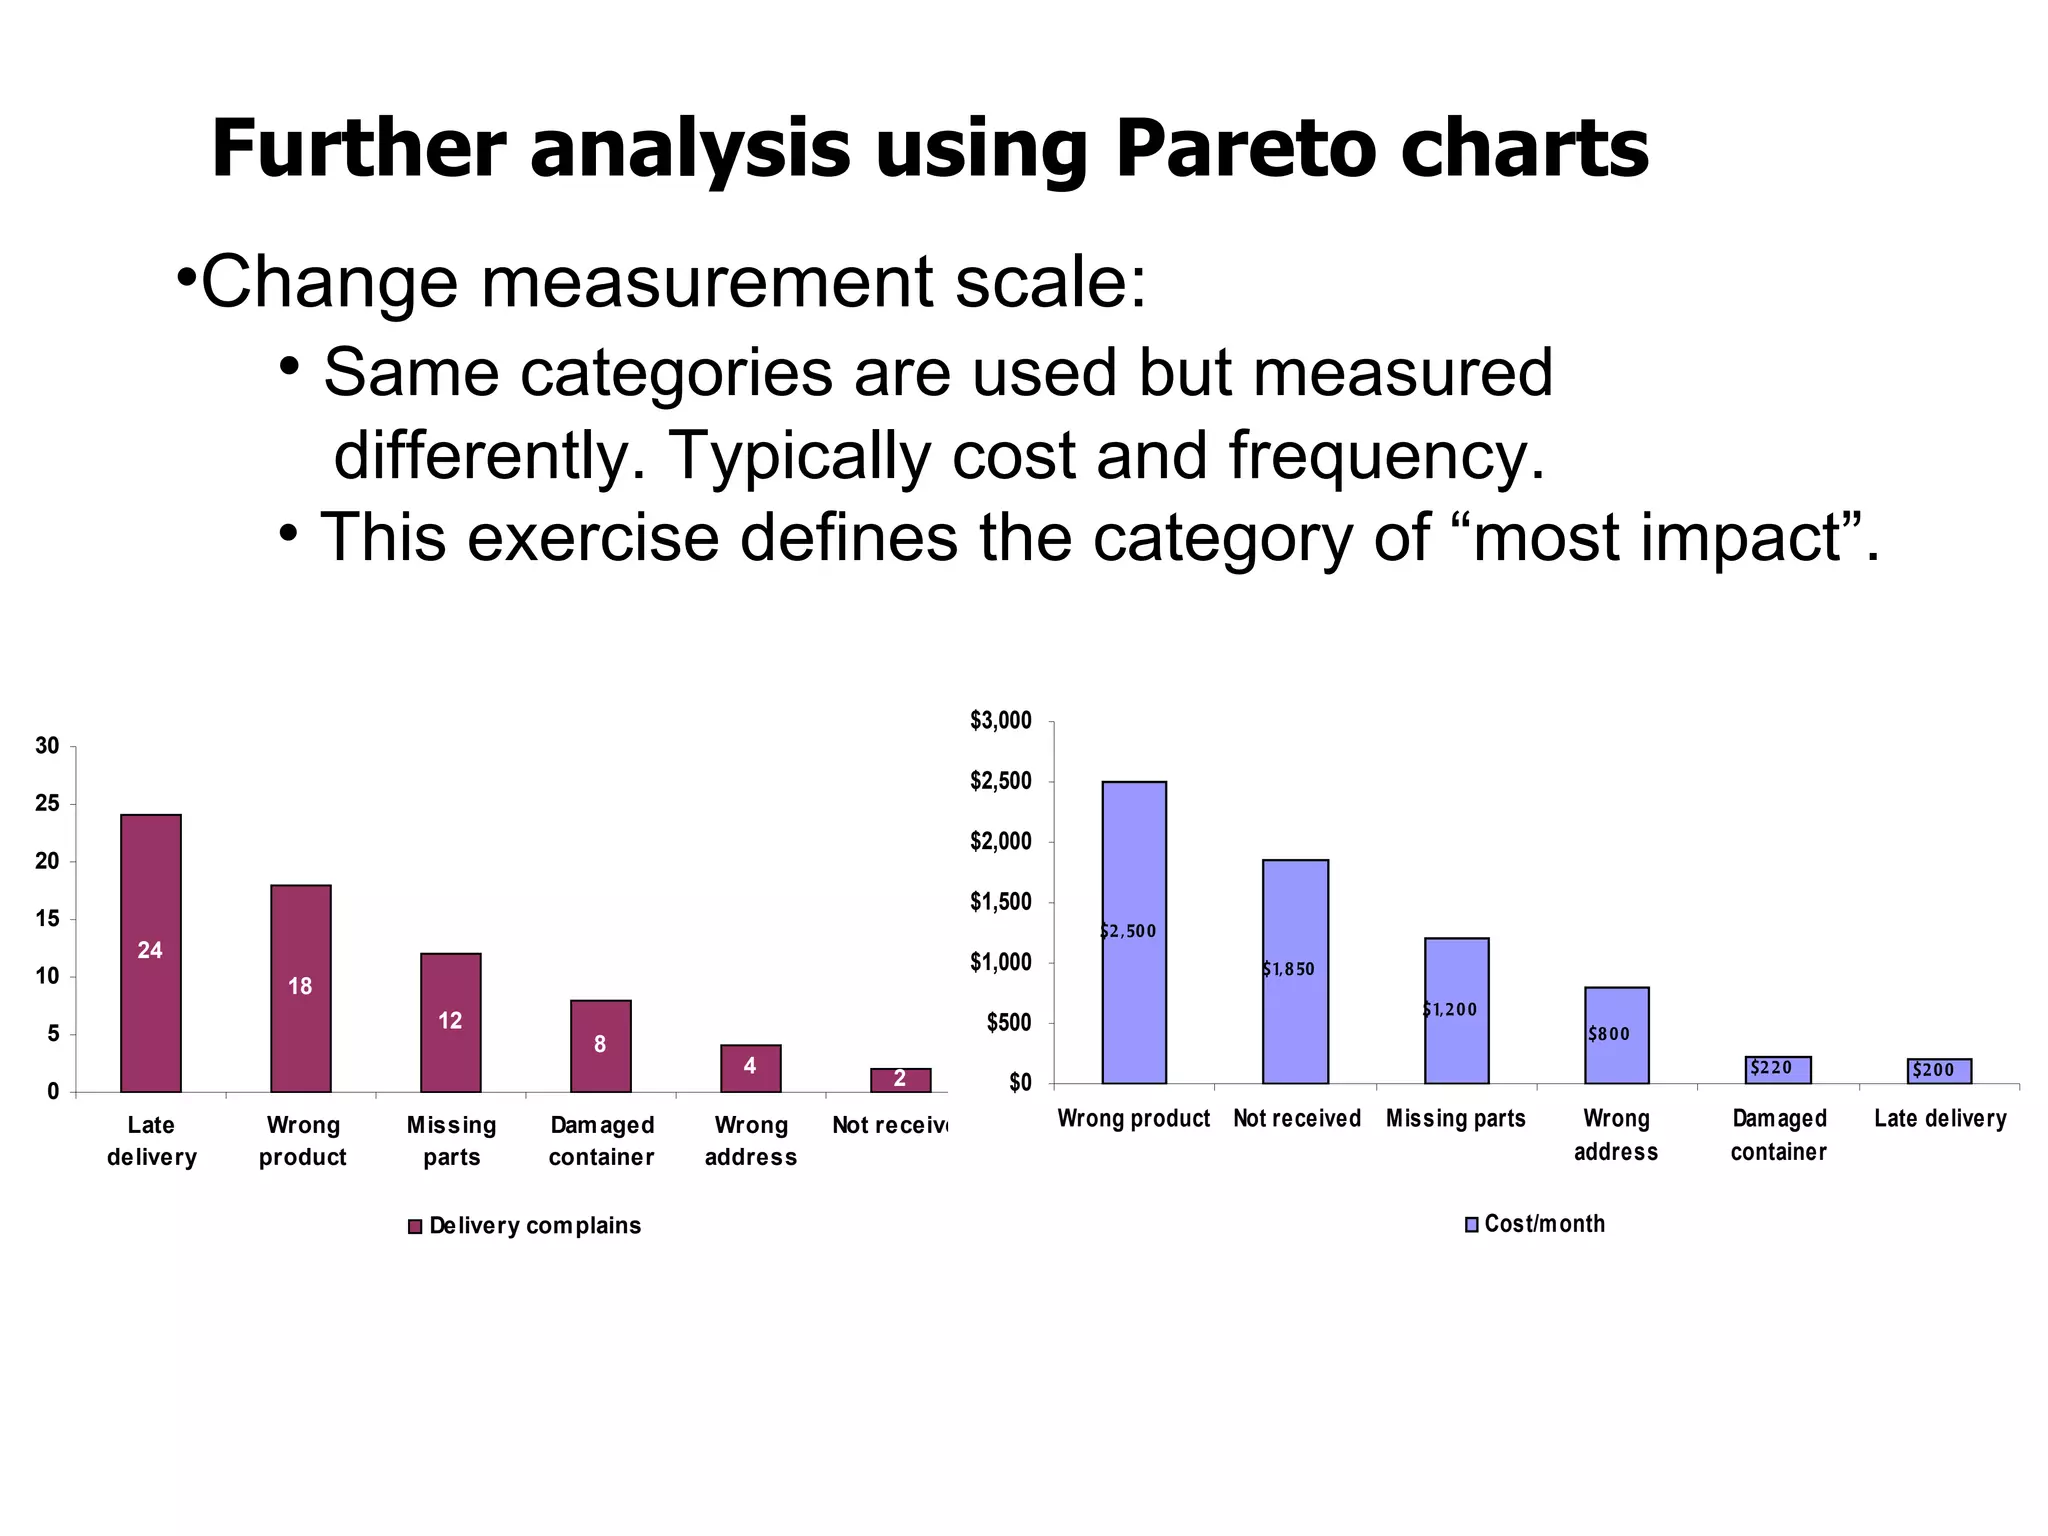
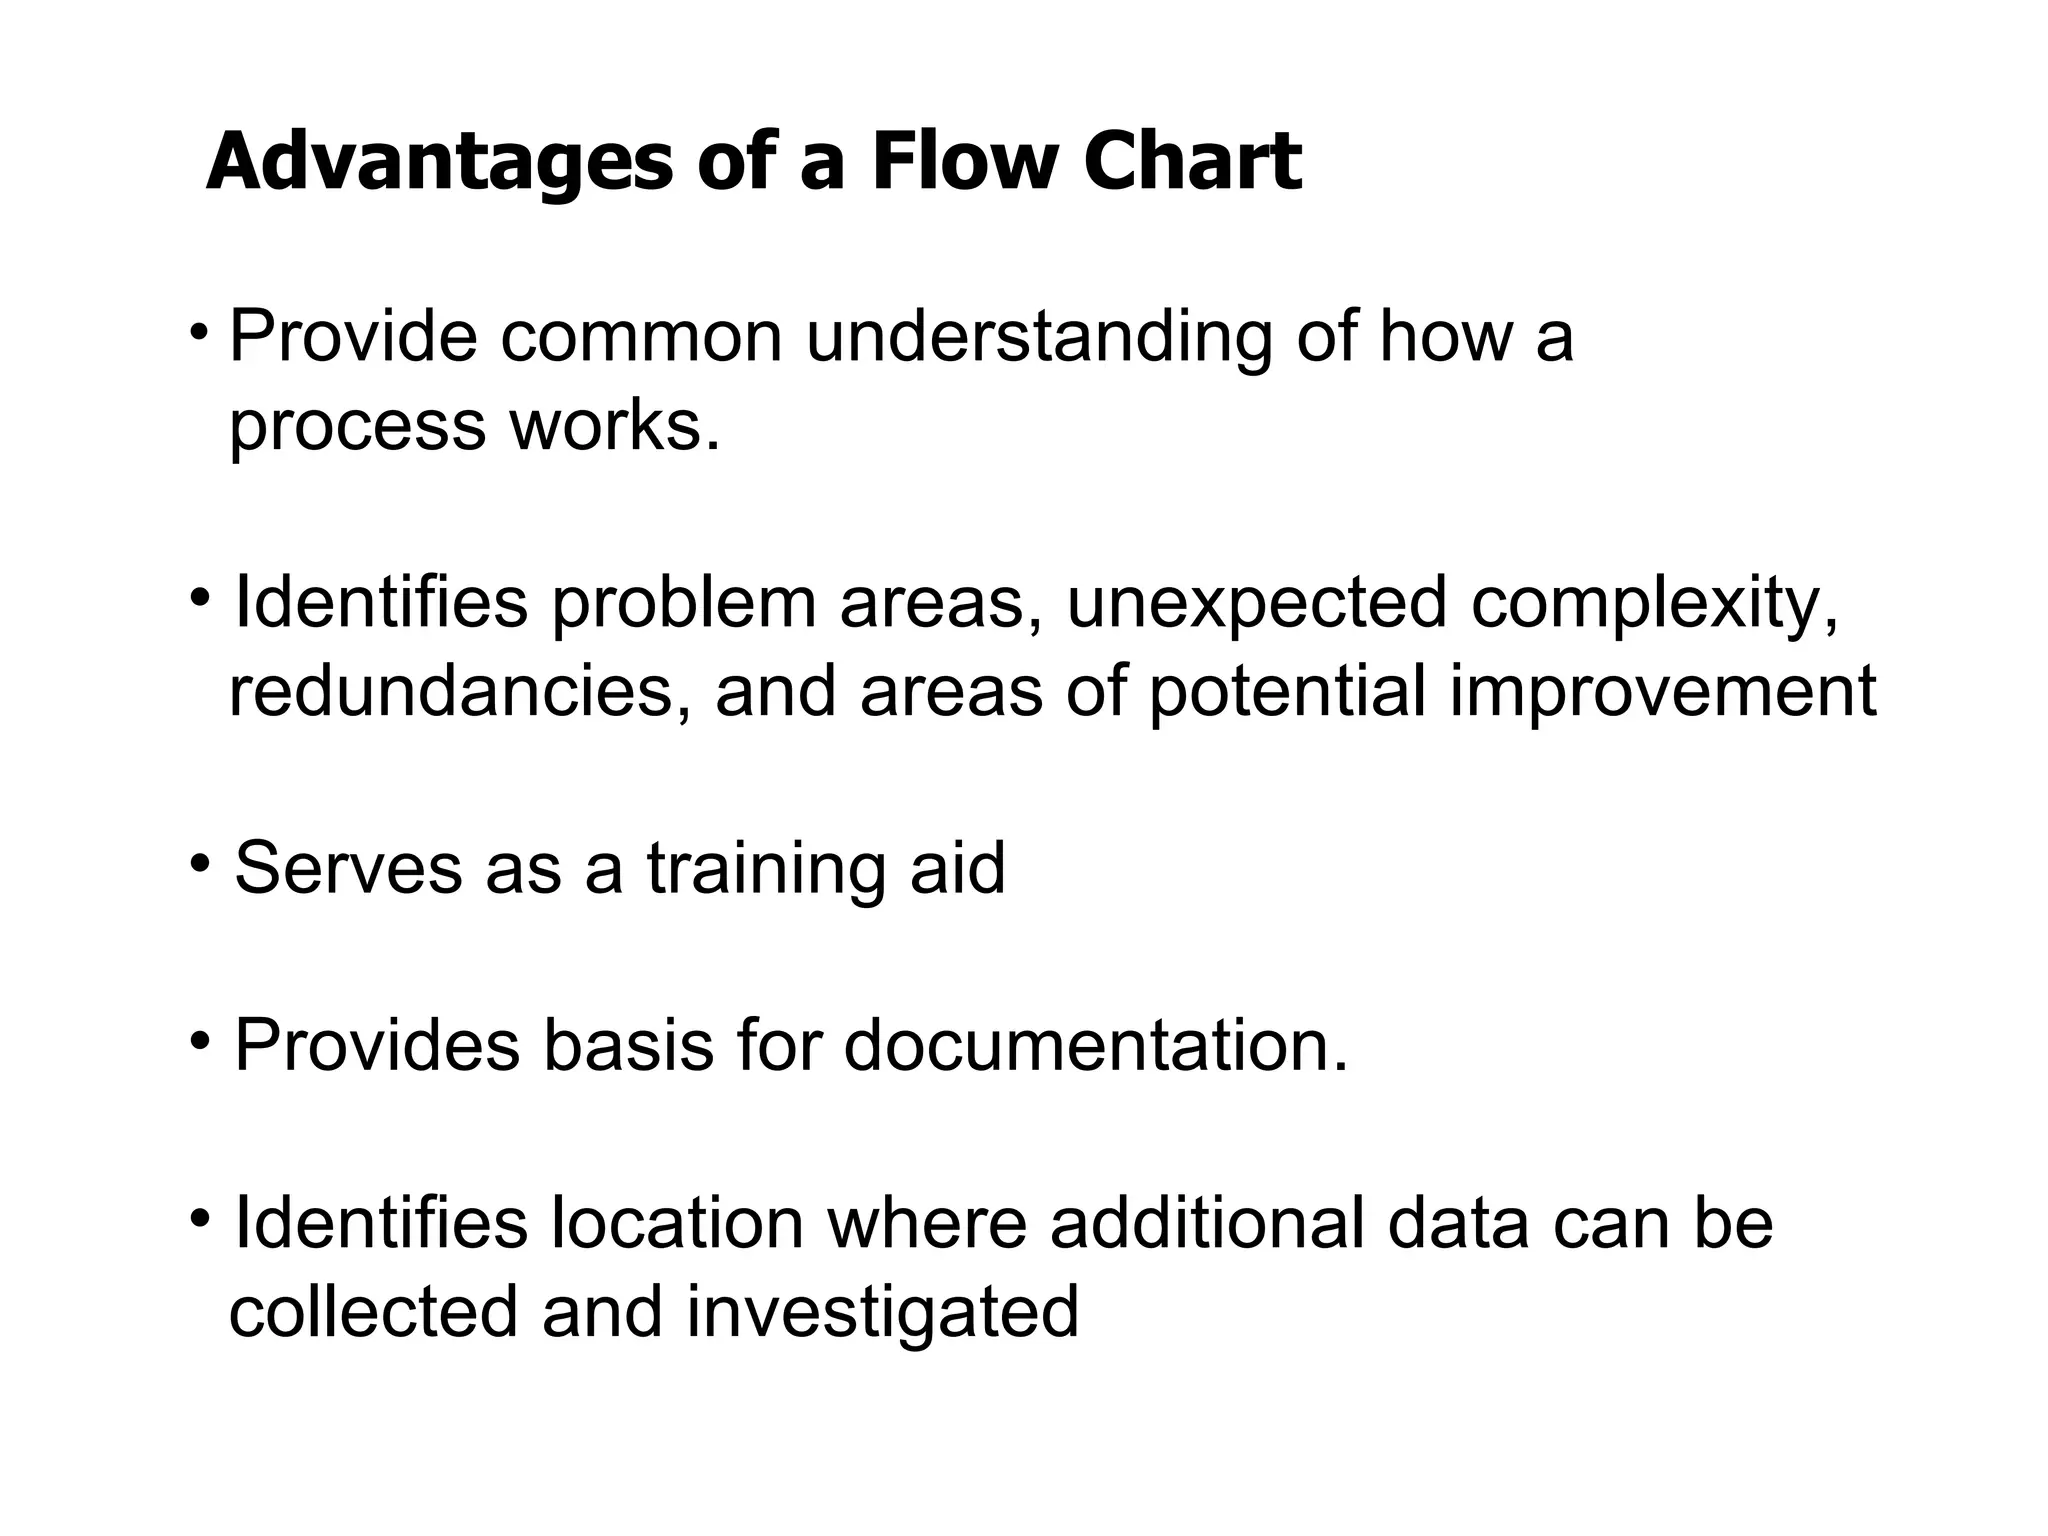
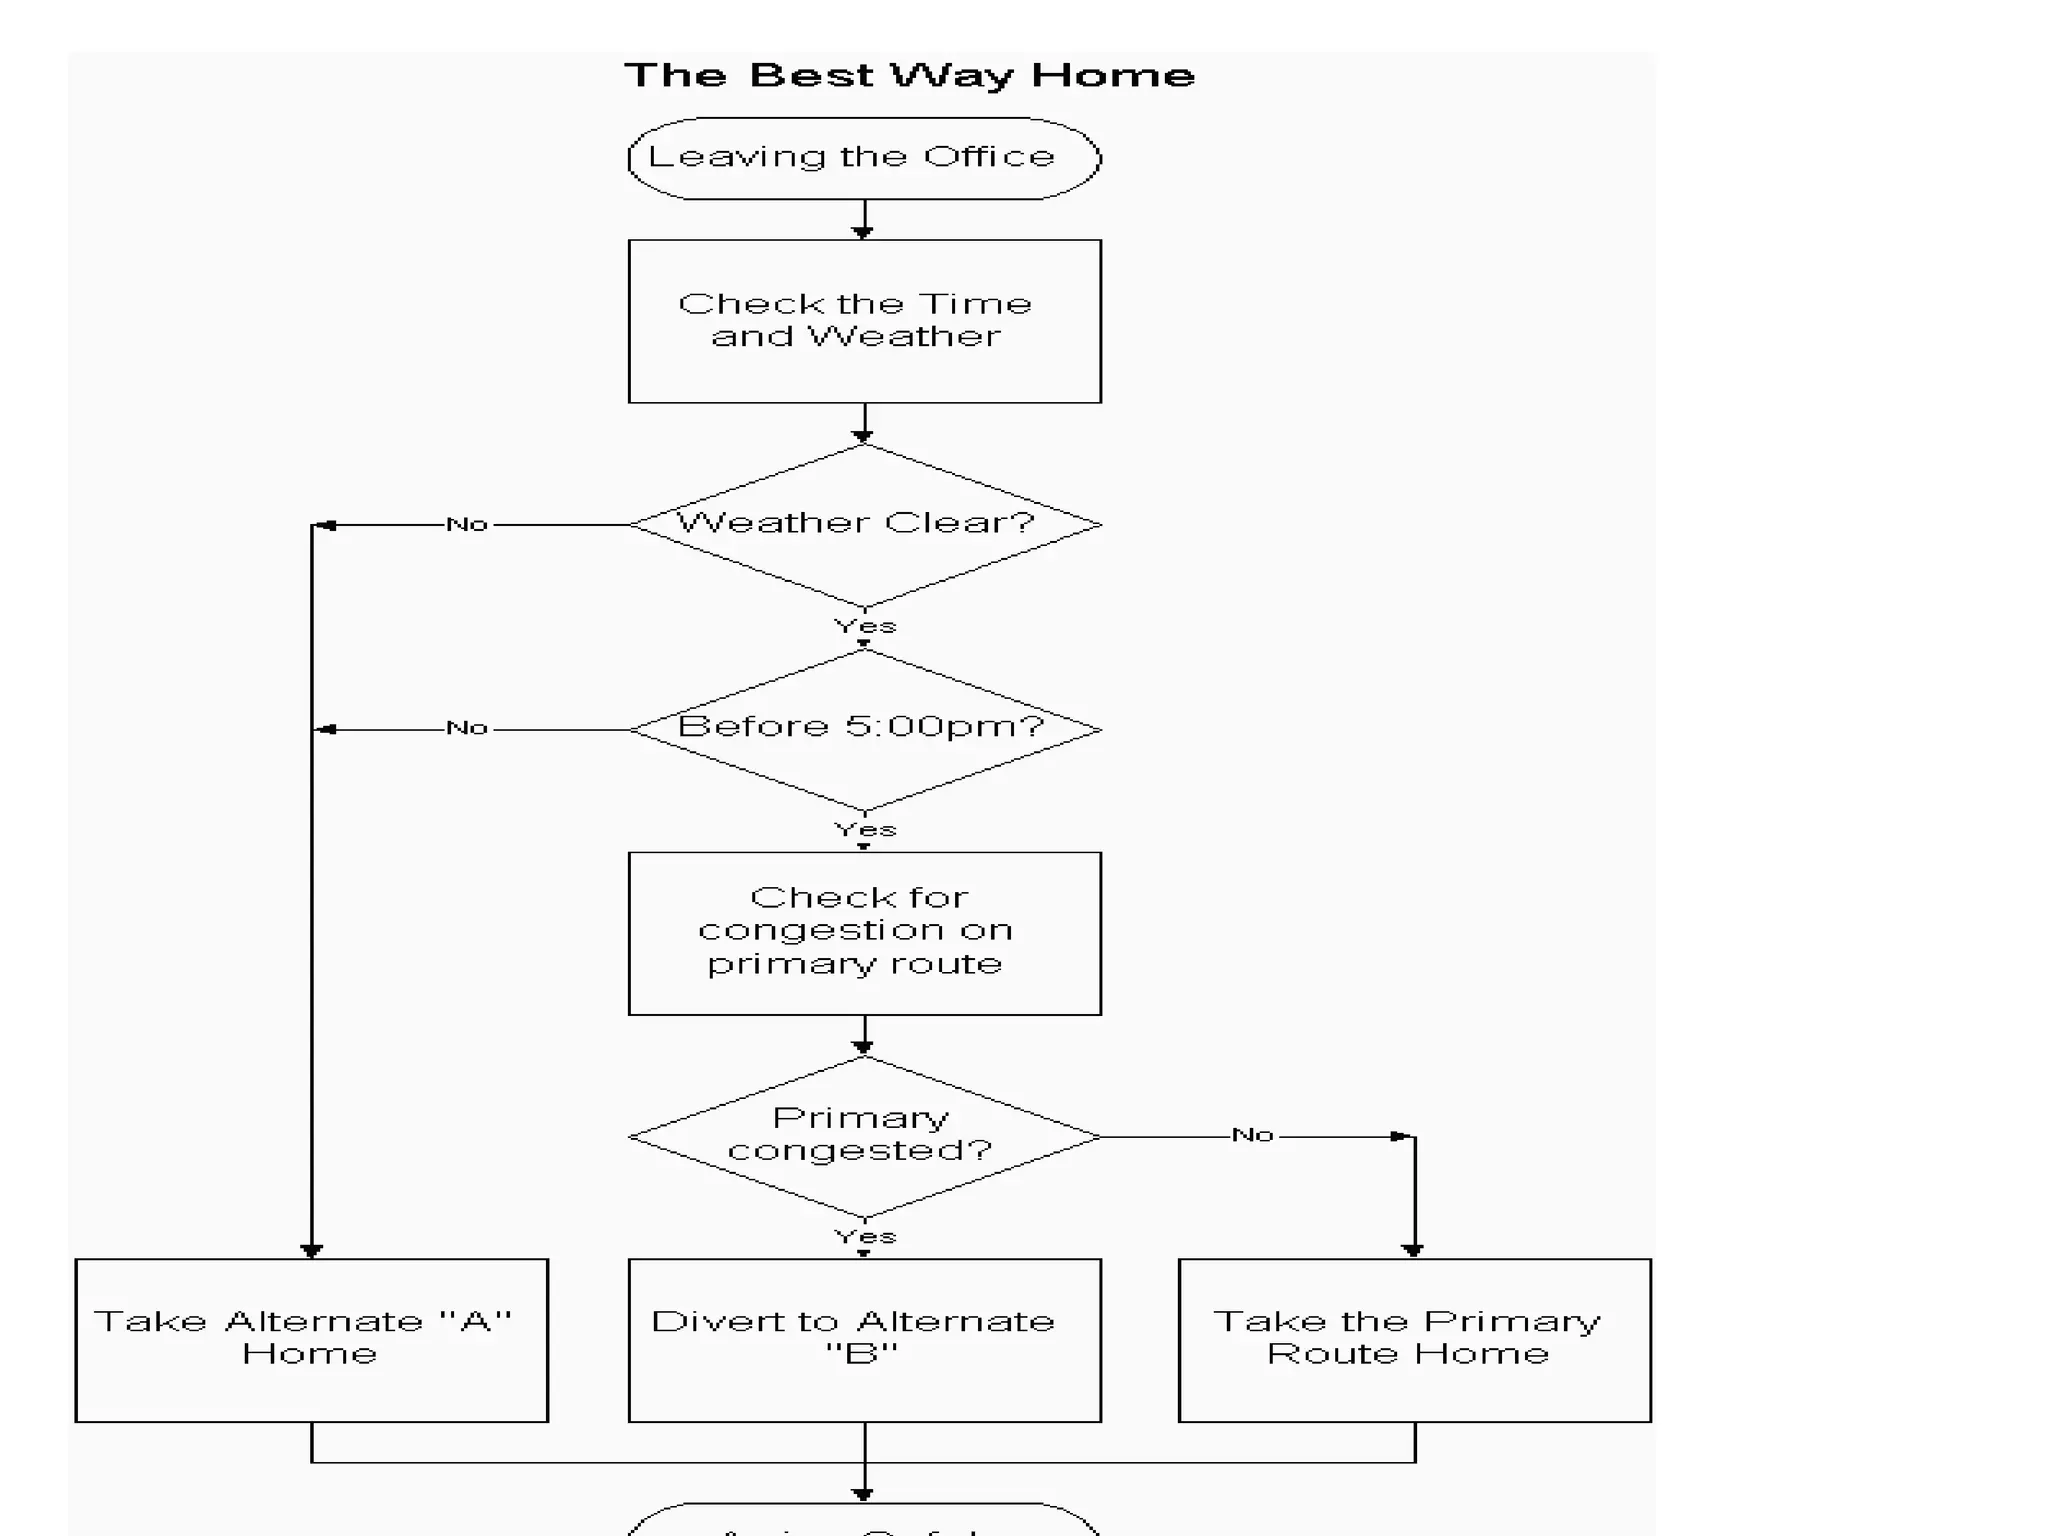
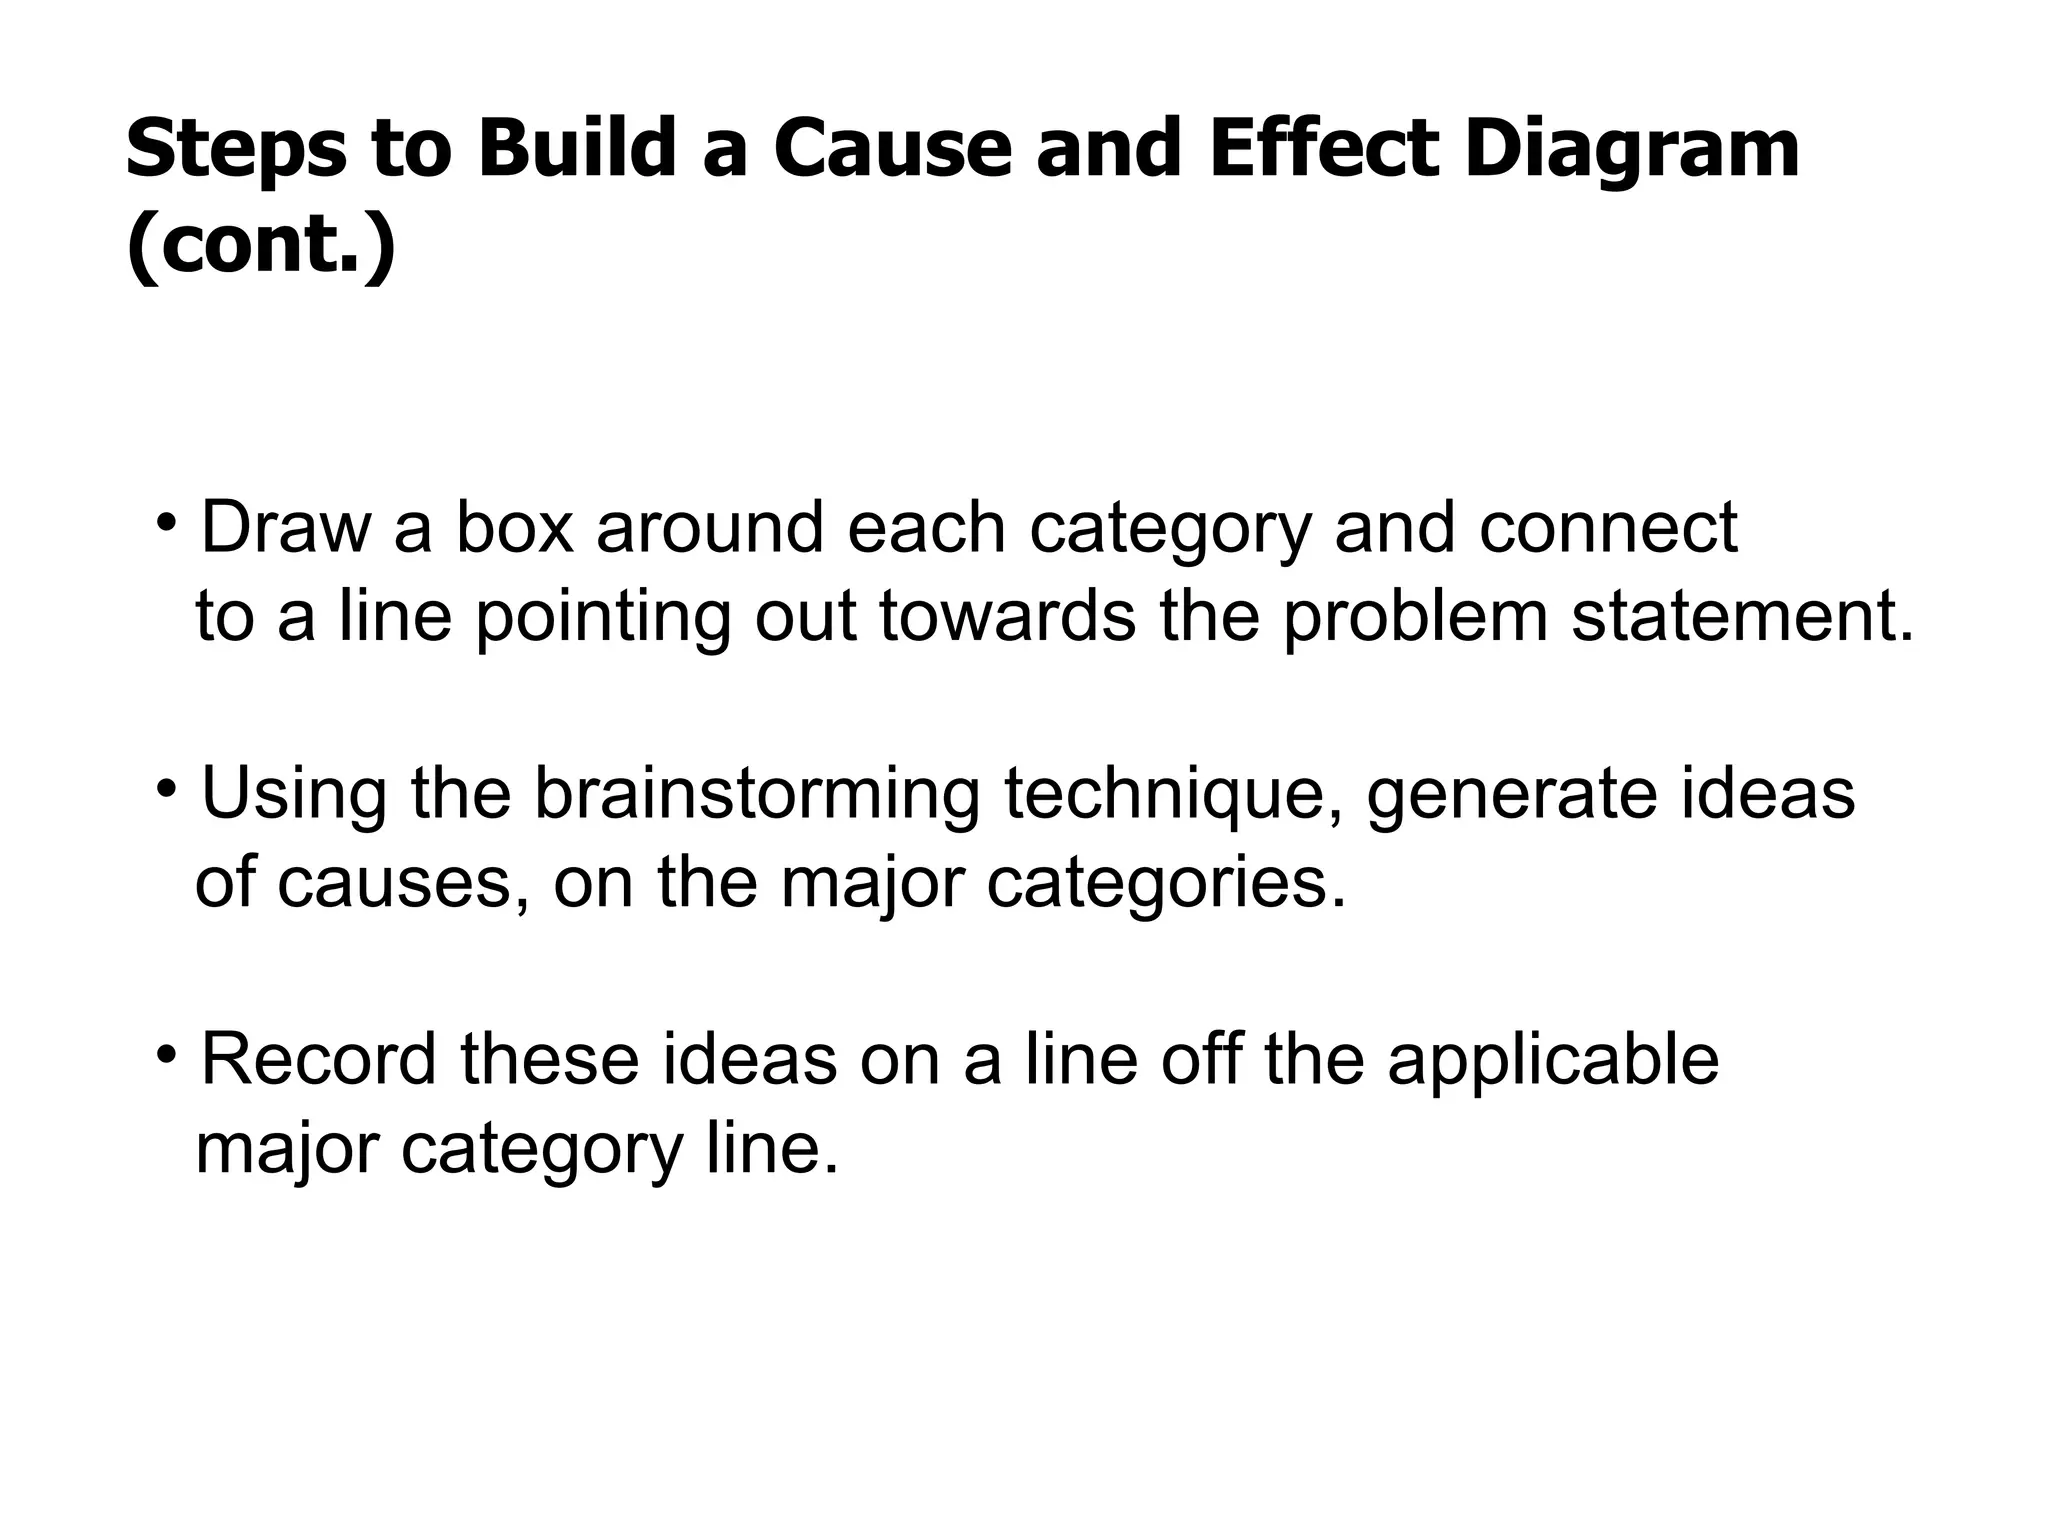
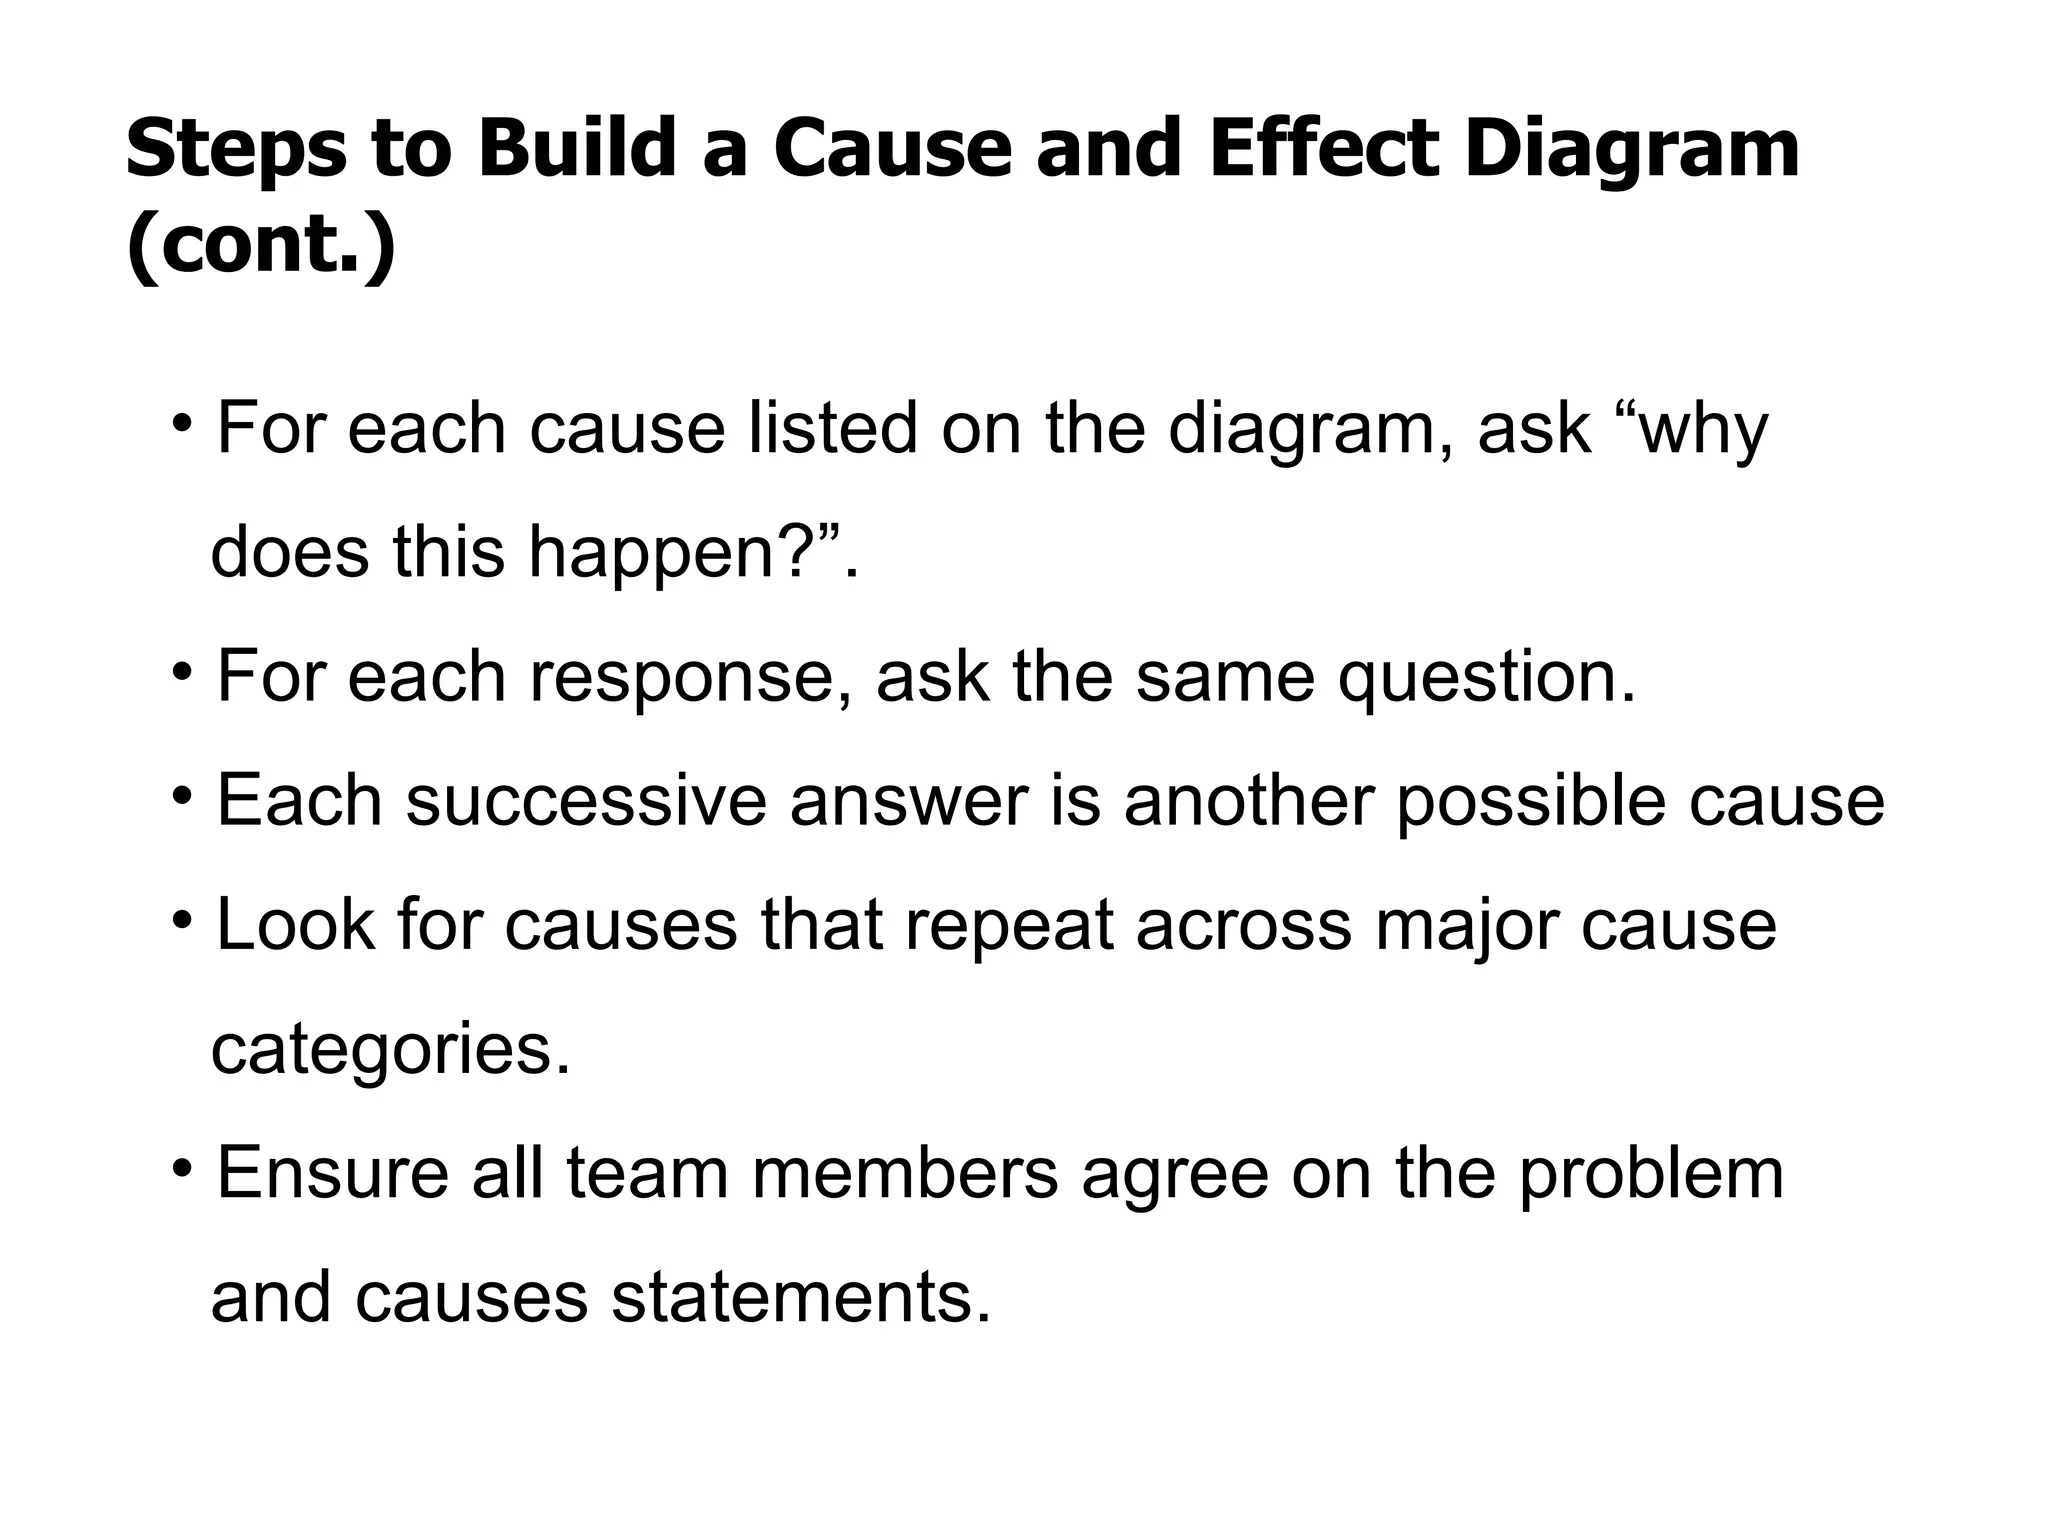
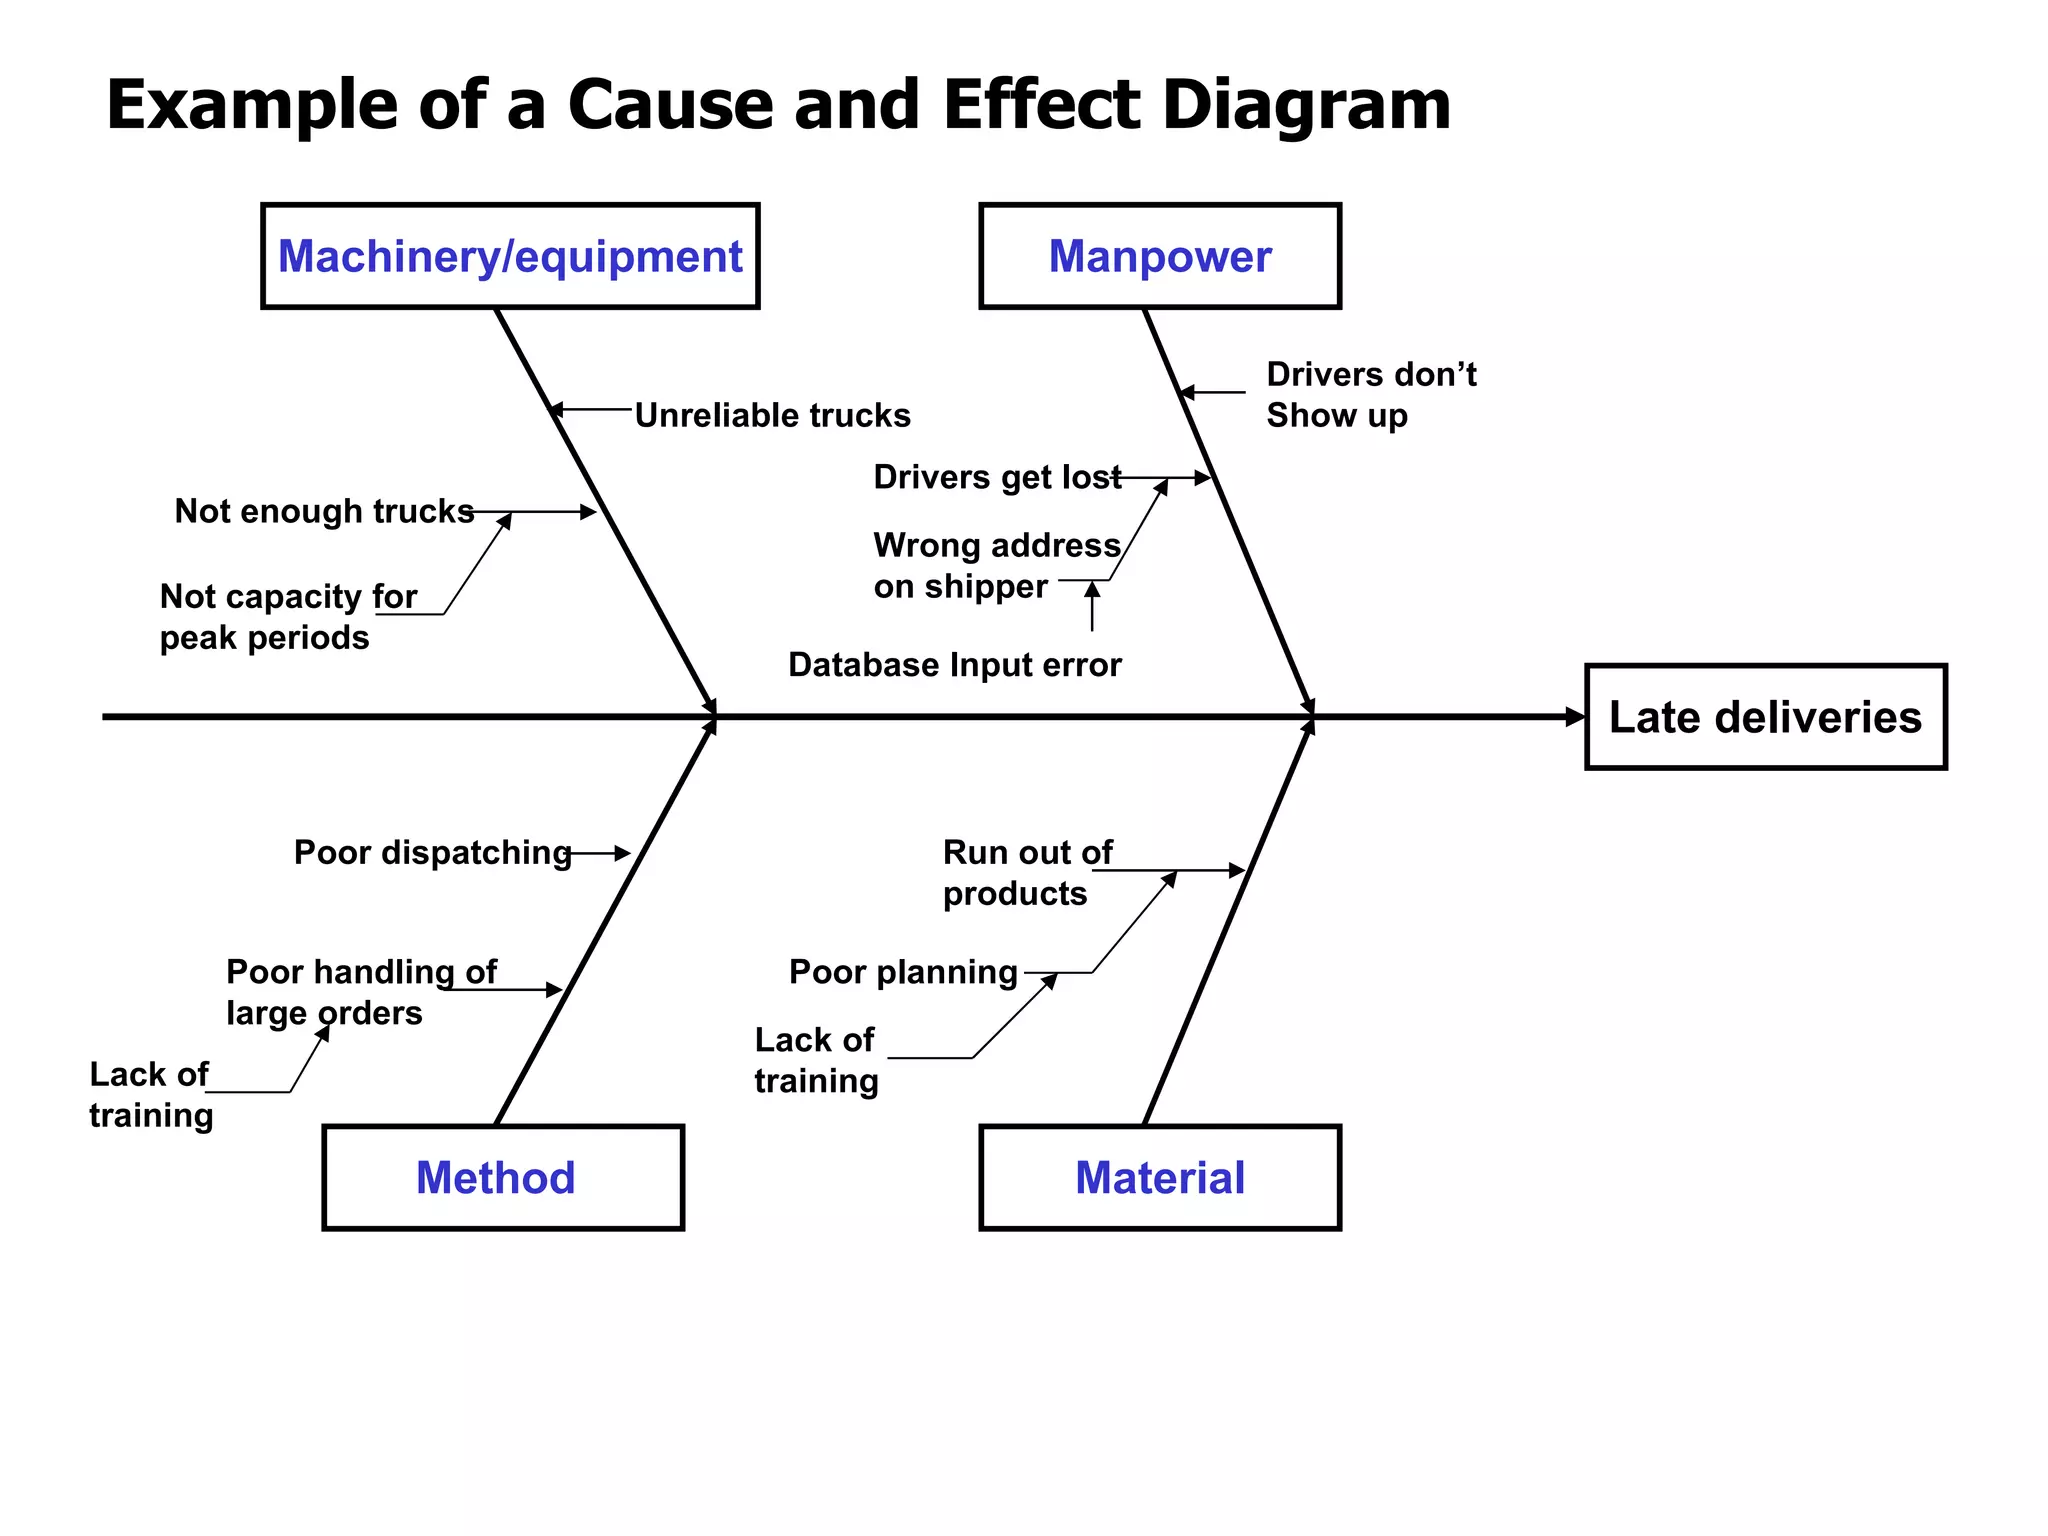
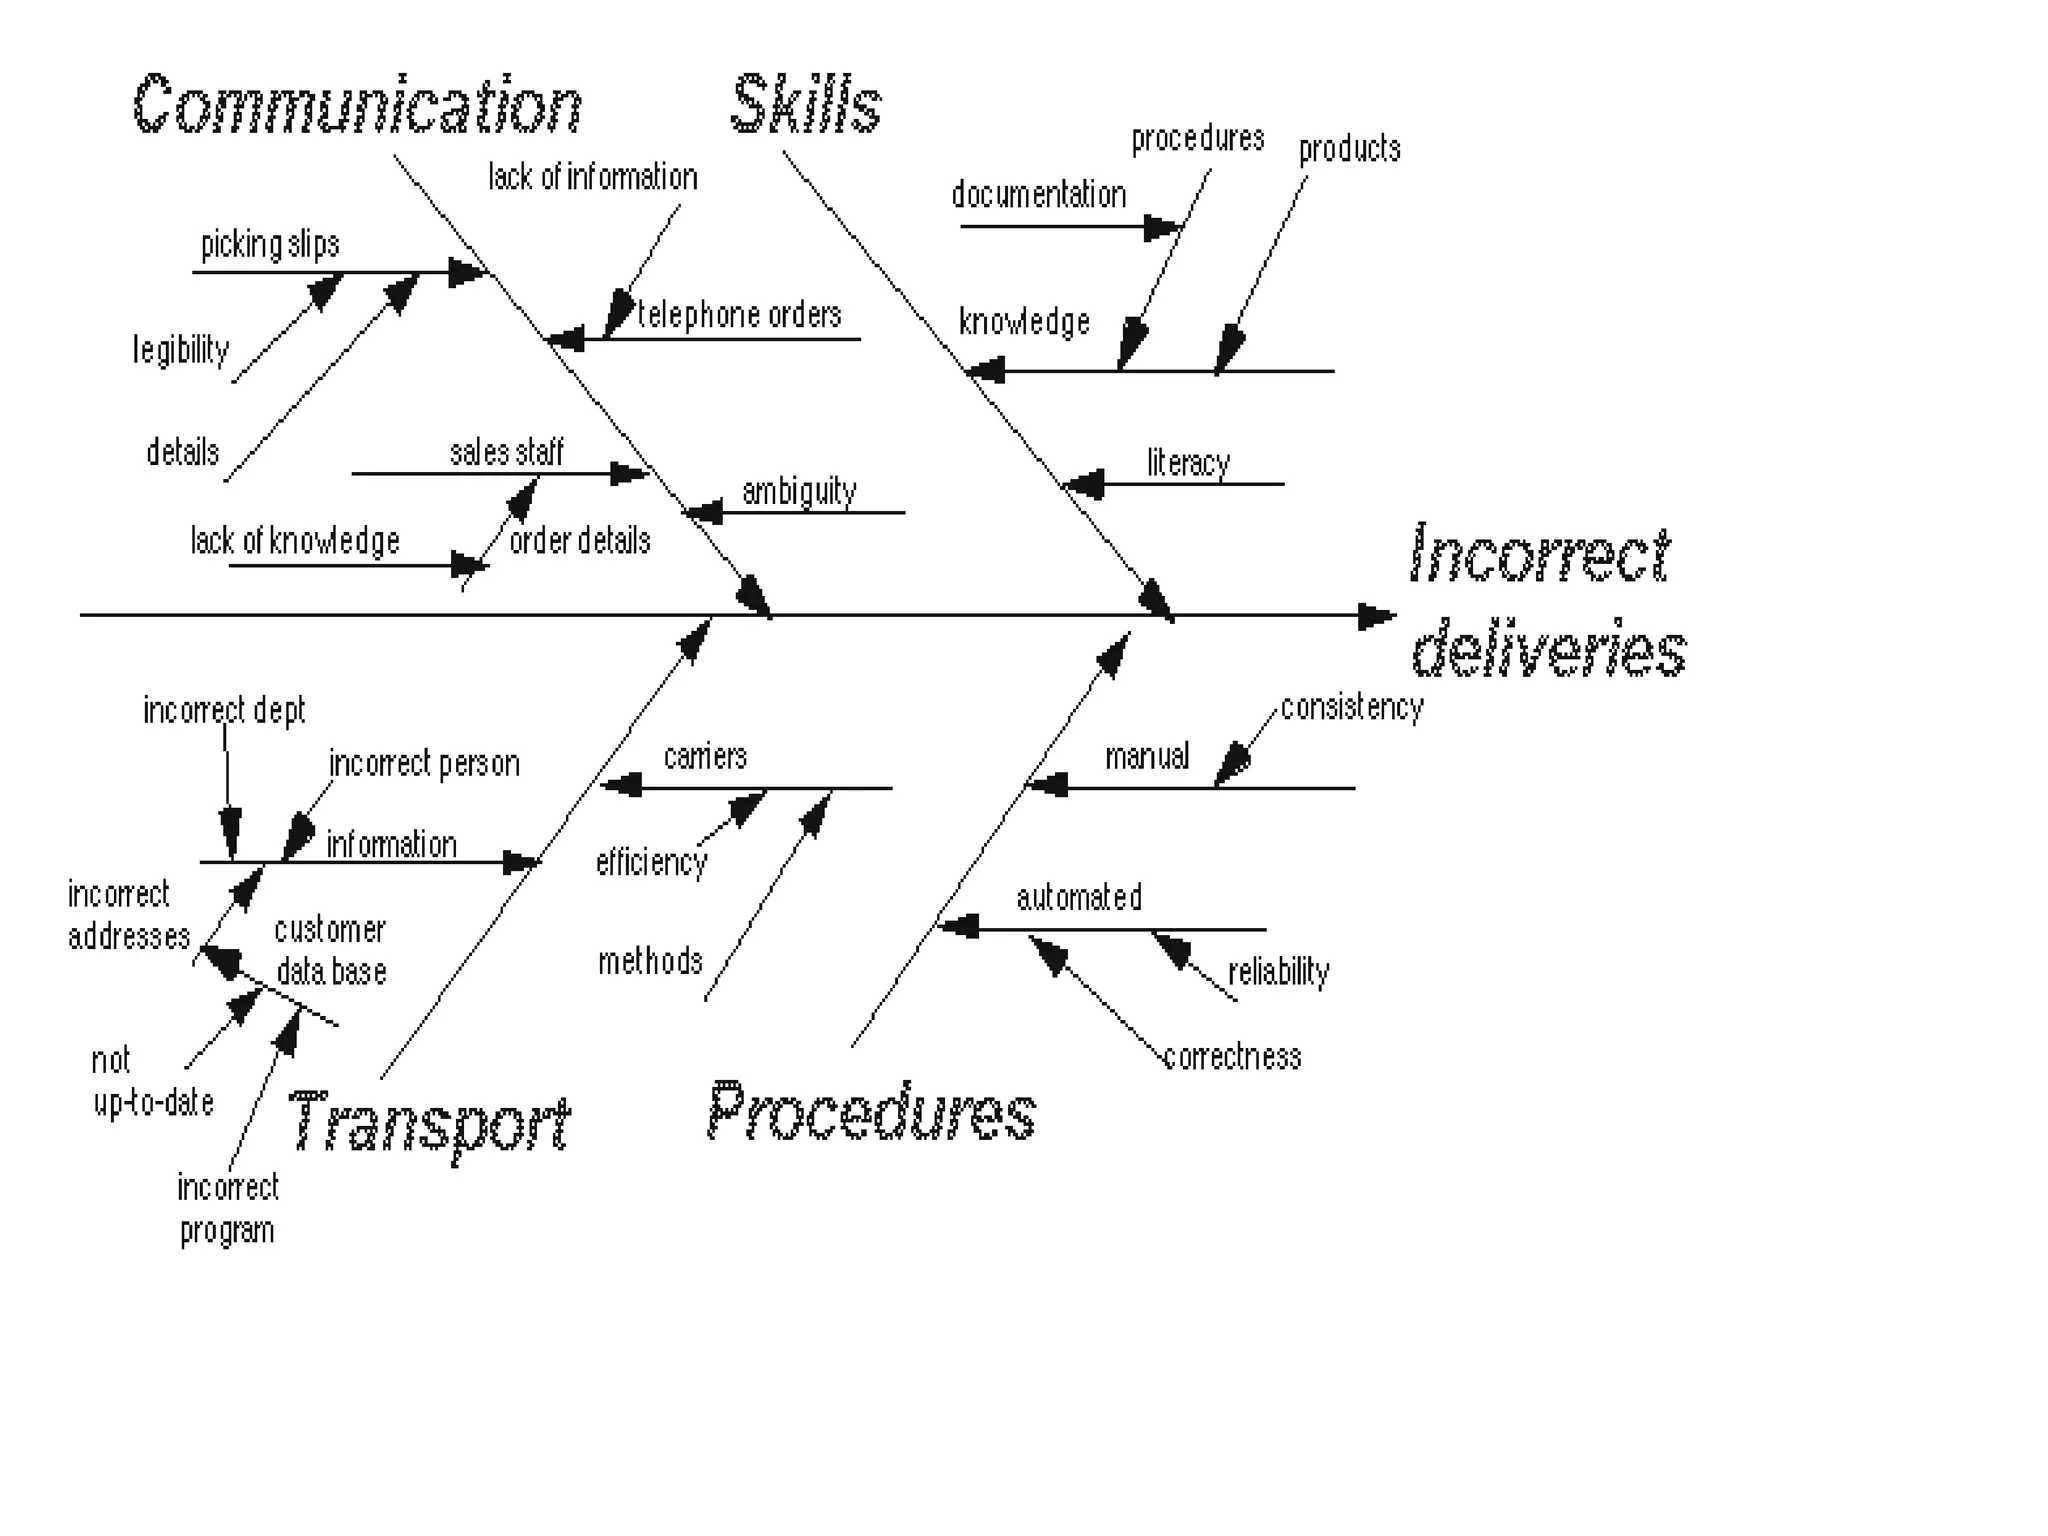
This document discusses quality assurance tools, specifically the seven basic tools of quality: Pareto charts, flow charts, cause-and-effect diagrams, check sheets, histograms, control charts, and scatter diagrams. It provides definitions and explanations of each tool, including their advantages and the basic steps to construct them. The purpose of these tools is to help analyze processes, identify problems, find their causes, and determine solutions to improve quality.
COEPD - Center of Excellence for Professional Development is a primarily a Business Analyst Training Institute in the IT industry of India head quartered at Hyderabad. COEPD is expert in Business Analyst Training in Hyderabad, Chennai, Pune , Mumbai & Vizag. We offer Business Analyst Training with affordable prices that fit your needs.
COEPD conducts 4-day workshops throughout the year for all participants in various locations i.e. Hyderabad, Pune. The workshops are also conducted on Saturdays and Sundays for the convenience of working professionals.
For More Details Please Contact us:
Visit at http://www.coepd.com or http://www.facebook.com/BusinessAnalystTraining
Center of Excellence for Professional Development
3rd Floor, Sahithi Arcade, S R Nagar,
Hyderabad 500 038, India.
Ph# +91 9000155700,
helpdesk@coepd.com
This Lean Six Sigma Yellow Belt Training and Certification Course helps you understand Six Sigma principles, tools, and examples, and do a realistic project in a step-by-step manner.
An in-depth discussion on the new automotive Quality Mangement System Standard 16949: 2016 and the challenges in moving to this new version from the old ISO/TS 16949. From processes to procedures, work instructions to risks, Michael Wolfe and Jonathan Brun discuss the best practices to stay in complete compliance with the standard.
Introduction of Production Planing, Levels and Procedure of Production Planning , Introduction of Production Control and its techniques , Relationship or difference between production planning and control
New Horizons Computer Learning Centers of Southern California Instructor Borhan Musleh covers Lean Six Sigma at the White Belt level in this webinar, originally broadcast on March 6, 2014.
MeasureWorks - Velocity Conference Europe - Performance Automation 101MeasureWorks
For optimizing web performance most of you have put to practice the "14 rules for creating high performance websites". But most IT organizations don't have the resources, time or money available to continuously fine-tune their web performance. There’s a need for a different approach, automation of web performance optimization. This presentation will not only cover the business benefits of automation, but also prove that automation works and improves your website by taking multiple automation providers for a test-drive....
Nearly 900 million handheld computers are expected to be in use by 2015. How relevant is this shift to mobile and the growth of apps? Benedict Evans, consultant with media & technology analyst firm Enders Analysis, believes we are in a fundamental transition in the way we use digital
The Presentation covers the topics like Introduction to Pareto Chart, 80-20 rule, examples, when to use Pareto, and how to draw a pareto chart on excel.
We’d like to share with you the announcement related to our Q4 2011 earnings. We’ll also be live sharing the earnings call both from LinkedIn’s Company Page and our @linkedin account, starting 2PM today, Feb 9.
Why You Should Replace Windows 11 with Nitrux Linux 3.5.0 for enhanced perfor...SOFTTECHHUB
The choice of an operating system plays a pivotal role in shaping our computing experience. For decades, Microsoft's Windows has dominated the market, offering a familiar and widely adopted platform for personal and professional use. However, as technological advancements continue to push the boundaries of innovation, alternative operating systems have emerged, challenging the status quo and offering users a fresh perspective on computing.
One such alternative that has garnered significant attention and acclaim is Nitrux Linux 3.5.0, a sleek, powerful, and user-friendly Linux distribution that promises to redefine the way we interact with our devices. With its focus on performance, security, and customization, Nitrux Linux presents a compelling case for those seeking to break free from the constraints of proprietary software and embrace the freedom and flexibility of open-source computing.
Goodbye Windows 11: Make Way for Nitrux Linux 3.5.0!SOFTTECHHUB
As the digital landscape continually evolves, operating systems play a critical role in shaping user experiences and productivity. The launch of Nitrux Linux 3.5.0 marks a significant milestone, offering a robust alternative to traditional systems such as Windows 11. This article delves into the essence of Nitrux Linux 3.5.0, exploring its unique features, advantages, and how it stands as a compelling choice for both casual users and tech enthusiasts.
Observability Concepts EVERY Developer Should Know -- DeveloperWeek Europe.pdfPaige Cruz
Monitoring and observability aren’t traditionally found in software curriculums and many of us cobble this knowledge together from whatever vendor or ecosystem we were first introduced to and whatever is a part of your current company’s observability stack.
While the dev and ops silo continues to crumble….many organizations still relegate monitoring & observability as the purview of ops, infra and SRE teams. This is a mistake - achieving a highly observable system requires collaboration up and down the stack.
I, a former op, would like to extend an invitation to all application developers to join the observability party will share these foundational concepts to build on:
A tale of scale & speed: How the US Navy is enabling software delivery from l...sonjaschweigert1
Rapid and secure feature delivery is a goal across every application team and every branch of the DoD. The Navy’s DevSecOps platform, Party Barge, has achieved:
- Reduction in onboarding time from 5 weeks to 1 day
- Improved developer experience and productivity through actionable findings and reduction of false positives
- Maintenance of superior security standards and inherent policy enforcement with Authorization to Operate (ATO)
Development teams can ship efficiently and ensure applications are cyber ready for Navy Authorizing Officials (AOs). In this webinar, Sigma Defense and Anchore will give attendees a look behind the scenes and demo secure pipeline automation and security artifacts that speed up application ATO and time to production.
We will cover:
- How to remove silos in DevSecOps
- How to build efficient development pipeline roles and component templates
- How to deliver security artifacts that matter for ATO’s (SBOMs, vulnerability reports, and policy evidence)
- How to streamline operations with automated policy checks on container images
How to Get CNIC Information System with Paksim Ga.pptxdanishmna97
Pakdata Cf is a groundbreaking system designed to streamline and facilitate access to CNIC information. This innovative platform leverages advanced technology to provide users with efficient and secure access to their CNIC details.
Pushing the limits of ePRTC: 100ns holdover for 100 daysAdtran
At WSTS 2024, Alon Stern explored the topic of parametric holdover and explained how recent research findings can be implemented in real-world PNT networks to achieve 100 nanoseconds of accuracy for up to 100 days.
GraphRAG is All You need? LLM & Knowledge GraphGuy Korland
Guy Korland, CEO and Co-founder of FalkorDB, will review two articles on the integration of language models with knowledge graphs.
1. Unifying Large Language Models and Knowledge Graphs: A Roadmap.
https://arxiv.org/abs/2306.08302
2. Microsoft Research's GraphRAG paper and a review paper on various uses of knowledge graphs:
https://www.microsoft.com/en-us/research/blog/graphrag-unlocking-llm-discovery-on-narrative-private-data/
Securing your Kubernetes cluster_ a step-by-step guide to success !KatiaHIMEUR1
Today, after several years of existence, an extremely active community and an ultra-dynamic ecosystem, Kubernetes has established itself as the de facto standard in container orchestration. Thanks to a wide range of managed services, it has never been so easy to set up a ready-to-use Kubernetes cluster.
However, this ease of use means that the subject of security in Kubernetes is often left for later, or even neglected. This exposes companies to significant risks.
In this talk, I'll show you step-by-step how to secure your Kubernetes cluster for greater peace of mind and reliability.
Communications Mining Series - Zero to Hero - Session 1DianaGray10
This session provides introduction to UiPath Communication Mining, importance and platform overview. You will acquire a good understand of the phases in Communication Mining as we go over the platform with you. Topics covered:
• Communication Mining Overview
• Why is it important?
• How can it help today’s business and the benefits
• Phases in Communication Mining
• Demo on Platform overview
• Q/A
Removing Uninteresting Bytes in Software FuzzingAftab Hussain
Imagine a world where software fuzzing, the process of mutating bytes in test seeds to uncover hidden and erroneous program behaviors, becomes faster and more effective. A lot depends on the initial seeds, which can significantly dictate the trajectory of a fuzzing campaign, particularly in terms of how long it takes to uncover interesting behaviour in your code. We introduce DIAR, a technique designed to speedup fuzzing campaigns by pinpointing and eliminating those uninteresting bytes in the seeds. Picture this: instead of wasting valuable resources on meaningless mutations in large, bloated seeds, DIAR removes the unnecessary bytes, streamlining the entire process.
In this work, we equipped AFL, a popular fuzzer, with DIAR and examined two critical Linux libraries -- Libxml's xmllint, a tool for parsing xml documents, and Binutil's readelf, an essential debugging and security analysis command-line tool used to display detailed information about ELF (Executable and Linkable Format). Our preliminary results show that AFL+DIAR does not only discover new paths more quickly but also achieves higher coverage overall. This work thus showcases how starting with lean and optimized seeds can lead to faster, more comprehensive fuzzing campaigns -- and DIAR helps you find such seeds.
- These are slides of the talk given at IEEE International Conference on Software Testing Verification and Validation Workshop, ICSTW 2022.
GraphSummit Singapore | The Future of Agility: Supercharging Digital Transfor...Neo4j
Leonard Jayamohan, Partner & Generative AI Lead, Deloitte
This keynote will reveal how Deloitte leverages Neo4j’s graph power for groundbreaking digital twin solutions, achieving a staggering 100x performance boost. Discover the essential role knowledge graphs play in successful generative AI implementations. Plus, get an exclusive look at an innovative Neo4j + Generative AI solution Deloitte is developing in-house.
Maruthi Prithivirajan, Head of ASEAN & IN Solution Architecture, Neo4j
Get an inside look at the latest Neo4j innovations that enable relationship-driven intelligence at scale. Learn more about the newest cloud integrations and product enhancements that make Neo4j an essential choice for developers building apps with interconnected data and generative AI.
GraphSummit Singapore | The Art of the Possible with Graph - Q2 2024Neo4j
Neha Bajwa, Vice President of Product Marketing, Neo4j
Join us as we explore breakthrough innovations enabled by interconnected data and AI. Discover firsthand how organizations use relationships in data to uncover contextual insights and solve our most pressing challenges – from optimizing supply chains, detecting fraud, and improving customer experiences to accelerating drug discoveries.
Unlocking Productivity: Leveraging the Potential of Copilot in Microsoft 365, a presentation by Christoforos Vlachos, Senior Solutions Manager – Modern Workplace, Uni Systems
2. Learning Objectives
• Learn the theory and method of use of the
seven tools of quality needed in process
analysis and problem-solving techniques
• Seven tools of quality
• Pareto charts
• Flow charts
• Cause-and-effect diagram
• Check sheet
• Histograms
• Control charts
• Scatter diagrams
3. Pareto Chart
• Method of prioritizing problems or causes
by frequency of occurrence or cost
• Based in the 80-20 rule:
• 80% of the problem is caused by 20% of the
sources
• “Vital few” and “trivial many”
• Depicted by a vertical bar graph arranged from
left to right descending order
4. Advantages of a Pareto Chart
• Focuses efforts on problems with greatest
potential for improvement
• Distinguishes the critical causes from the less
significant causes
• Helps prevent “shifting the problem” where the
solution removes some causes but worsens
others
5. Advantages of a Pareto Chart (cont.)
• Measure the impact of improvement projects
when comparing charts “before” and “after”
• The chart shows the relative importance of
problems in a simple, quickly interpreted,
visual format.
• Progress is measured in a highly visible format
that provides incentive to push on for more
improvement.
6. Steps to Build a Pareto Chart
• Identify problem
• Choose categories that will be monitored
• Choose the most meaningful unit of measurement
• Frequency
• Cost
• Determine time period
• Long enough to represent situation
• Scheduled time to collect data is typical of a workday
7. Steps to Build a Pareto Chart (cont.)
• Collect data
• Compare the frequency of each category
• Draw chart:
• List the categories on the horizontal line
• Descending order, from left to right
• Frequencies on the vertical line
8. Steps to Build a Pareto Chart (cont.)
• Draw the cumulative percentage line showing
categories contribution
• Optional
• Draw vertical line on the right side of the chart
• Plot cumulative values from left to right
• Interpret results
• Tallest bar represents biggest contributor
• Perform analysis of category that has the “most
impact”
9. Cum %
Example of a Pareto Chart 100 %
97%
91%
79%
61%
Frequency
30 50 %
35%
20
24
10 18
12
8
4 2
0
Late Wrong Missing Dam aged Wrong Not received
delivery product parts container address
Delivery complains
10. Further analysis using Pareto charts
• Major cause breakdown:
• Tallest bar is broken down into sub-causes
30
20
24
10 18
12
8
4 2
0
Late delivery Wrong product Missing parts Dam aged Wrong Not received
container address
8
6
4
8
6 4 4
2
2
0
Missing address Driver mistake Late Transportation Administrative
documentation problems delays
Late delivery
11. Further analysis using Pareto charts
•Before and after:
• New Pareto bars are drawn side-by-side
with the original Pareto showing effect of change
25
24
20
18
15
12
10
10 10
8 8
5
4 4
3 2 1
0
Late Wrong Missing Dam aged Wrong Not
delivery product parts container address received
Before After
12. Further analysis using Pareto charts
•Change measurement scale:
• Same categories are used but measured
differently. Typically cost and frequency.
• This exercise defines the category of “most impact”.
$3,000
30
$2,500
25
$2,000
20
$1,500
15 $ 2 , 50 0
24
$1,000 $1, 8 50
10 18
$ 1, 2 0 0
12 $500
5 8
$8 0 0
4 $2 2 0 $2 0 0
2 $0
0
Late Wrong Missing Dam aged Wrong Not received Wrong product Not received Missing parts Wrong Damaged Late delivery
delivery product parts container address address container
Delivery com plains Cost/month
13. Flow Charts
• Pictorial representation of the steps and decision
points in a process.
• Flow charts are used to identify the actual path
of a product or service.
• Flow charts show:
• Sequential work activities
• Inputs for each action
• Outputs from each activity
14. Advantages of a Flow Chart
• Provide common understanding of how a
process works.
• Identifies problem areas, unexpected complexity,
redundancies, and areas of potential improvement
• Serves as a training aid
• Provides basis for documentation.
• Identifies location where additional data can be
collected and investigated
15. Symbols of a Flow Chart
Shows an activity performed in the process
Shows a point in the process where a Yes/No
question is being asked or a decision is required
Identifies a break in the flow chart and is continued
A elsewhere on the same page or another page
Shows the flow of the process
Shows the beginning and end process
16. Steps to Build a Flow Chart
• List the basic steps of the process.
• Determine the logical sequence of the steps.
• Identify the inputs of each step.
• Determine the outputs of each step.
• Draw the chart using the symbols to show the
actions and decisions.
17. Example of a Flow Chart
Team is given task
to write procedure Review
draft
yes Complete Send to
Develop Draft
Final Release
outline approved
version Dept.
No
Complete Revise Draft Release
draft with changes procedure
18.
19. Cause and Effect Analysis
• Pictorial representation of all possible causes
contributing to a problem.
• Developed by Dr.Kaoru Ishikawa
•Also known as “Fishbone” or “Ishikawa” diagrams
20. Advantages of a Cause and Effect Diagram
• Clearly illustrates the various causes affecting a
process:
• Relationship between these causes
• Where are they occurring
• Helps in finding the most basic cause of the
problem
• Motivates team members participation
21. Steps to Build a Cause and Effect Diagram
• Place problem statement in a box to the right-hand
side of the paper.
• Select the major cause or categories and place them
to the left of the problem statement.
• 4 M’s (Production process):
• Materials
• Manpower
• Machinery/equipment
• Method
• 4 P’s (Service process):
• Policies
• Procedures
• People
• Plant / equipment
22. Steps to Build a Cause and Effect Diagram
(cont.)
• Draw a box around each category and connect
to a line pointing out towards the problem statement.
• Using the brainstorming technique, generate ideas
of causes, on the major categories.
• Record these ideas on a line off the applicable
major category line.
23. Steps to Build a Cause and Effect Diagram
(cont.)
• For each cause listed on the diagram, ask “why
does this happen?”.
• For each response, ask the same question.
• Each successive answer is another possible cause
• Look for causes that repeat across major cause
categories.
• Ensure all team members agree on the problem
and causes statements.
24. Example of a Cause and Effect Diagram
Machinery/equipment Manpower
Drivers don’t
Unreliable trucks Show up
Drivers get lost
Not enough trucks
Wrong address
Not capacity for on shipper
peak periods
Database Input error
Late deliveries
Poor dispatching Run out of
products
Poor handling of Poor planning
large orders
Lack of
Lack of training
training
Method Material
25.
26. Check Sheets
• Tool used to record and compile frequency of
observations as they occur
• Used for Pareto charts and histograms
• Design varies depending on information needed
27. Advantages of a Check Sheet
• Patterns of information are clearly detected
and shown
• Easy-to-understand data from a simple process
• Based on facts, not opinions
• Forces agreement on the definition of each
condition
28. Steps to Build a Check Sheet
• Agree on the definition of the events or conditions
to observe.
• Decide who will collect the data.
• Determine the time period.
• Design a check sheet form that is clear and
easy to use.
• Define Source of information.
• Determine Content of information.
• Collect data consistently and accurately.
29. Example of a Check Sheet
Project: Defects on fastener installation Performed by: John Doe
Location: Cost Center 727 Reason: Defect reduction
Time period: W/E 4/23/04
Type of defects 4/19 4/20 4/21 4/22 4/23 Total
Gapped fasteners 15 15 12 10 14 66
Missing fasteners 3 0 0 1 1 5
Damaged fasteners 8 3 12 8 4 35
Defective fasteners 12 3 5 3 6 29
Total 38 21 29 22 25 135
30. Histograms
• Graphical representations of the frequency
distribution of data in bar form.
• Summarizes data from a process that has been
collected over a period of time
• Provide a quick representation of the “spread”
and “centering” of a process
31. • Histogram Defined
– A histogram is a bar graph that shows
frequency data.
– Histograms provide the easiest way to evaluate
the distribution of data.
32. Advantages of a Histogram
• Display large amounts of data that are difficult
to interpret in a tabular form
• Show the relative frequency of occurrences of the
various data values
• Reveal the variation, centering, and distribution
shape of the data
• Very useful when calculating capability of a process
• Helps predict future performance of a process
33. Steps to Build a Histogram
• Collect data for analysis.
• At least 50 to 100 data points
• Use historical data to find patterns or to use as
a baseline for past performance
• Determine the range of the data set.
• Smallest value subtracted from largest value
• Determine quantity of categories.
• Take the square root of total number of data
points and round to nearest whole number
34. Steps to Build a Histogram (cont.)
• Determine each category’s data point.
• Mid-point of each category
• Plot data on a vertical bar-graph.
• Frequency on Y-axis
• Categories on X-axis
• For each class interval, draw bar with the
the height equal to frequency count
36. Control Charts
• Line graph of measurements of a process overtime
that has statistically based control limits placed on it
• Process control charts monitor and display variations
in a process output.
• Control limits are based on process variation
• Define expected variation range due to common causes
• +/- three standard deviations from centerline
• Centerline represents the average of all
measurements used
37. Types of Control Charts
• Two primary types are:
• Control charts for variables:
• Most used: X –R
• X is average values
• R is range
• Others: Run charts, moving range charts (MX –MR charts)
• Control charts for attributes:
• p chart: fraction defective
• np chart: number of defectives
• c chart: number of defects
38. Advantages of Control Charts
• Focuses attention on detecting and monitoring
process variation over time
• Distinguishes “special” from “common” causes
• Helps predict performance of a process
• Helps improve a process to perform consistently
• Provides a common language to discuss process
behavior
39. Steps to Build a Control Chart
• Select the process to be charted.
• Determine type of chart.
• Determine sampling method and plan.
• Initiate data collection.
• Calculate control limits and centerline.
• Build the control chart.
• Plot data.
• Interpret results.
40. Example of a Control Chart Point out-of-control
(out of the control limits boundaries)
Data plot
Upper control limit
3 std.deviations
Centerline
3 std.deviations
Lower control limit
41. Scatter Diagrams
• Chart used to identify the possible relationship
between two process characteristics
• Advantages of the scatter diagram
• Provides visual and statistical means to test the
strength of a potential relationship
• Provides a good follow-up to the cause and effect
diagram to find out if there is a connection between
the cause and the effect
42. Steps to Build a Scatter Diagram
• Collect 50 – 100 paired samples of data.
• Construct a data sheet.
• Draw the Y-axis and the X-axis of the diagram.
• Plot the data on the diagram.
43. Example of a Scatter Diagram
Variable 2
Variable 1
44. Summary
• The seven tools of quality discussed in this module
are considered to make up the fundamental
continuous improvement toolkit.
• It is the intent of this course to touch basis on these
tools and not to study them in depth.
• Depth analysis of these theories is considered subject
for another course.
45. RUN CHARTS
• Run Charts Defined
– Run charts are used to
analyze processes
according to time or
order.
46. RUN CHARTS
• Creating a Run Chart
– Gathering Data
• Some type of process or operation must be available to take
measurements for analysis.
– Organizing Data
• Data must be divided into two sets of values X and Y. X values represent
time and values of Y represent the measurements taken from the
manufacturing process or operation.
– Charting Data
• Plot the Y values versus the X values.
– Interpreting Data
• Interpret the data and draw any conclusions that will be beneficial to the
process or operation.
47. RUN CHART
• An Example of Using a
Run Chart
– An organization’s desire is
to have their product arrive
to their customers on time,
but they have noticed that it
doesn’t take the same
amount of time each day of
the week. They decided to
monitor the amount of time
it takes to deliver their
product over the next few
weeks.
Editor's Notes
It motivates team members participation.
Example of a Scatter Diagram The scatter diagram shows that variable 1 increases as variable 2 increases. This is a case of a positive relationship. In the event that variable 1 decreases as variable 2 increases, then both variables have a negative relationship. The same is true if variable 1 increases as variable 2 decreases.