Download to read offline


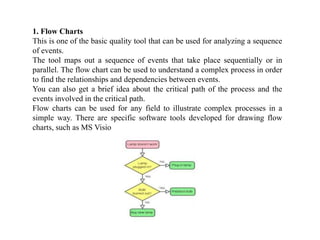
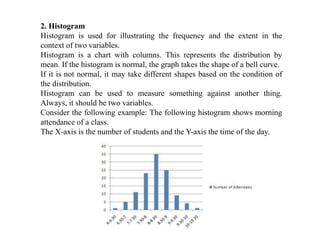
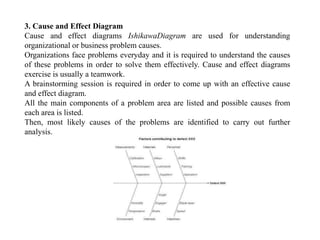
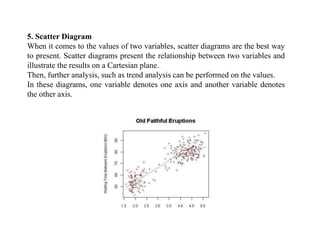
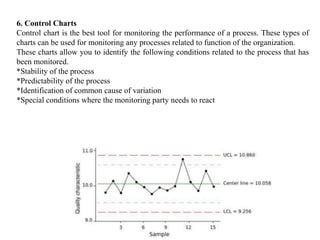
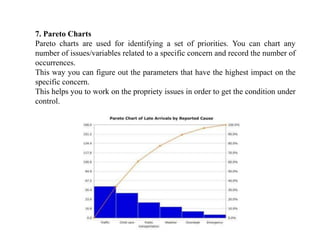


This document discusses 7 basic quality tools: 1. Flow charts map out sequential or parallel processes to understand relationships. 2. Histograms illustrate the frequency and distribution of two variables using columns. 3. Cause and effect diagrams identify organizational problem causes through team brainstorming. 4. Check sheets gather and organize data that can then be analyzed in software like Excel. 5. Scatter diagrams present the relationship between two variables on a Cartesian plane. 6. Control charts monitor process performance to identify stability, predictability, and special conditions. 7. Pareto charts identify priority issues by recording the number of occurrences.