Downloaded 107 times


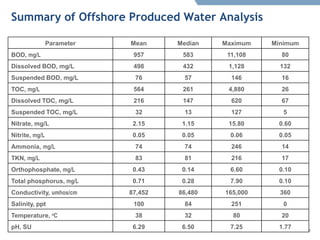


Offshore oil and gas production in the Gulf of Mexico generates large volumes of produced water. Nearly 91% of the 587,353 barrels per day of produced water from offshore wells is treated on platforms and discharged into the ocean, as regulated by NPDES permits. A variety of physical, chemical, and biological treatment technologies are used to clean produced water before discharge to meet permit limits for oil and grease.


![OVERVIEW OF THE OIL & GAS EXPLORATION AND [Autosaved]](https://cdn.slidesharecdn.com/ss_thumbnails/f980b2ed-b37b-4c91-b049-14cec3820fe3-150826222206-lva1-app6891-thumbnail.jpg?width=640&height=640&fit=bounds)


