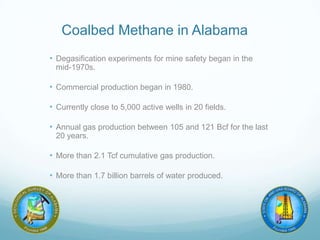
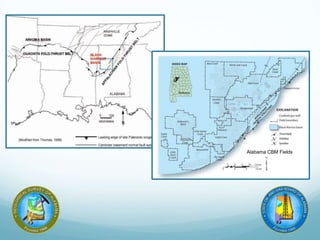
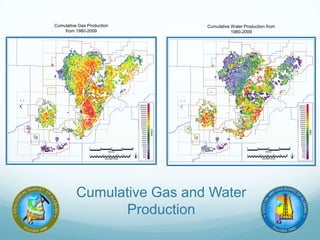
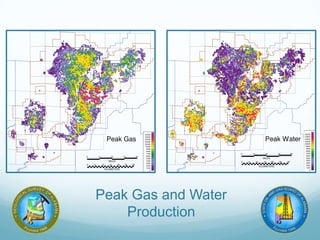
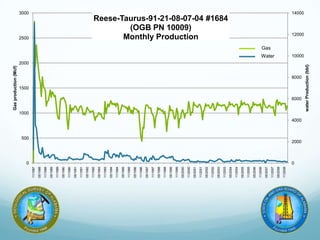
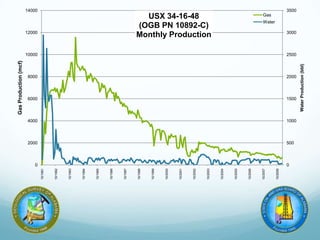
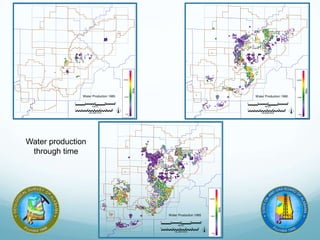
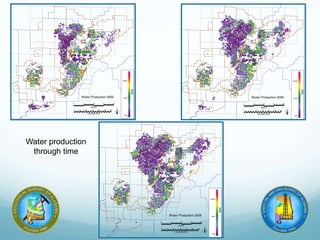
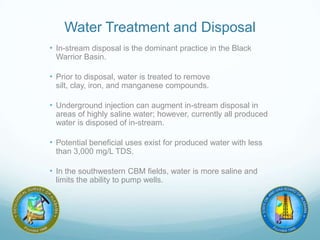
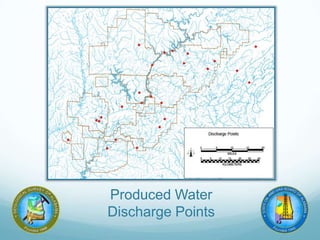
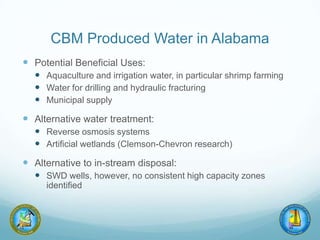
Characteristics of Coalbed
Methane Produced Water in
Alabama
Nick Tew
Alabama State Geologist/Oil and Gas Board Supervisor
Geological Survey of Alabama
State Oil and Gas Board of Alabama
Atlantic Council
Fossil Fuel Produced Water Workshop
Washington, DC
June 24-25, 2013
Alabama’s Fossil Fuel Energy Endowment
 Coal
 Black Warrior Basin Coal Measures
 Coastal Plain Lignite (low-rank coal)
 Oil
 Conventional
 SW Alabama Oil and Condensate
 Black Warrior Basin Oil
 Unconventional
 Oil Sands of North Alabama
 Oil Shale of North Alabama
 Natural Gas
 Conventional
 SW Alabama
 Black Warrior Basin
 Unconventional
 Coalbed Methane of Black Warrior Basin
 Paleozoic Gas Shales of North Alabama
Geology of
Alabama
Significant Activity Areas
Coalbed Methane in Alabama
• Degasification experiments for mine safety began in the
mid-1970s.
• Commercial production began in 1980.
• Currently close to 5,000 active wells in 20 fields.
• Annual gas production between 105 and 121 Bcf for the last
20 years.
• More than 2.1 Tcf cumulative gas production.
• More than 1.7 billion barrels of water produced.
Alabama CBM Fields
Cumulative Gas Production
from 1980-2009
Cumulative Water Production from
1980-2009
Cumulative Gas and Water
Production
Development and Production
• Drilling and hydraulic fracturing currently uses “city” water
• Usually trucked to location
• Additional water during production is not needed
Co-Produced Water
• CBM production is pressure driven and usually requires
dewatering of coals to lower hydrostatic pressure for gas
production.
• Water production is generally high early in a well’s life and
decreases rapidly.
• Gas production generally peaks in the first few years, after
peak water, then decreases.
• High water production can limit how often and how much a
well can be pumped, limiting gas production.
Peak Gas and Water
Production
0
2000
4000
6000
8000
10000
12000
14000
0
500
1000
1500
2000
2500
3000
11/1987
05/1988
11/1988
05/1989
11/1989
05/1990
11/1990
05/1991
11/1991
05/1992
11/1992
05/1993
11/1993
05/1994
11/1994
05/1995
11/1995
05/1996
11/1996
05/1997
11/1997
05/1998
11/1998
05/1999
11/1999
05/2000
11/2000
05/2001
11/2001
05/2002
11/2002
05/2003
11/2003
05/2004
11/2004
05/2005
11/2005
05/2006
11/2006
05/2007
11/2007
05/2008
11/2008
waterProduction(bbl)
Gasproduction(Mcf)
Reese-Taurus-91-21-08-07-04 #1684
(OGB PN 10009)
Monthly Production
Gas
Water
0
500
1000
1500
2000
2500
3000
3500
0
2000
4000
6000
8000
10000
12000
14000
10/1991
10/1992
10/1993
10/1994
10/1995
10/1996
10/1997
10/1998
10/1999
10/2000
10/2001
10/2002
10/2003
10/2004
10/2005
10/2006
10/2007
10/2008
WaterProduction(bbl)
GasProduction(mcf)
USX 34-16-48
(OGB PN 10892-C)
Monthly Production
Gas
Water
Co-Produced Water
• As new areas of production come on line, water production
is relatively high.
• As an area reaches maturity, the water production will slow
and level off.
• Some areas, with high recharge rates, will continue to
produce significant water volumes over the life of the well.
• In and around mining, where water levels have been drawn
down prior to drilling, wells produce little to no water.
Water production
through time
Water production
through time
Water Treatment and Disposal
• In-stream disposal is the dominant practice in the Black
Warrior Basin.
• Prior to disposal, water is treated to remove
silt, clay, iron, and manganese compounds.
• Underground injection can augment in-stream disposal in
areas of highly saline water; however, currently all produced
water is disposed of in-stream.
• Potential beneficial uses exist for produced water with less
than 3,000 mg/L TDS.
• In the southwestern CBM fields, water is more saline and
limits the ability to pump wells.
Produced Water
Discharge Points
Water Chemistry
 Major constituents:
 Mostly sodium-chloride, some areas are dominated by sodium bicarbonate
waters.
 Generally low in sulfate, magnesium, and calcium.
 Almost all wells exceed secondary drinking water standards for TDS (500
mg/L), but the average well is in a USDW (<10,000 mg/L).
 Average levels of barium, cadmium, fluoride, lead, and thallium
exceeds the drinking water MCL; average levels of zinc and
manganese exceed the secondary drinking water regulations.
CBM Produced Water in Alabama
 Potential Beneficial Uses:
 Aquaculture and irrigation water, in particular shrimp farming
 Water for drilling and hydraulic fracturing
 Municipal supply
 Alternative water treatment:
 Reverse osmosis systems
 Artificial wetlands (Clemson-Chevron research)
 Alternative to in-stream disposal:
 SWD wells, however, no consistent high capacity zones
identified
Acknowledgments
 GSA CBM Produced Water Project funded by the U.S.
Dept. of Energy, Office of Fossil Energy, NETL, DOE
Award Number DE-FE0000888.
 GSA Research Team: Marcella McIntyre-
Redden, Steve Mann, Jack Pashin (now at OK
State), David Kopaska-Merkel, Ashley Williams, and
Mac McKinney.

Produced Water | Session IV - Nick Tew

Editor's Notes

  • #6 Lower-right map’s location is roughly indicated by the blue dashed box in the upper map.
  • #7 Total cumulative gas (Mmcf) and water (bbl) production. Gives sense of scale of the resource and the water disposal issue.
  • #10 Peak gas (mcf/month)and water (bbl/month) production. Peak production is typically within the first few years of a well’s life. Robinson’s Bend and parts of Cedar Cove have high water production and variable gas production. Blue Creek, Deerlick Creek, and White Oak Creek fields have lower water production and generally good gas production.
  • #11 Typical decline curve
  • #12 Typical decline curve
  • #14 Yearly water production – Illustrates the general pattern of lower water production in a well/area over time. Note, Brookwood field is mostly wells in and immediately around the mines where extensive de-watering had already occurred.
  • #17 Processed produced water discharge points. Almost all discharge into the Black Warrior River or one of its tributaries.
  • #19 TDS map, metals trend with TDS.