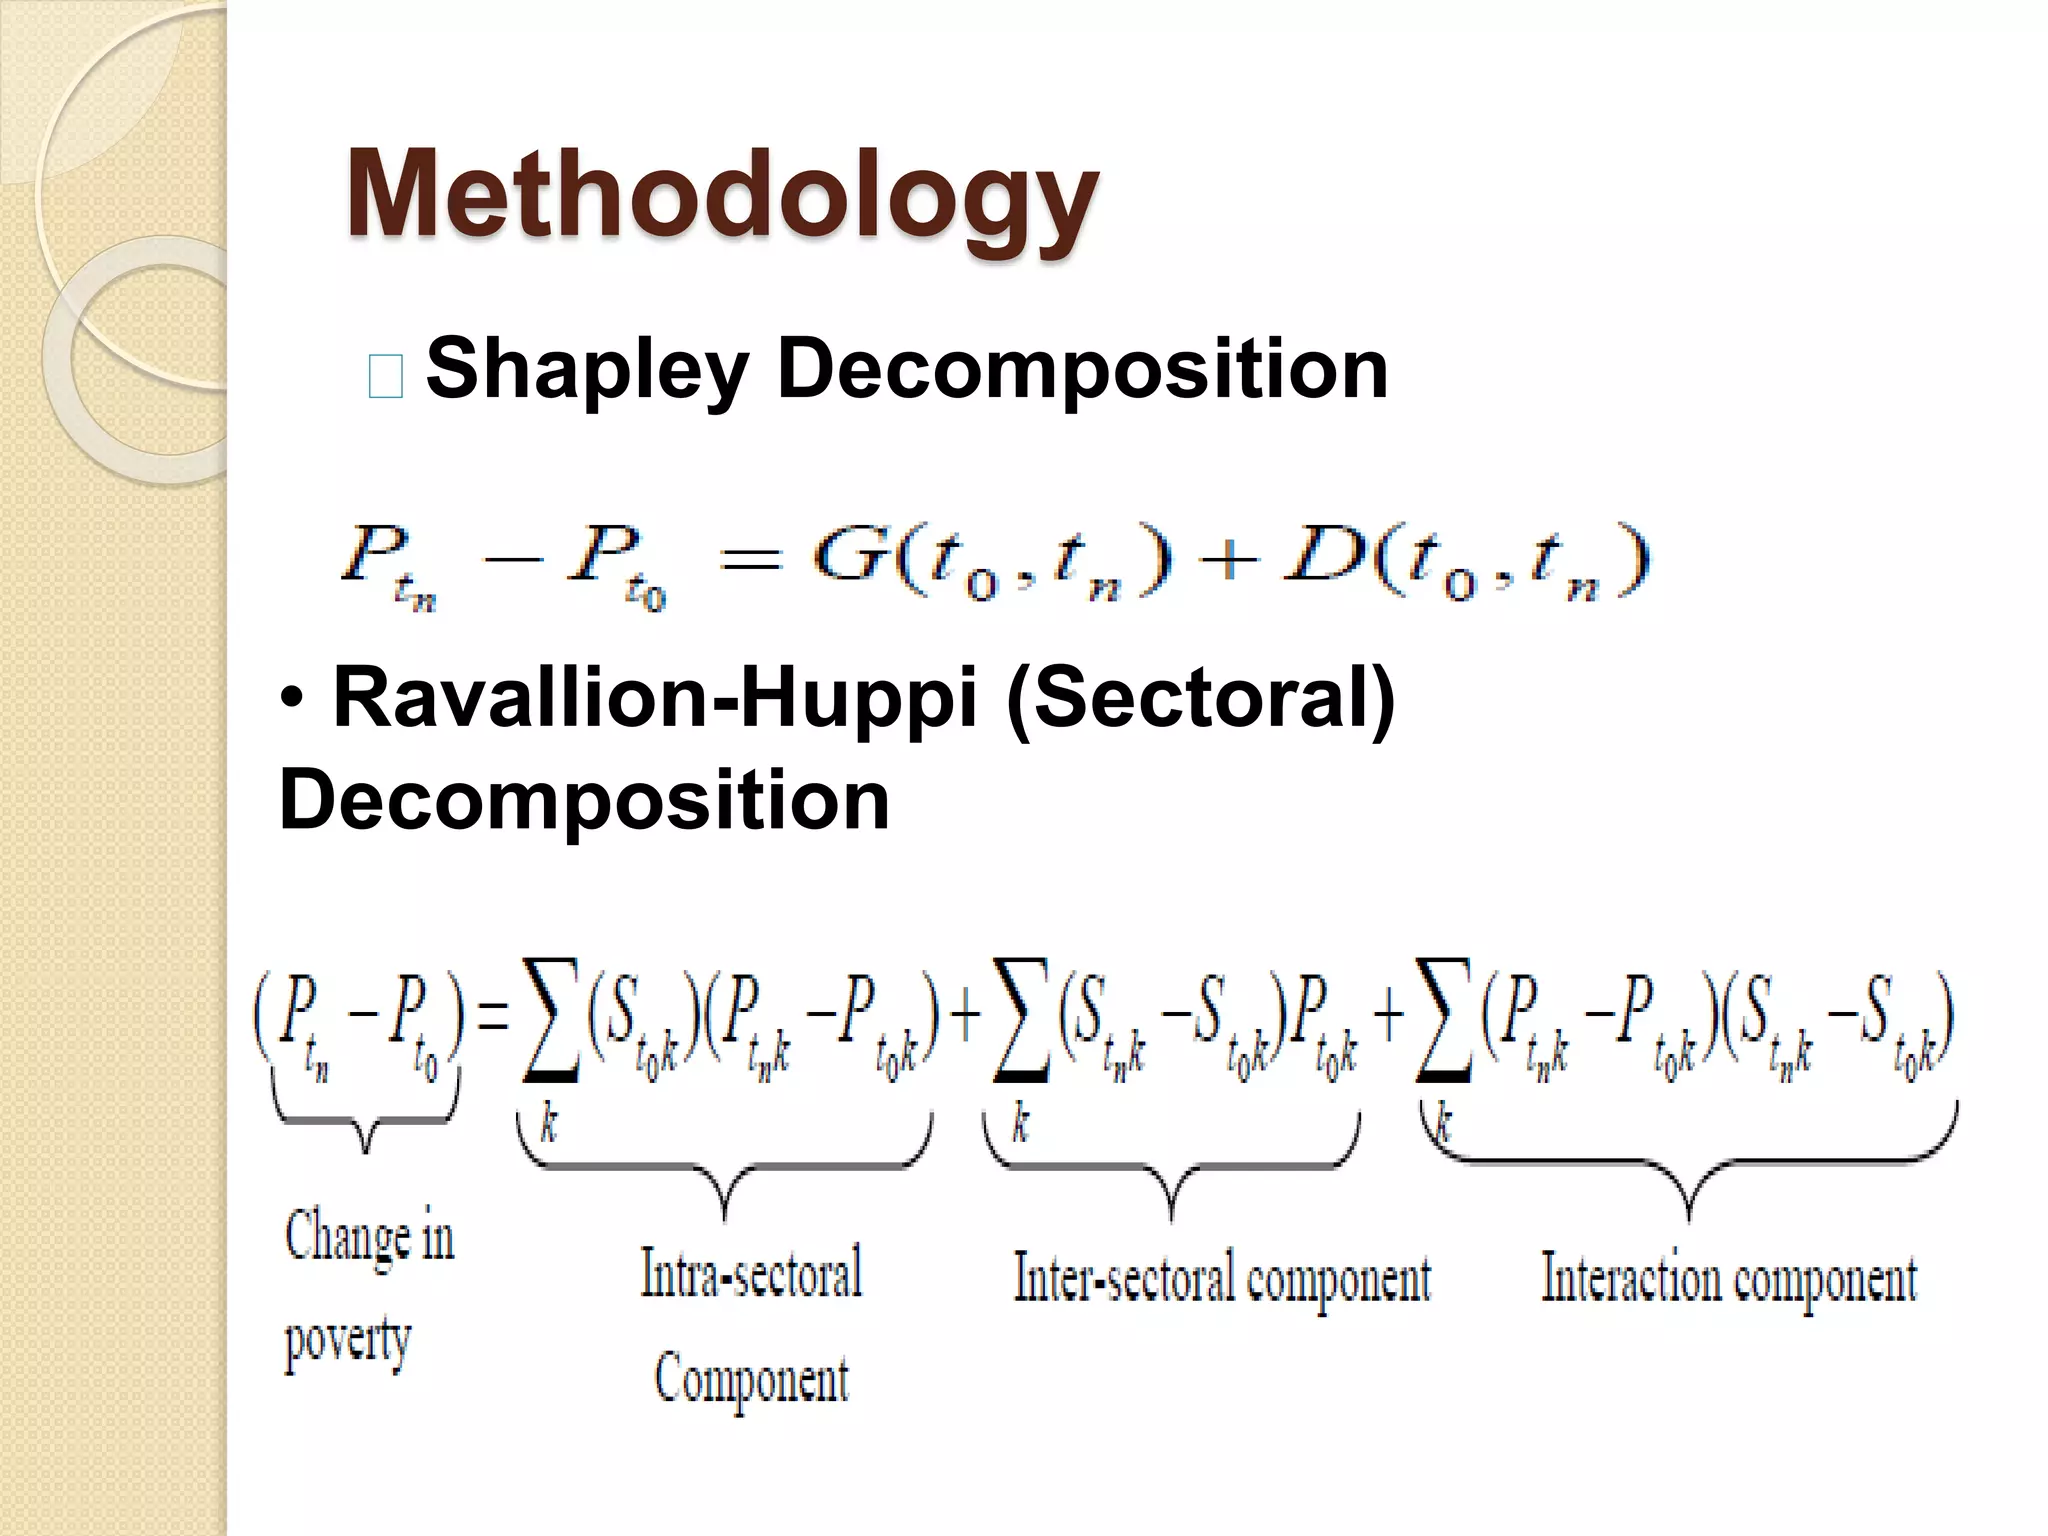
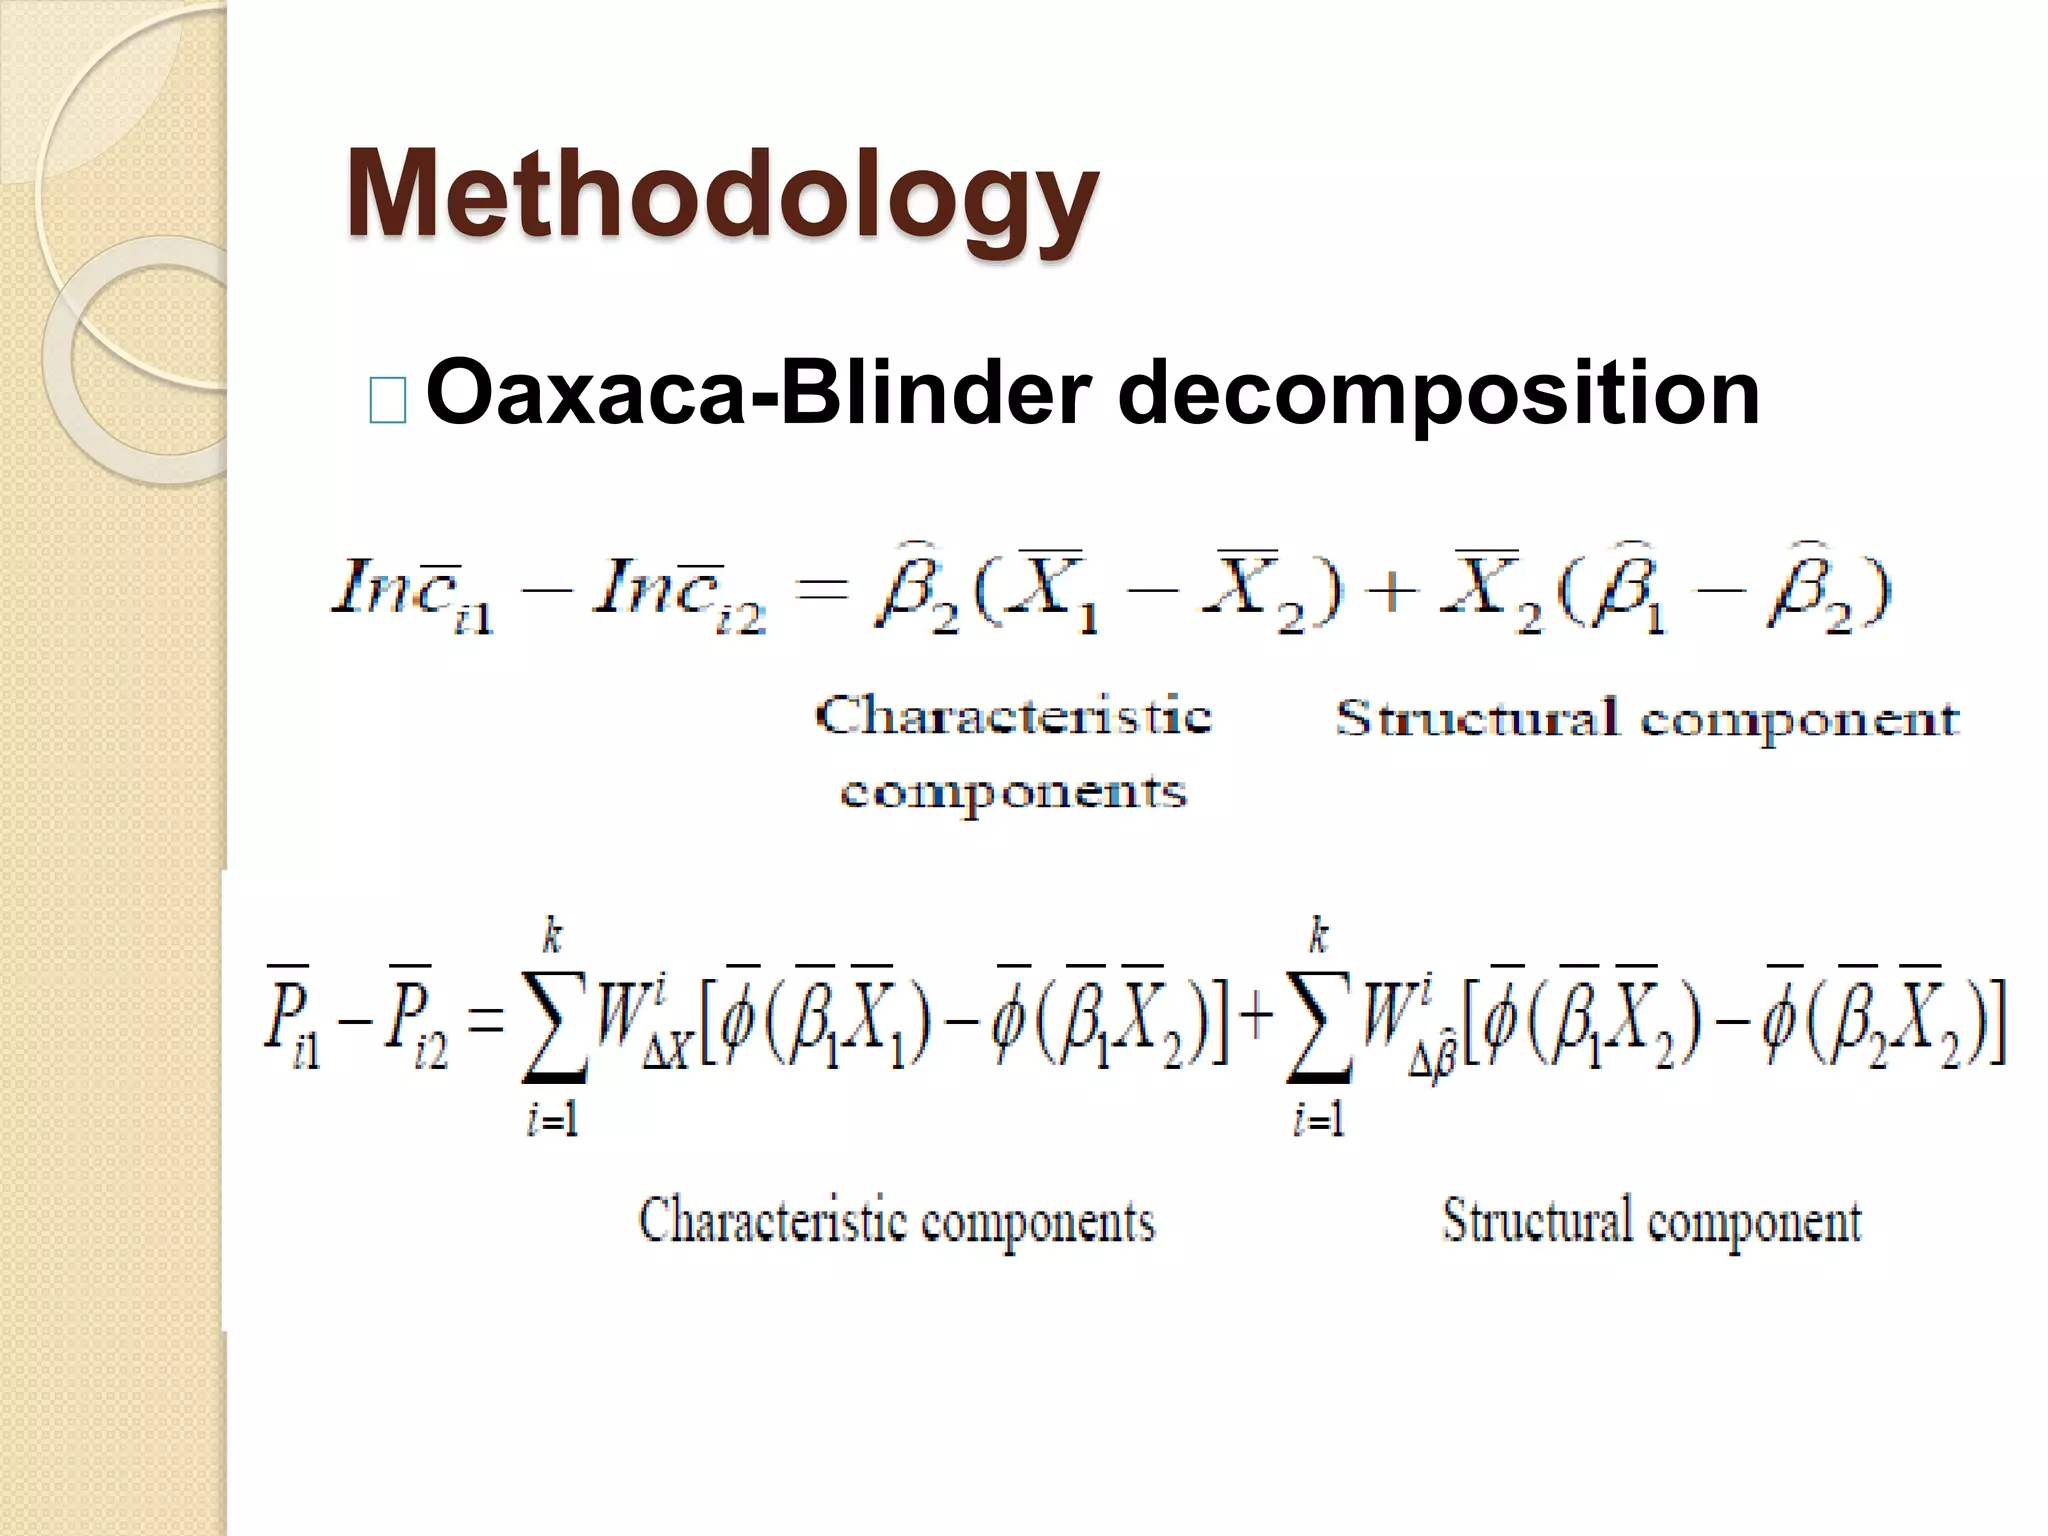
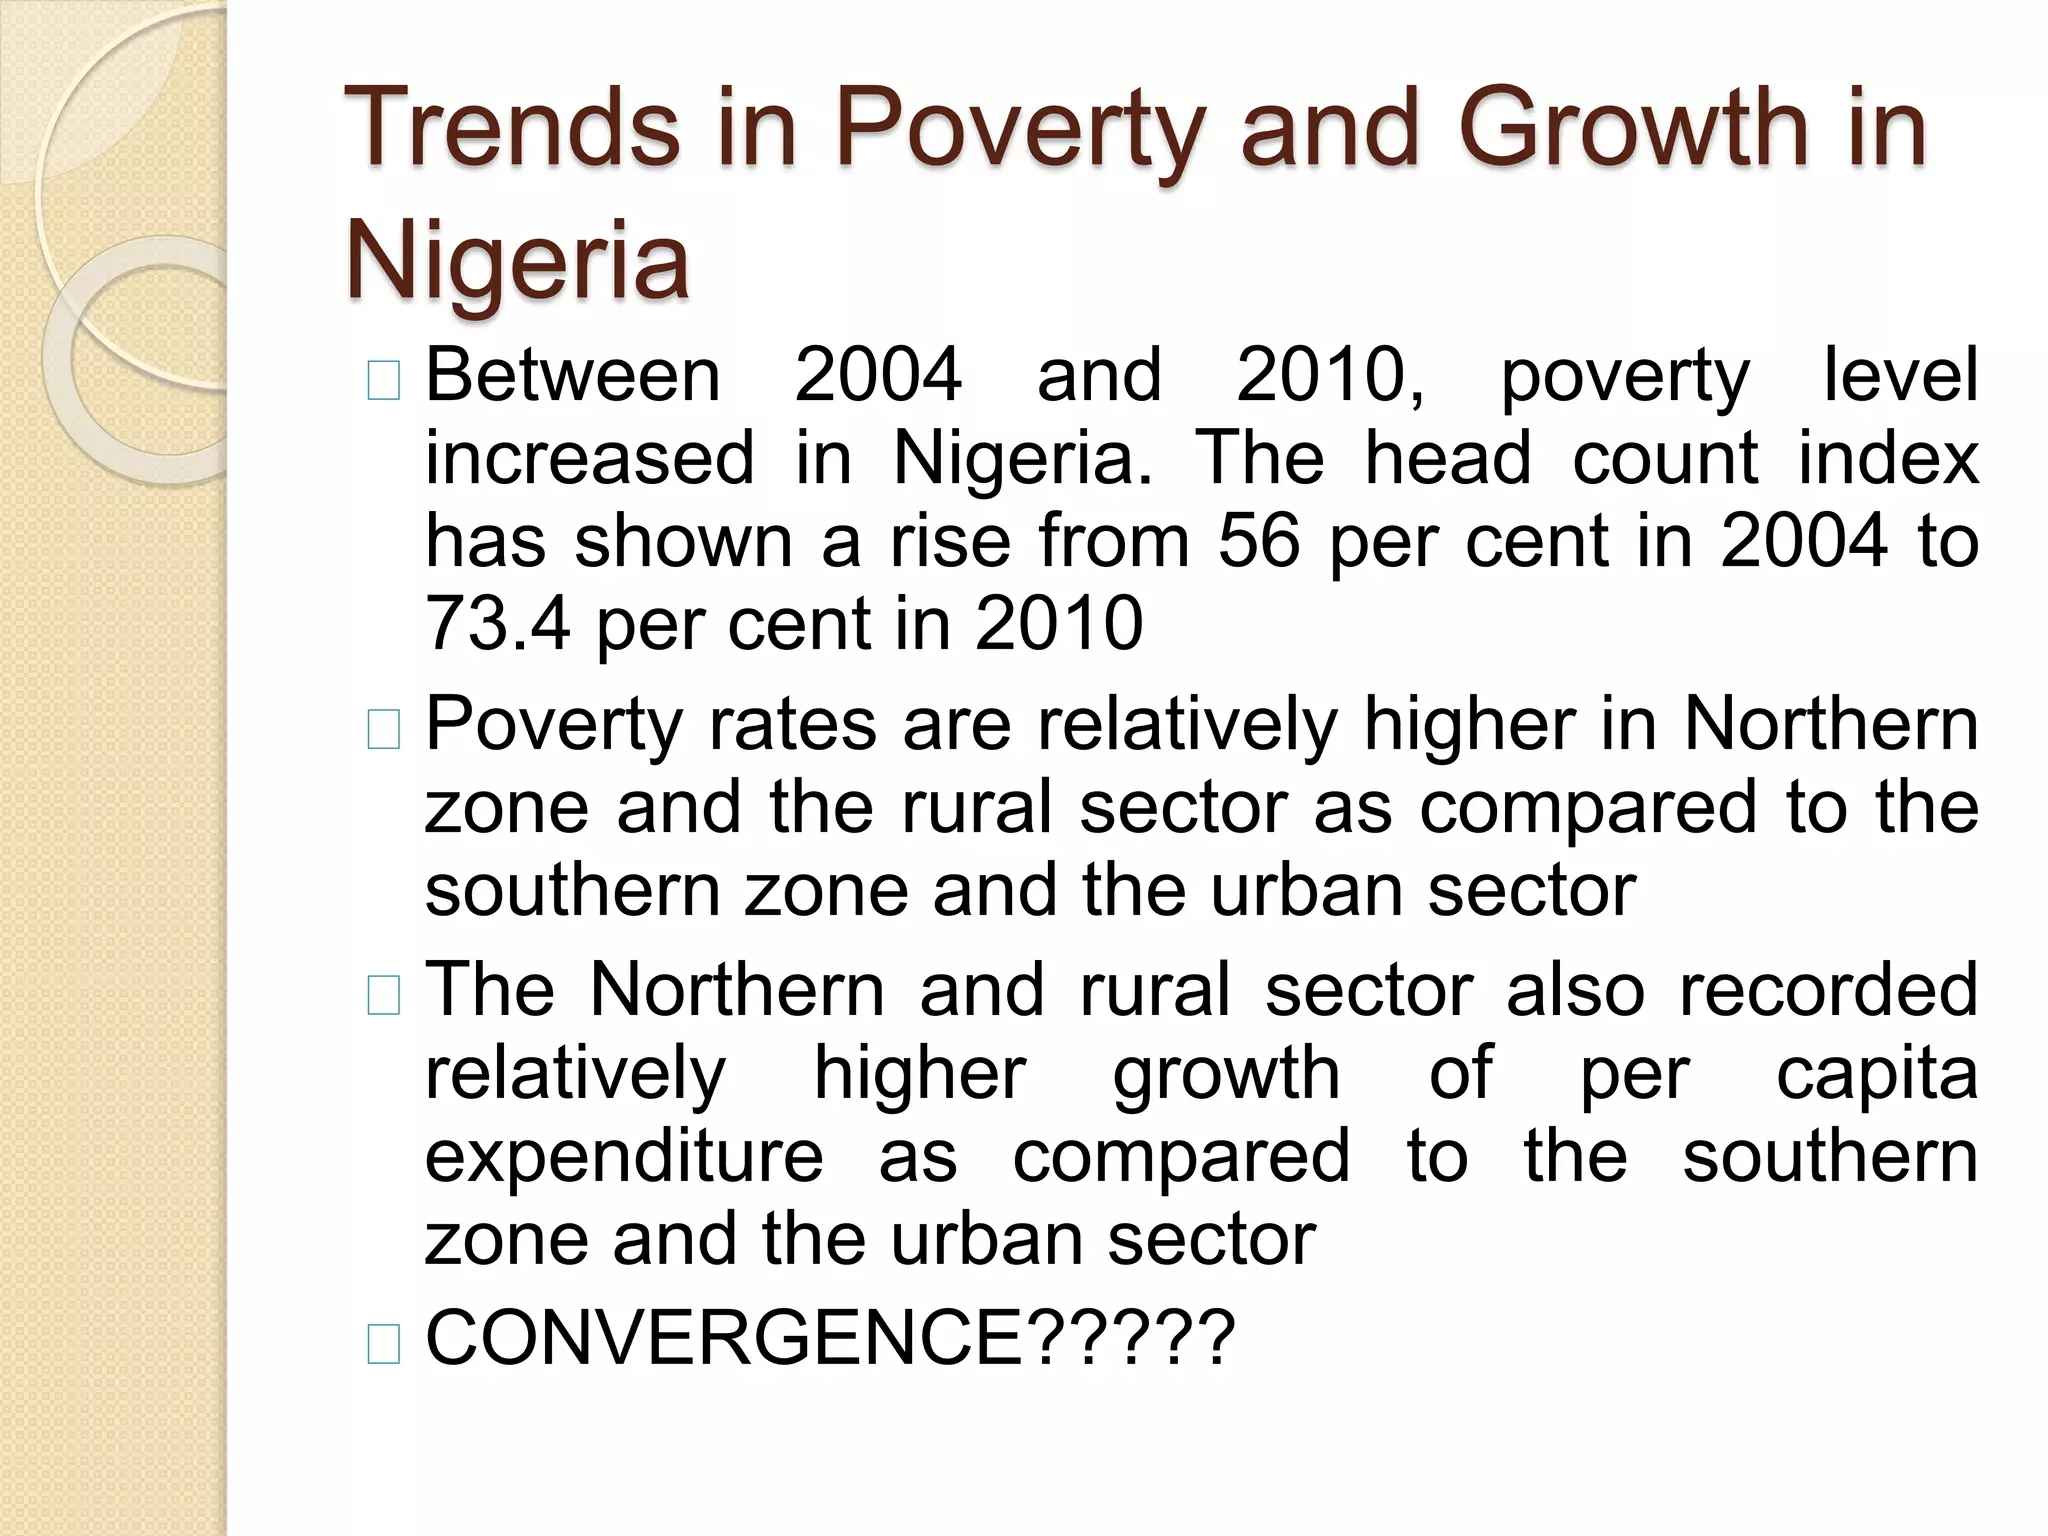
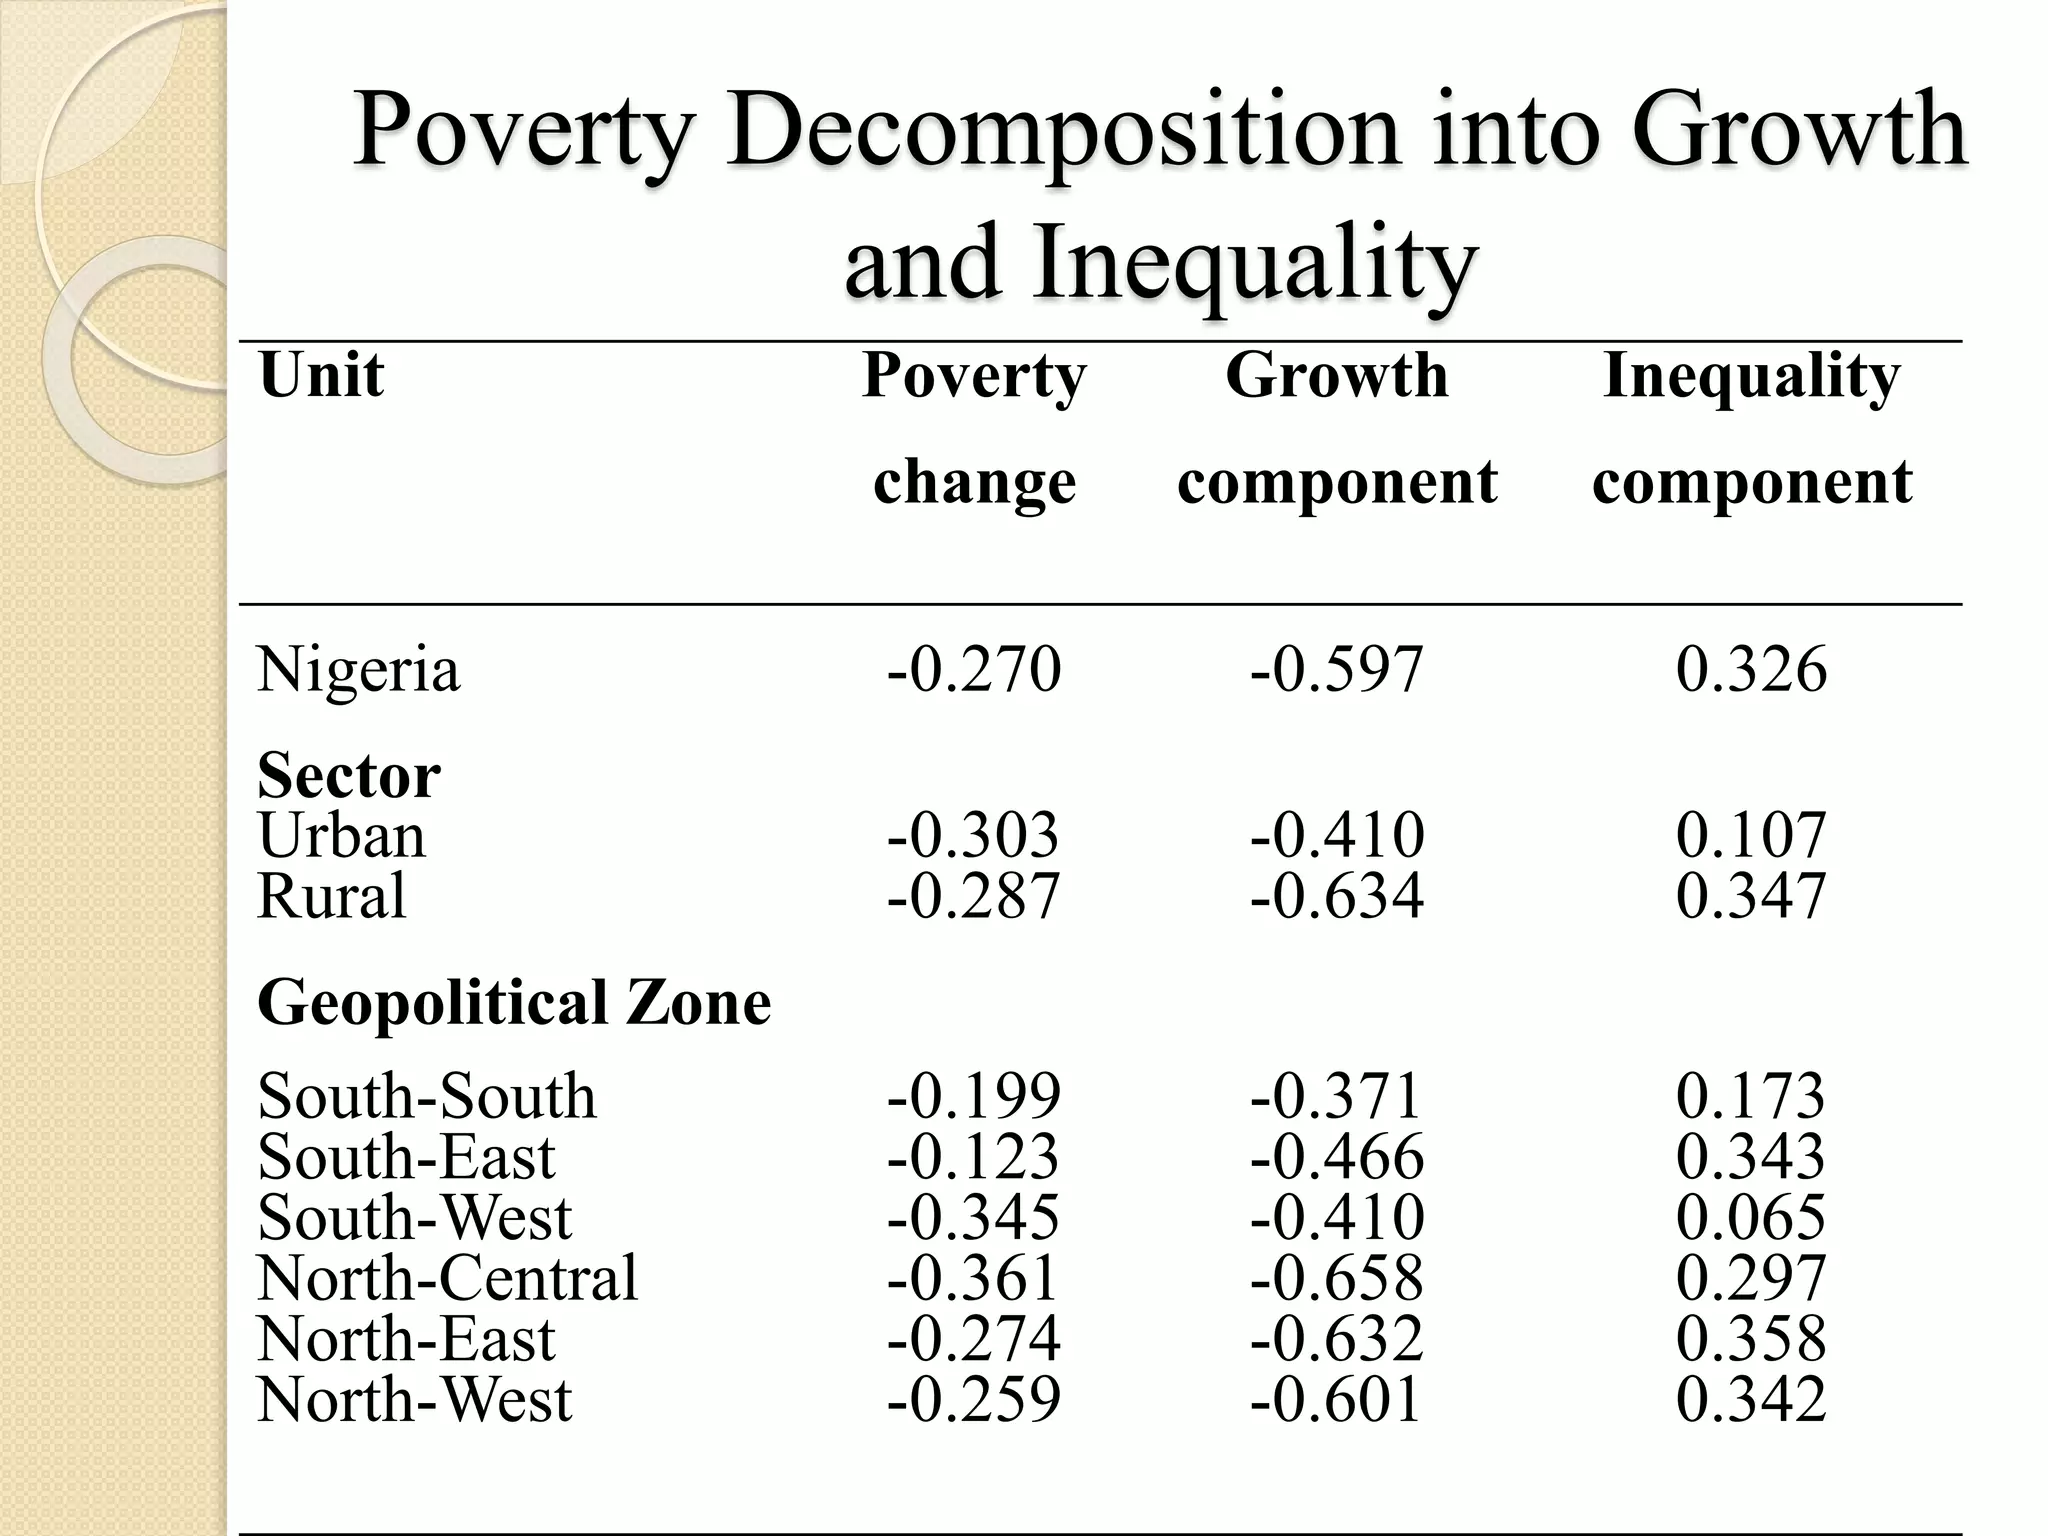
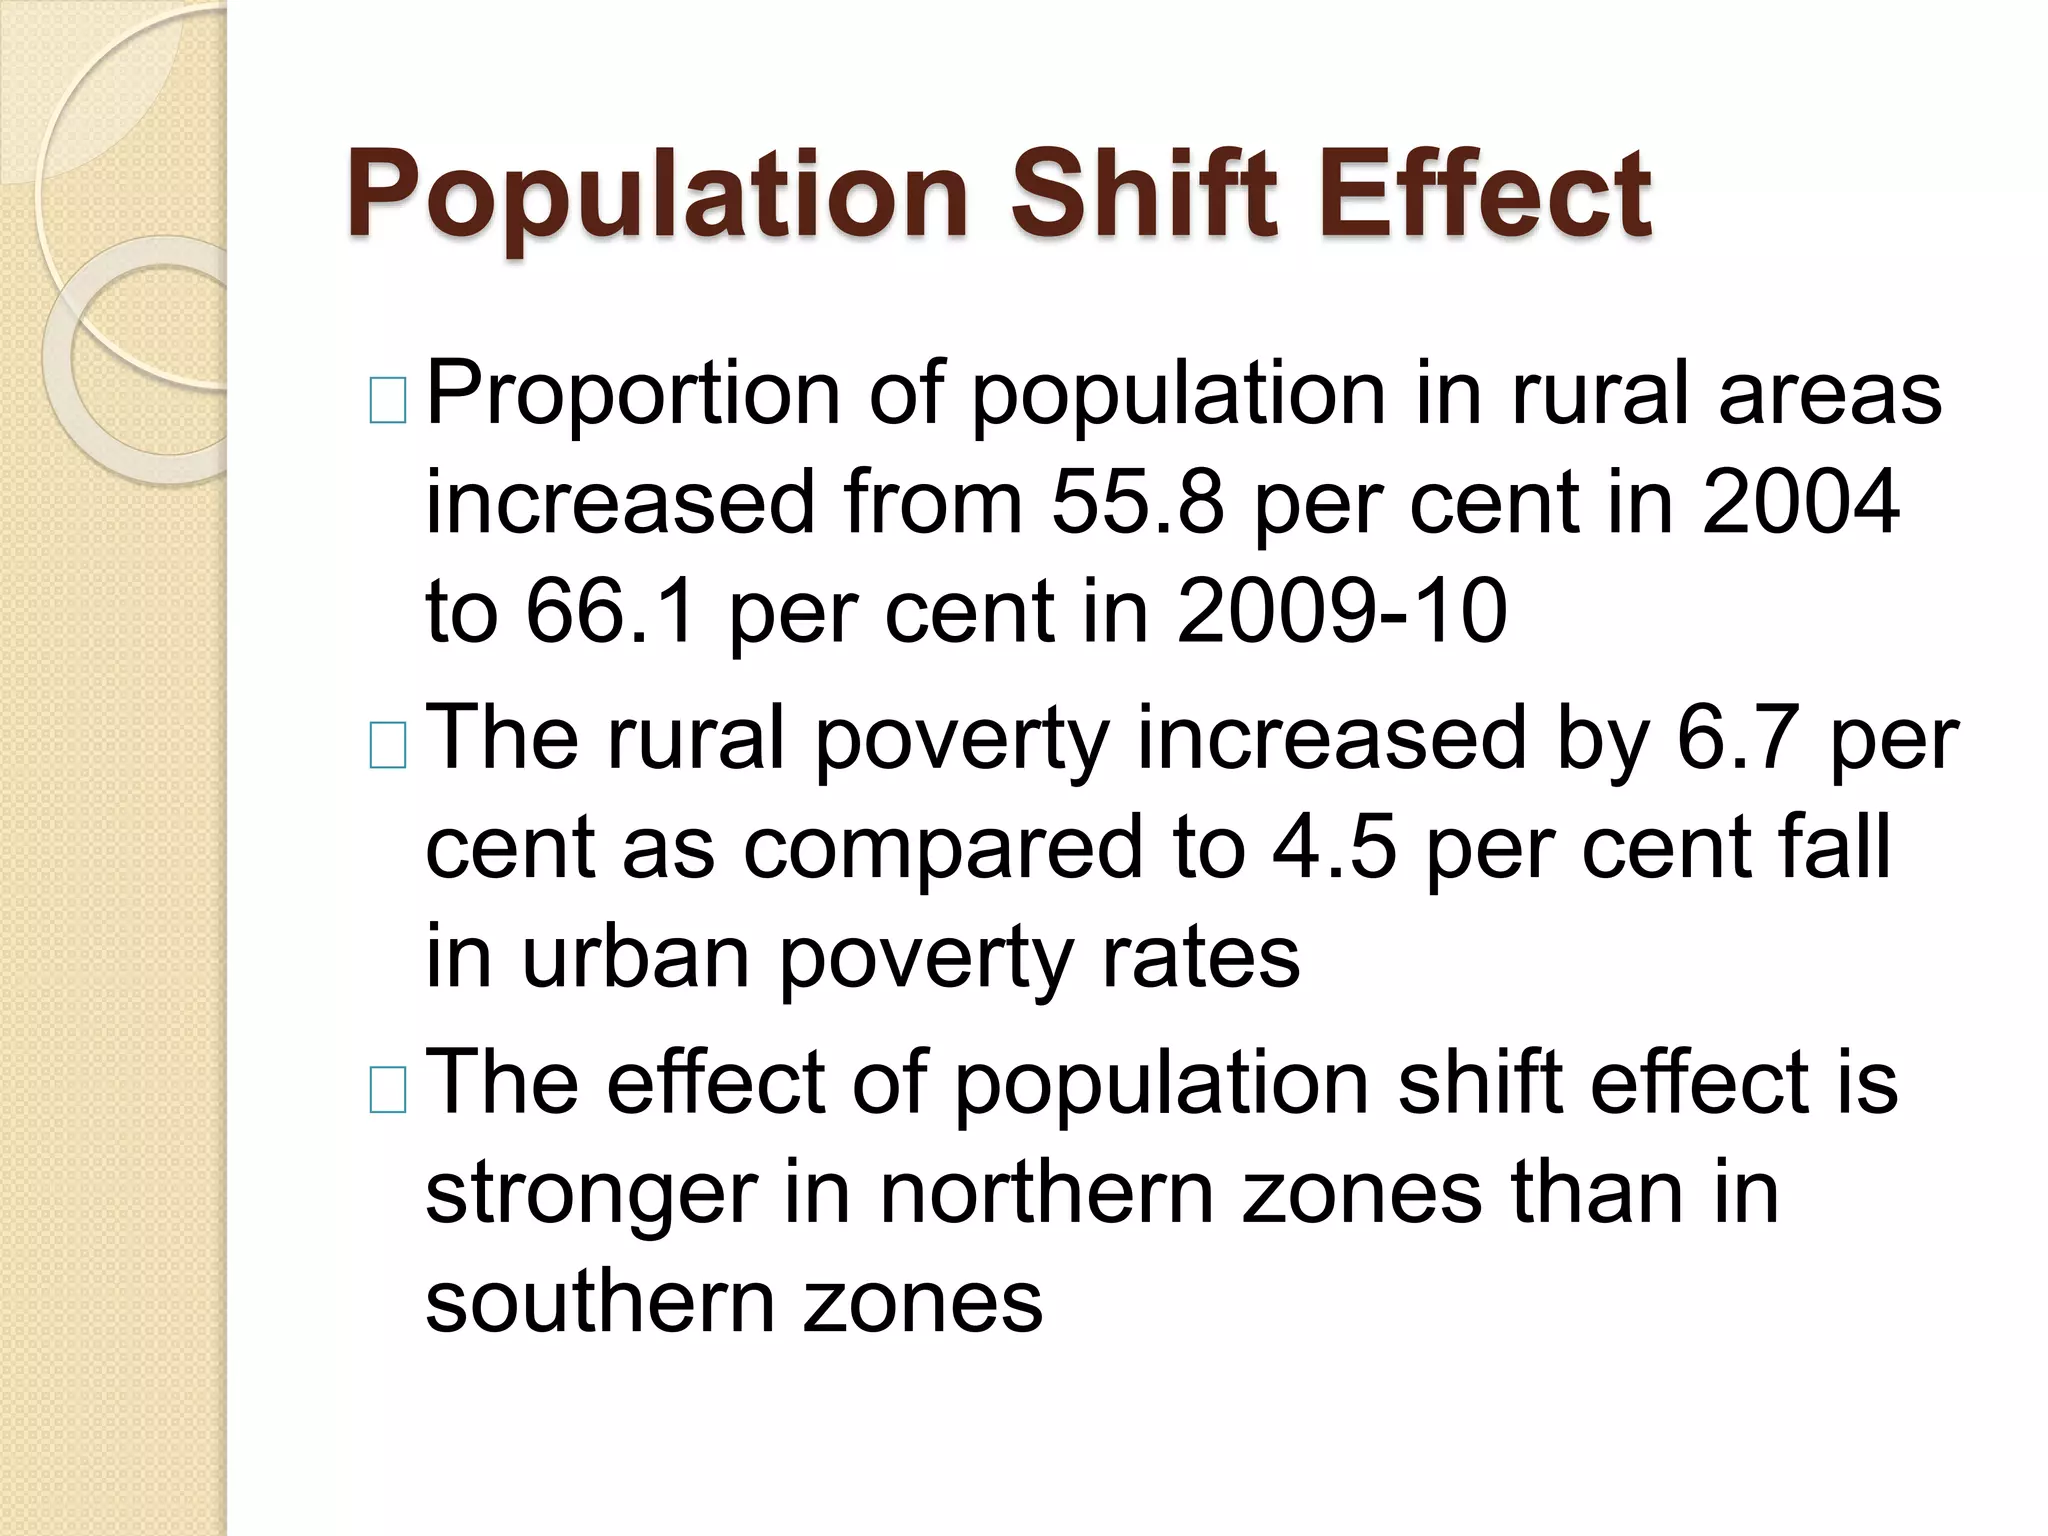
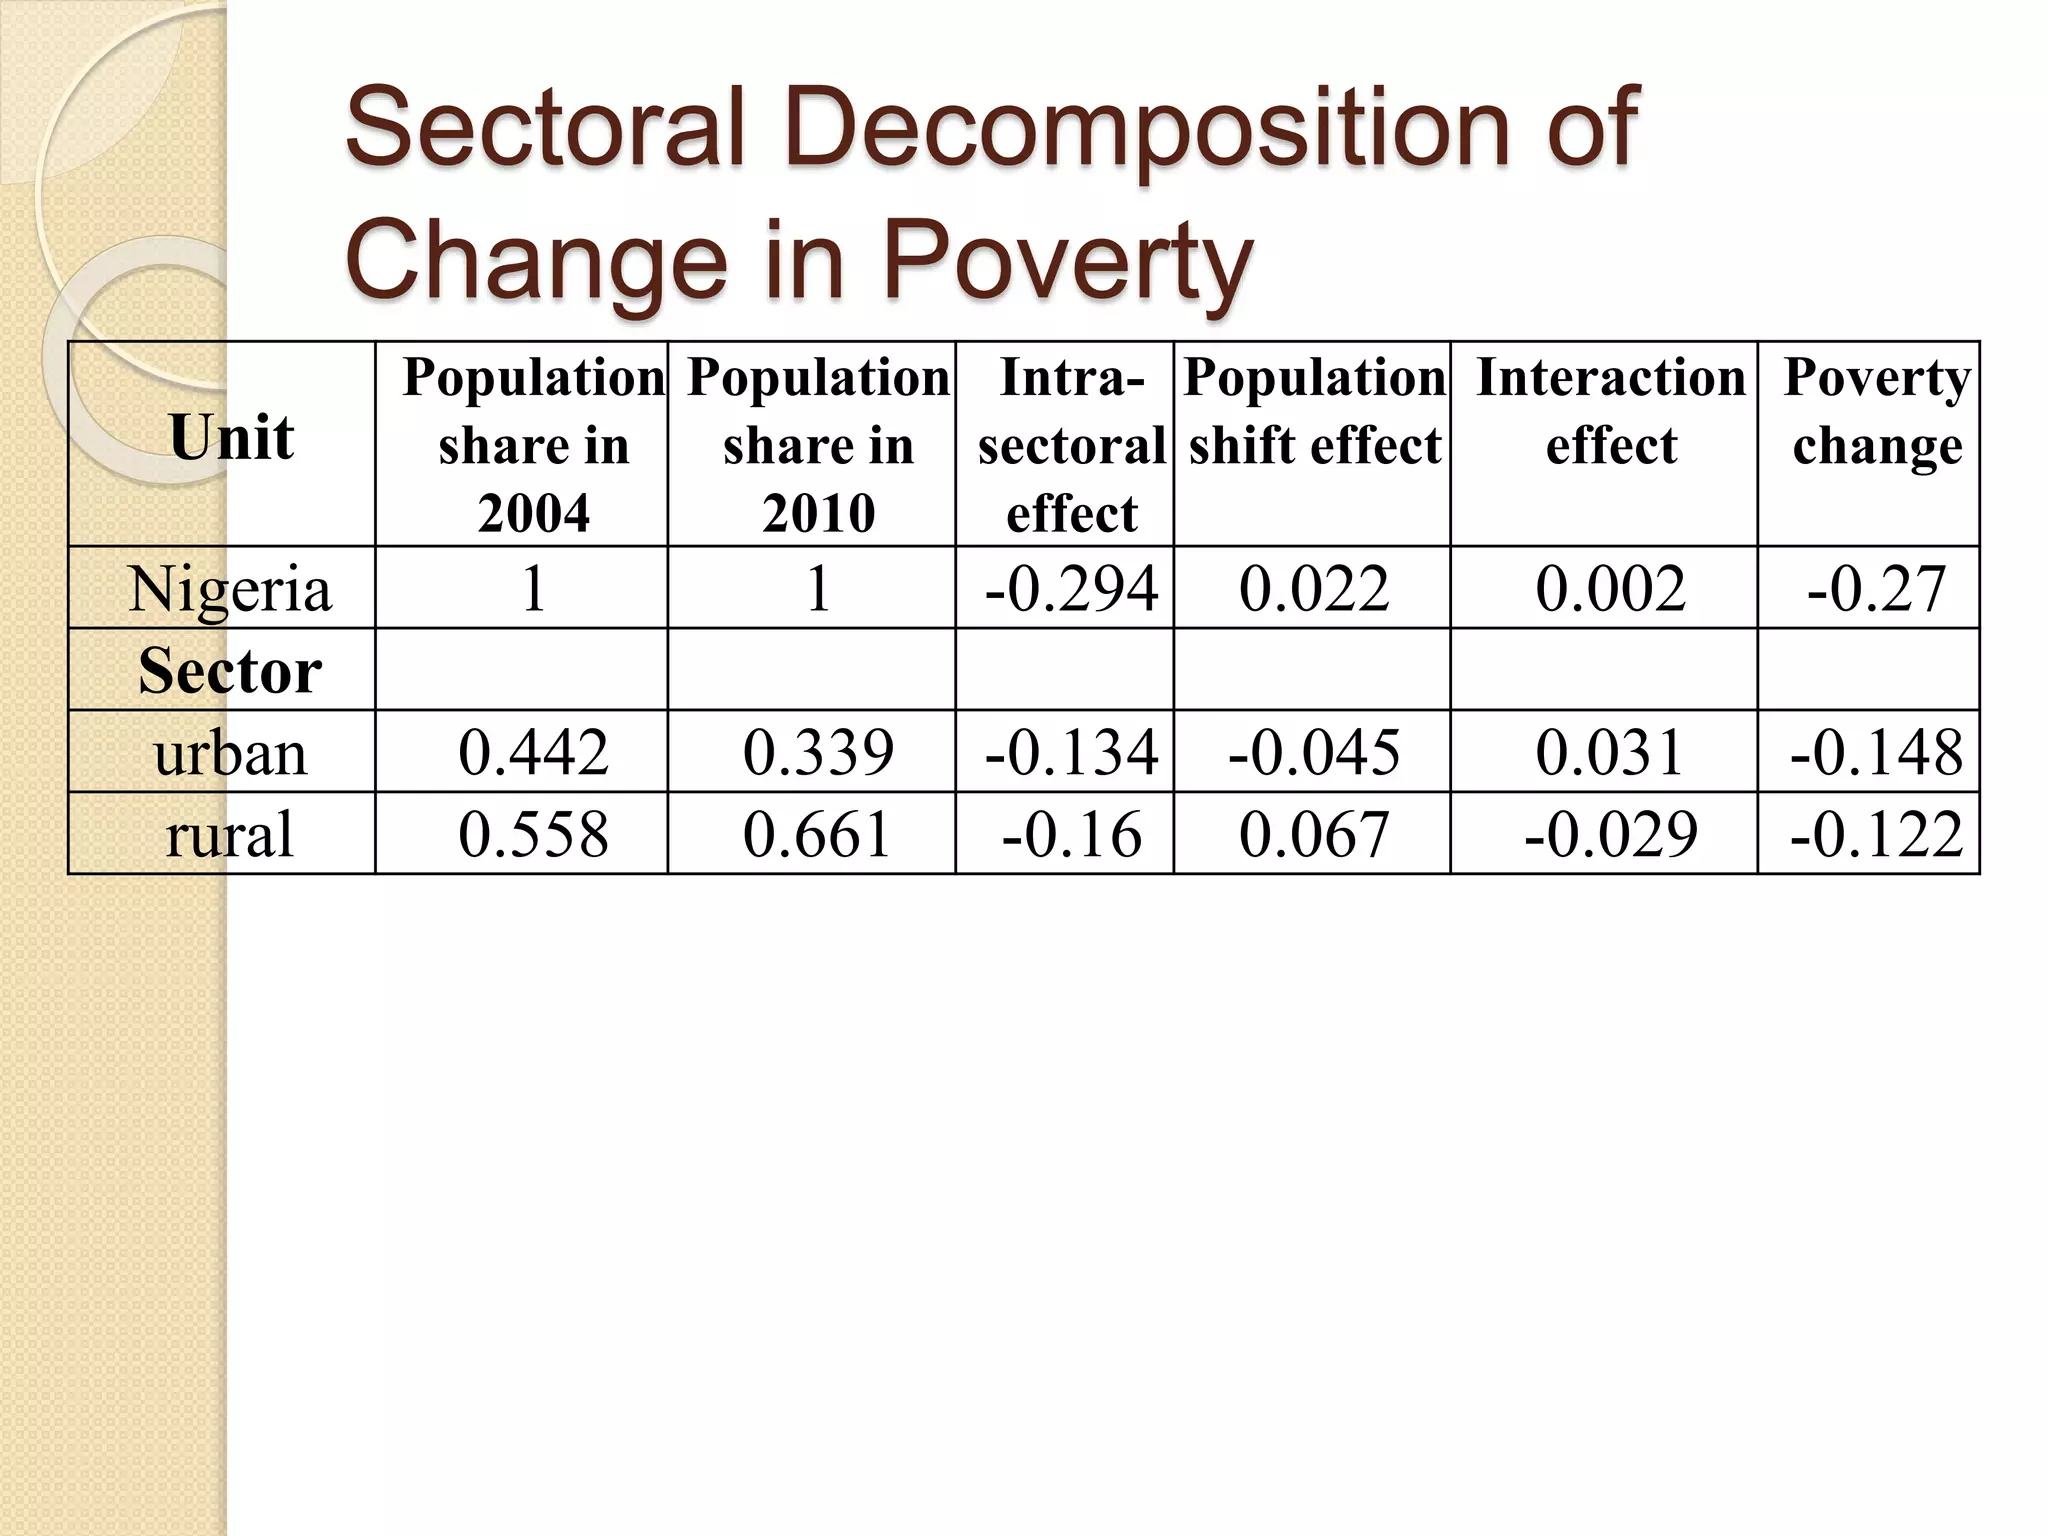
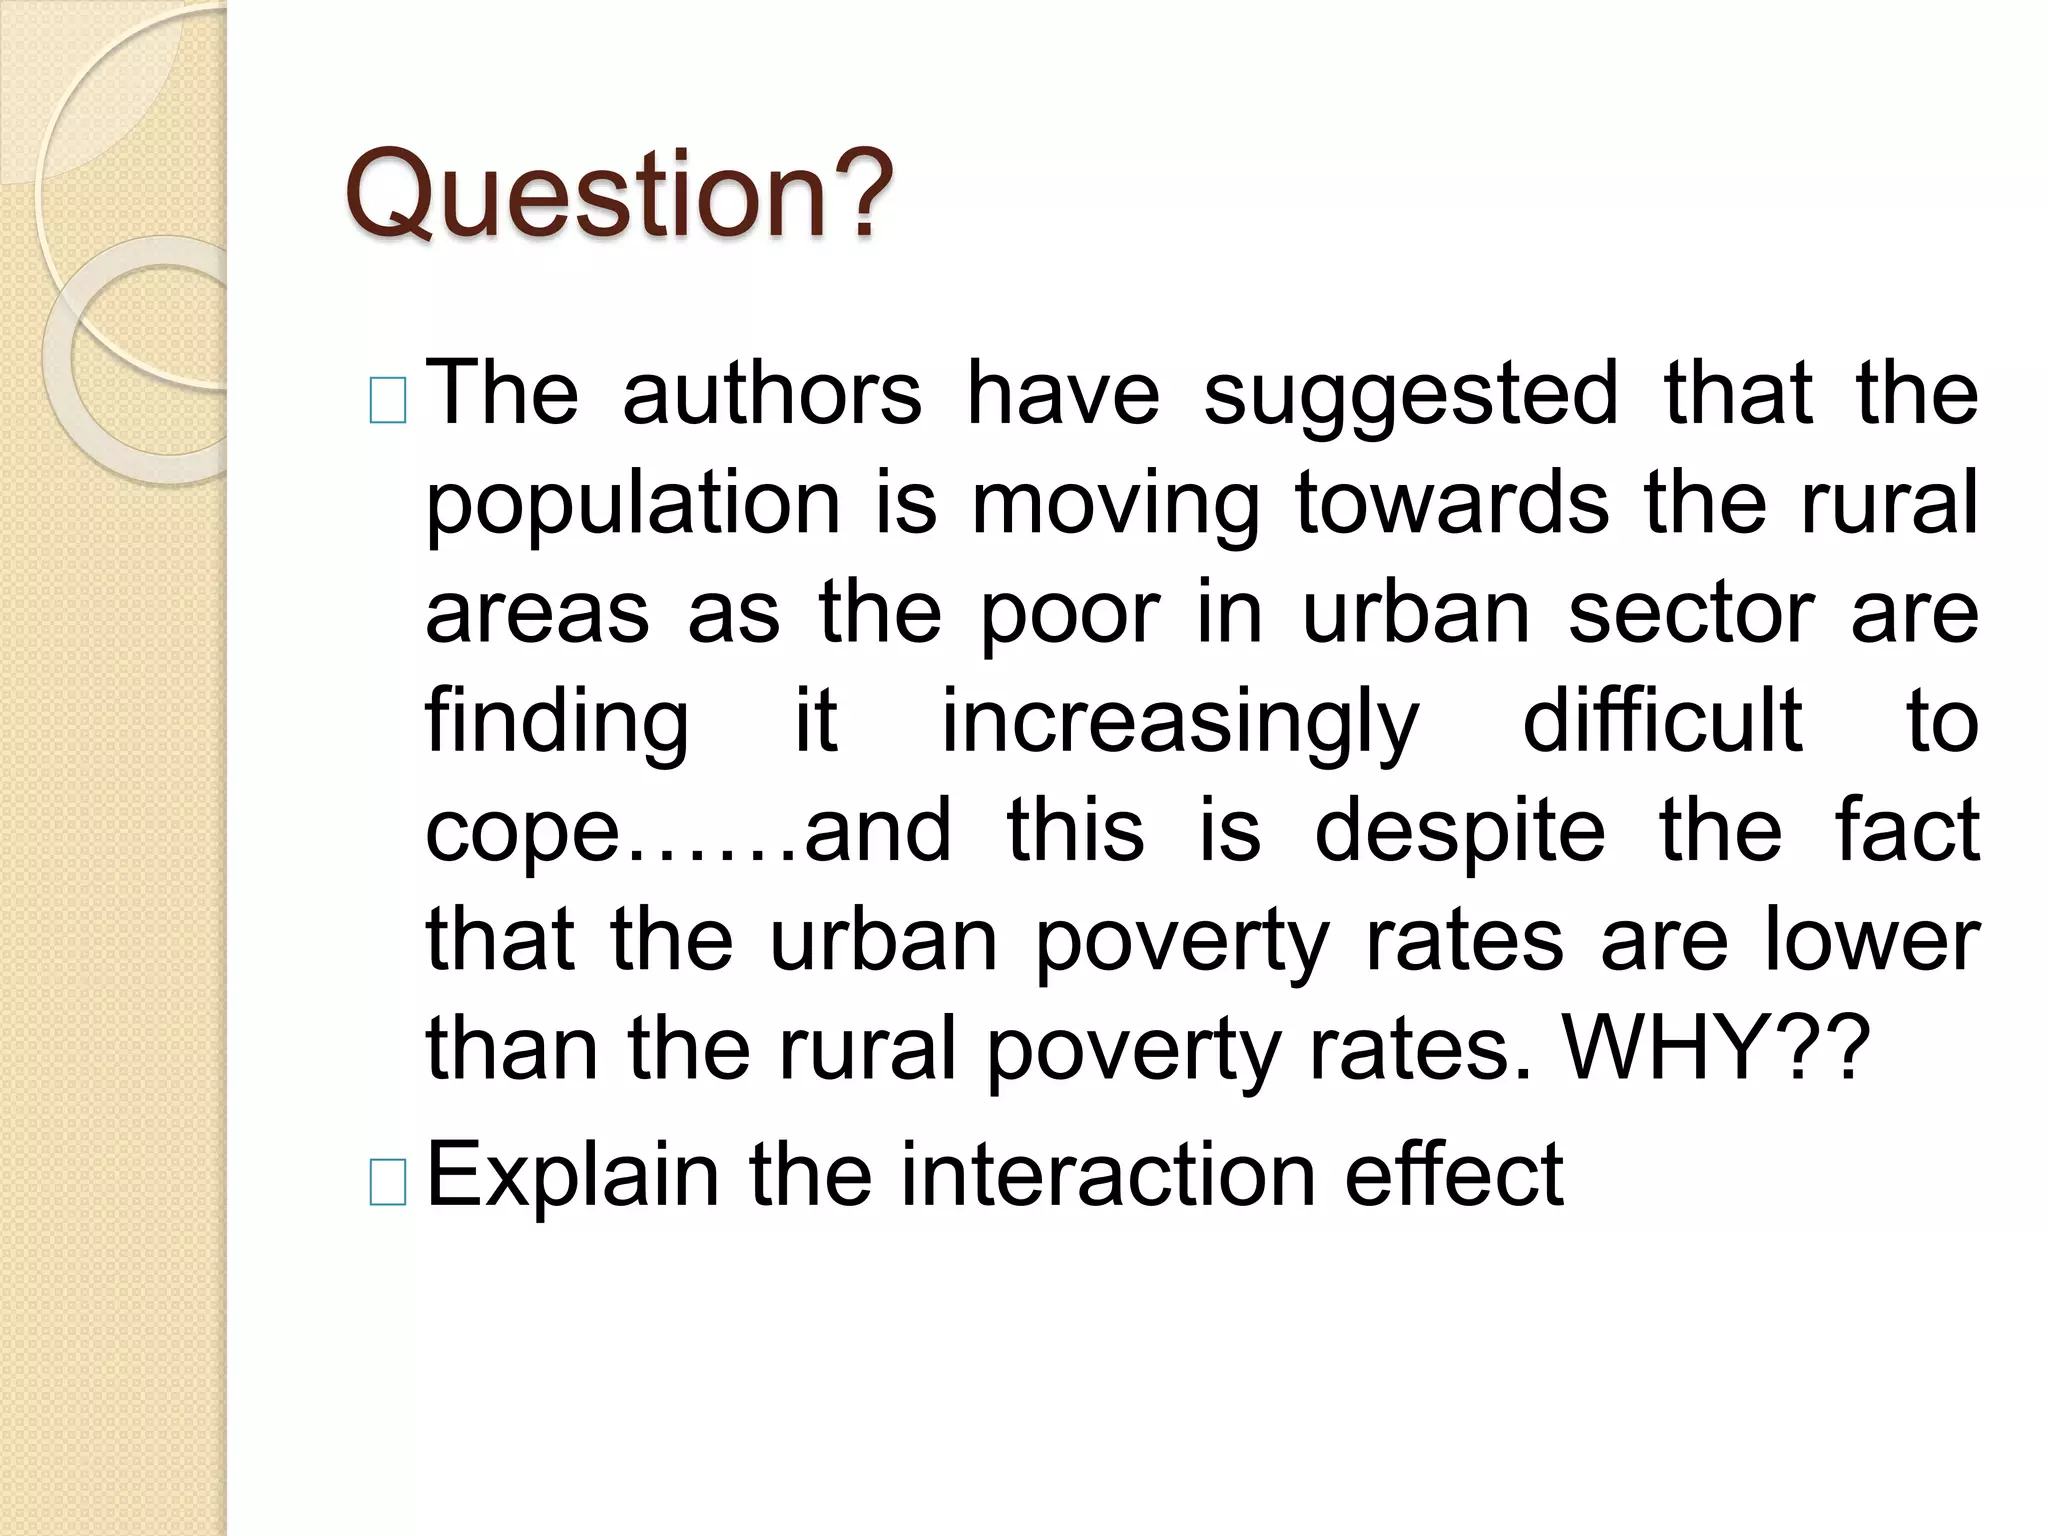
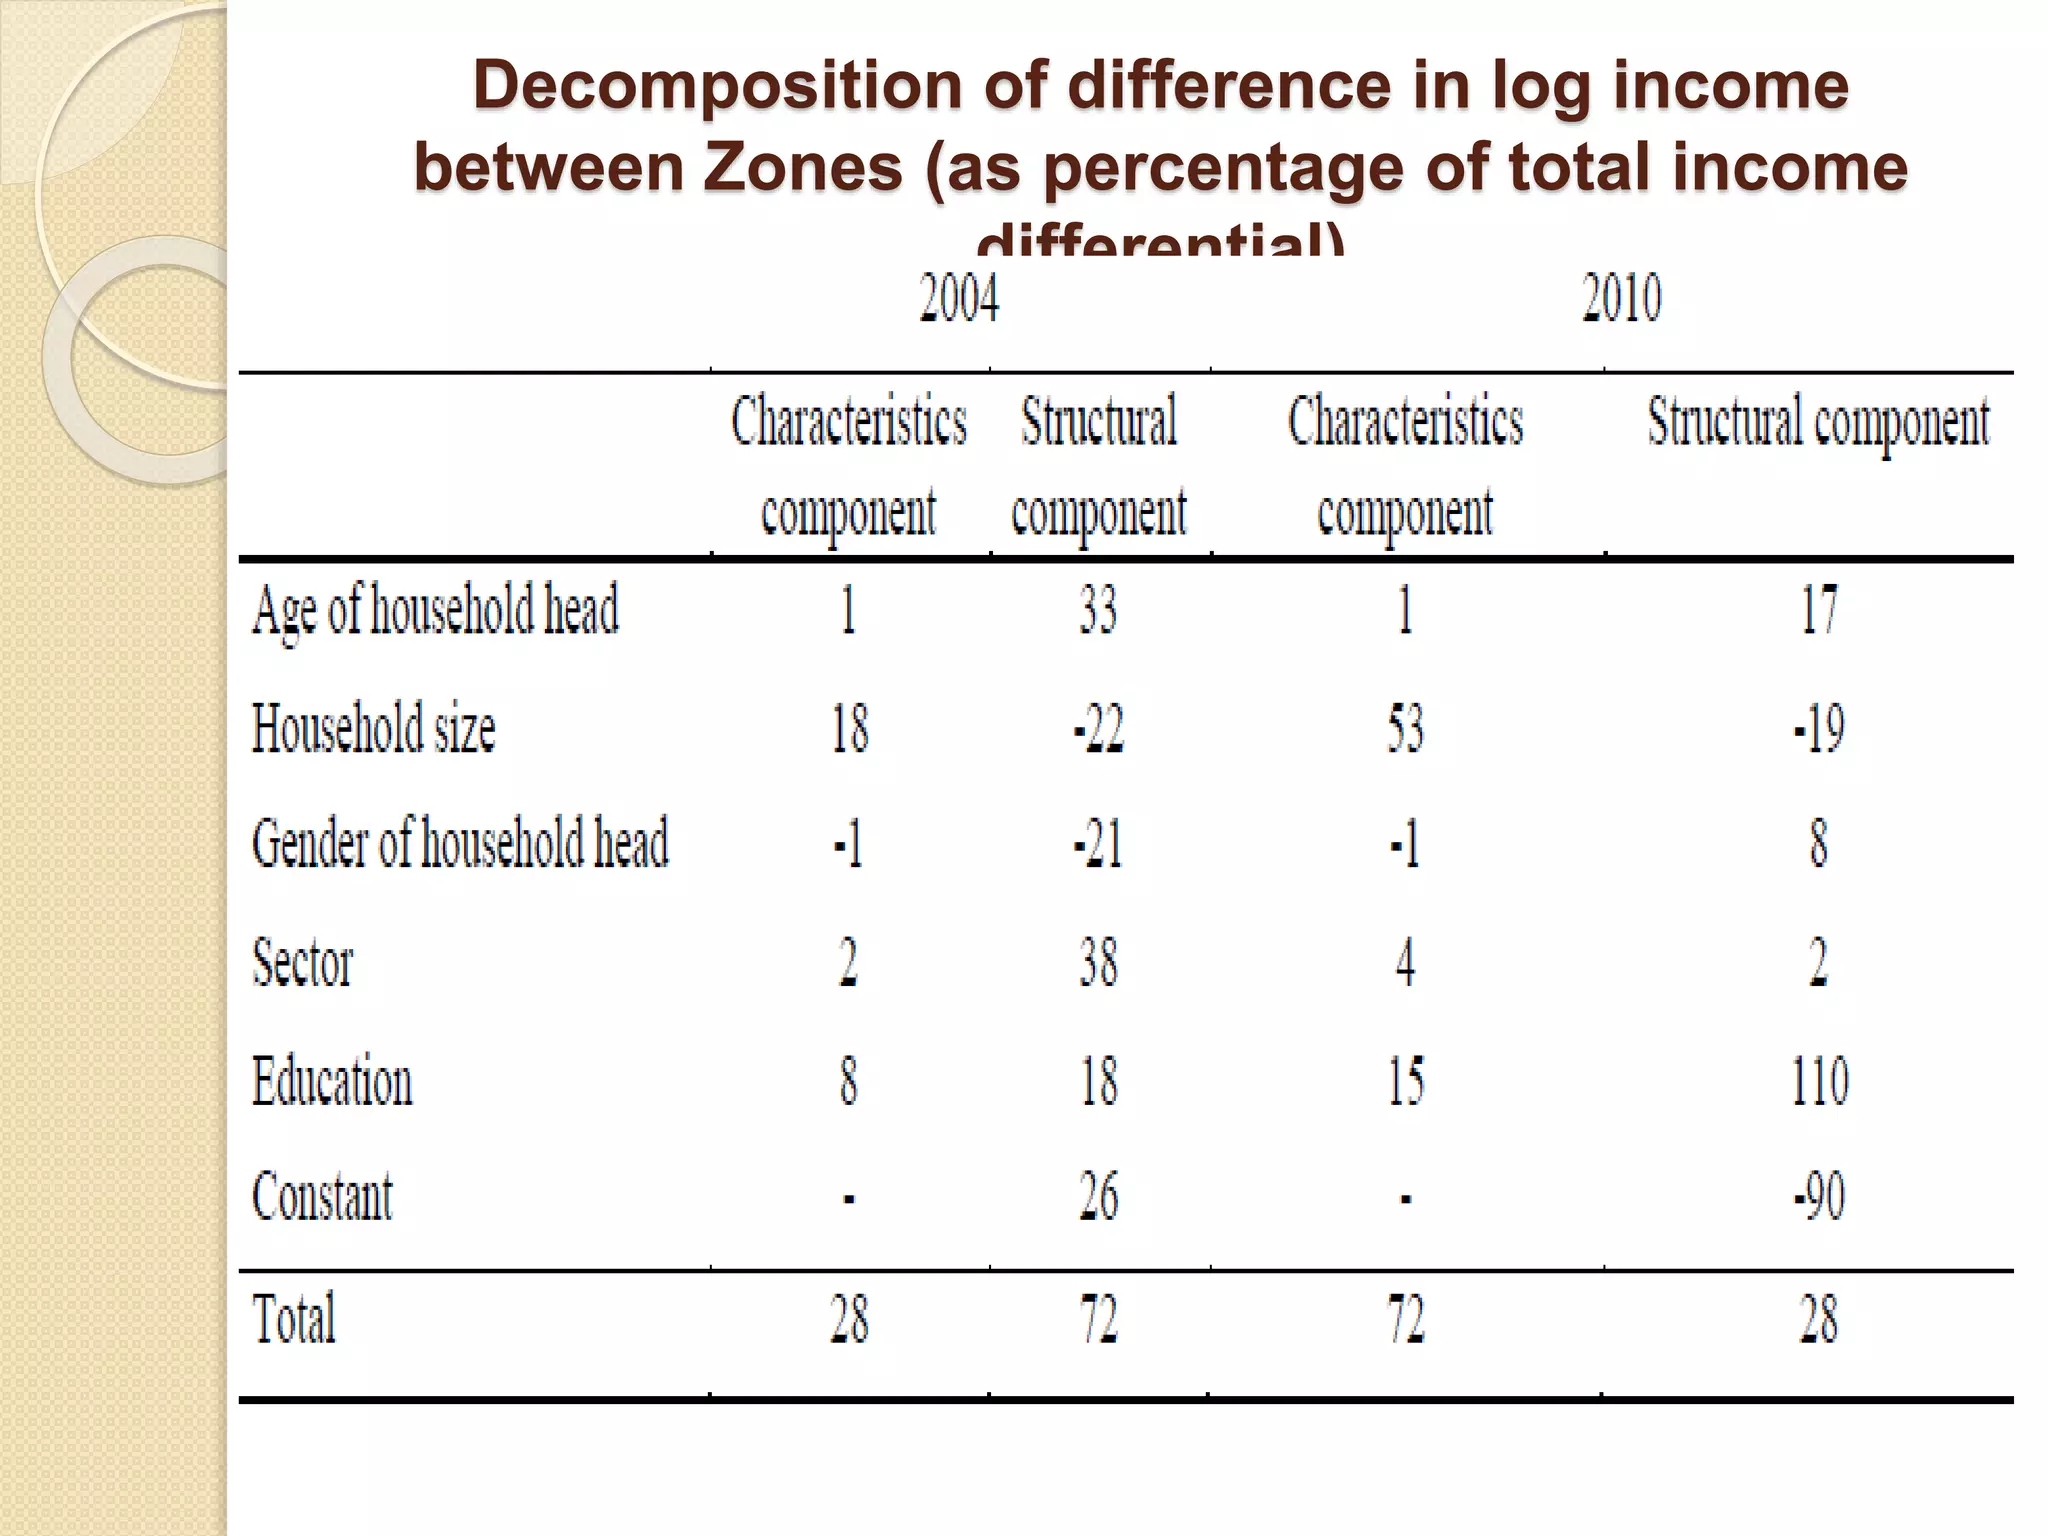
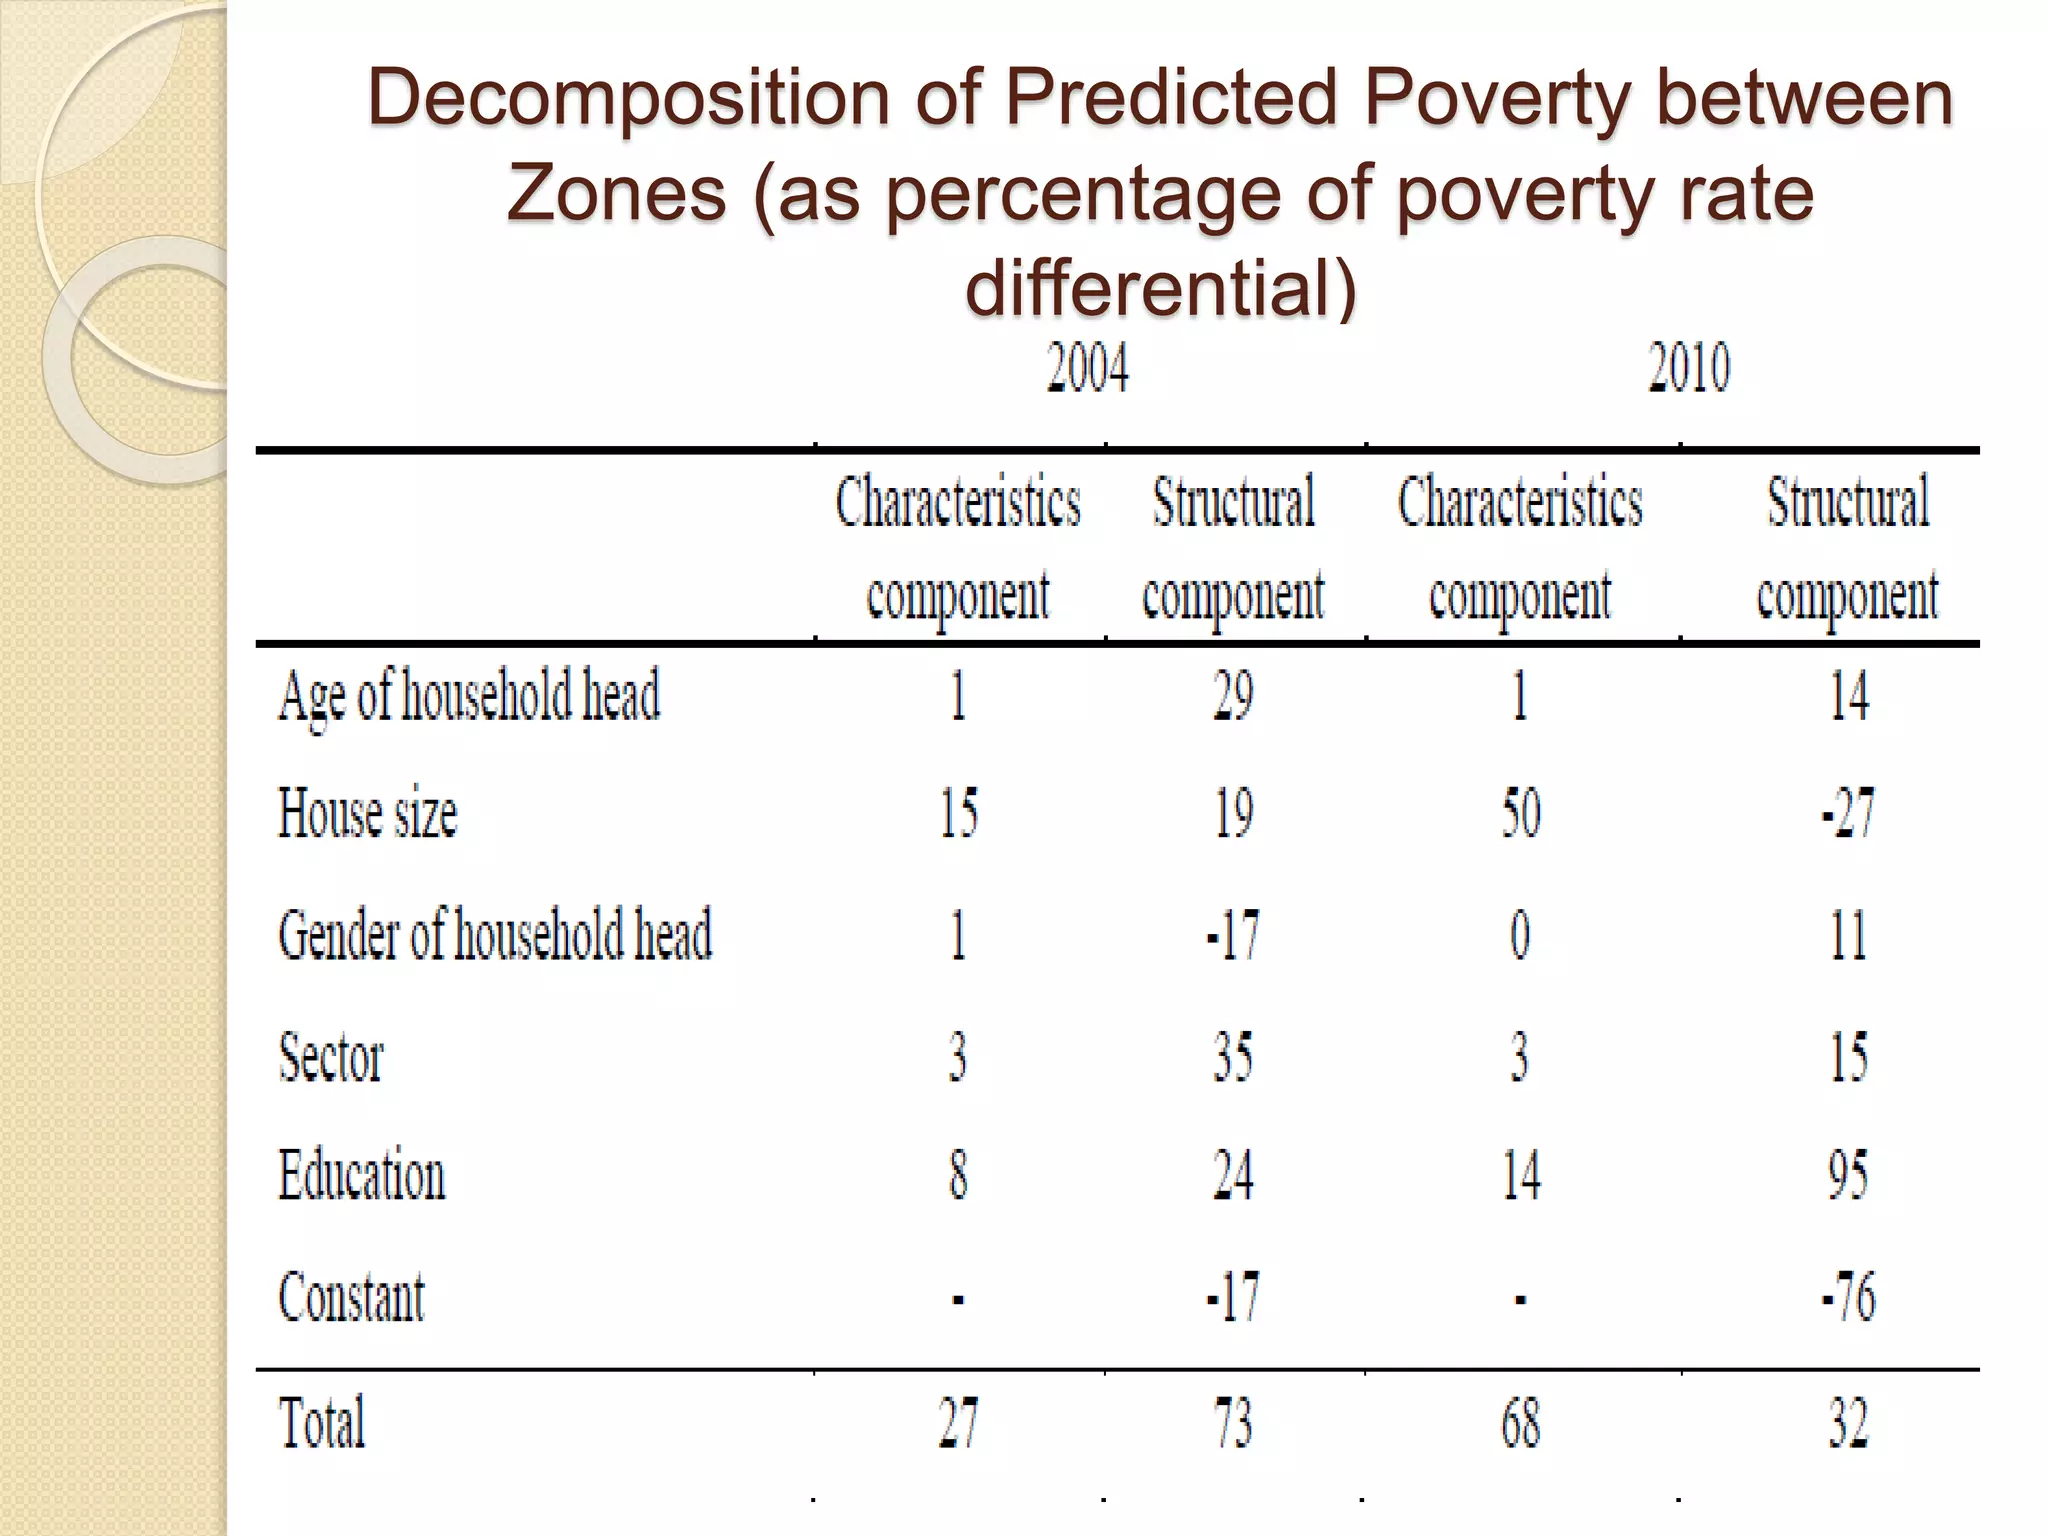
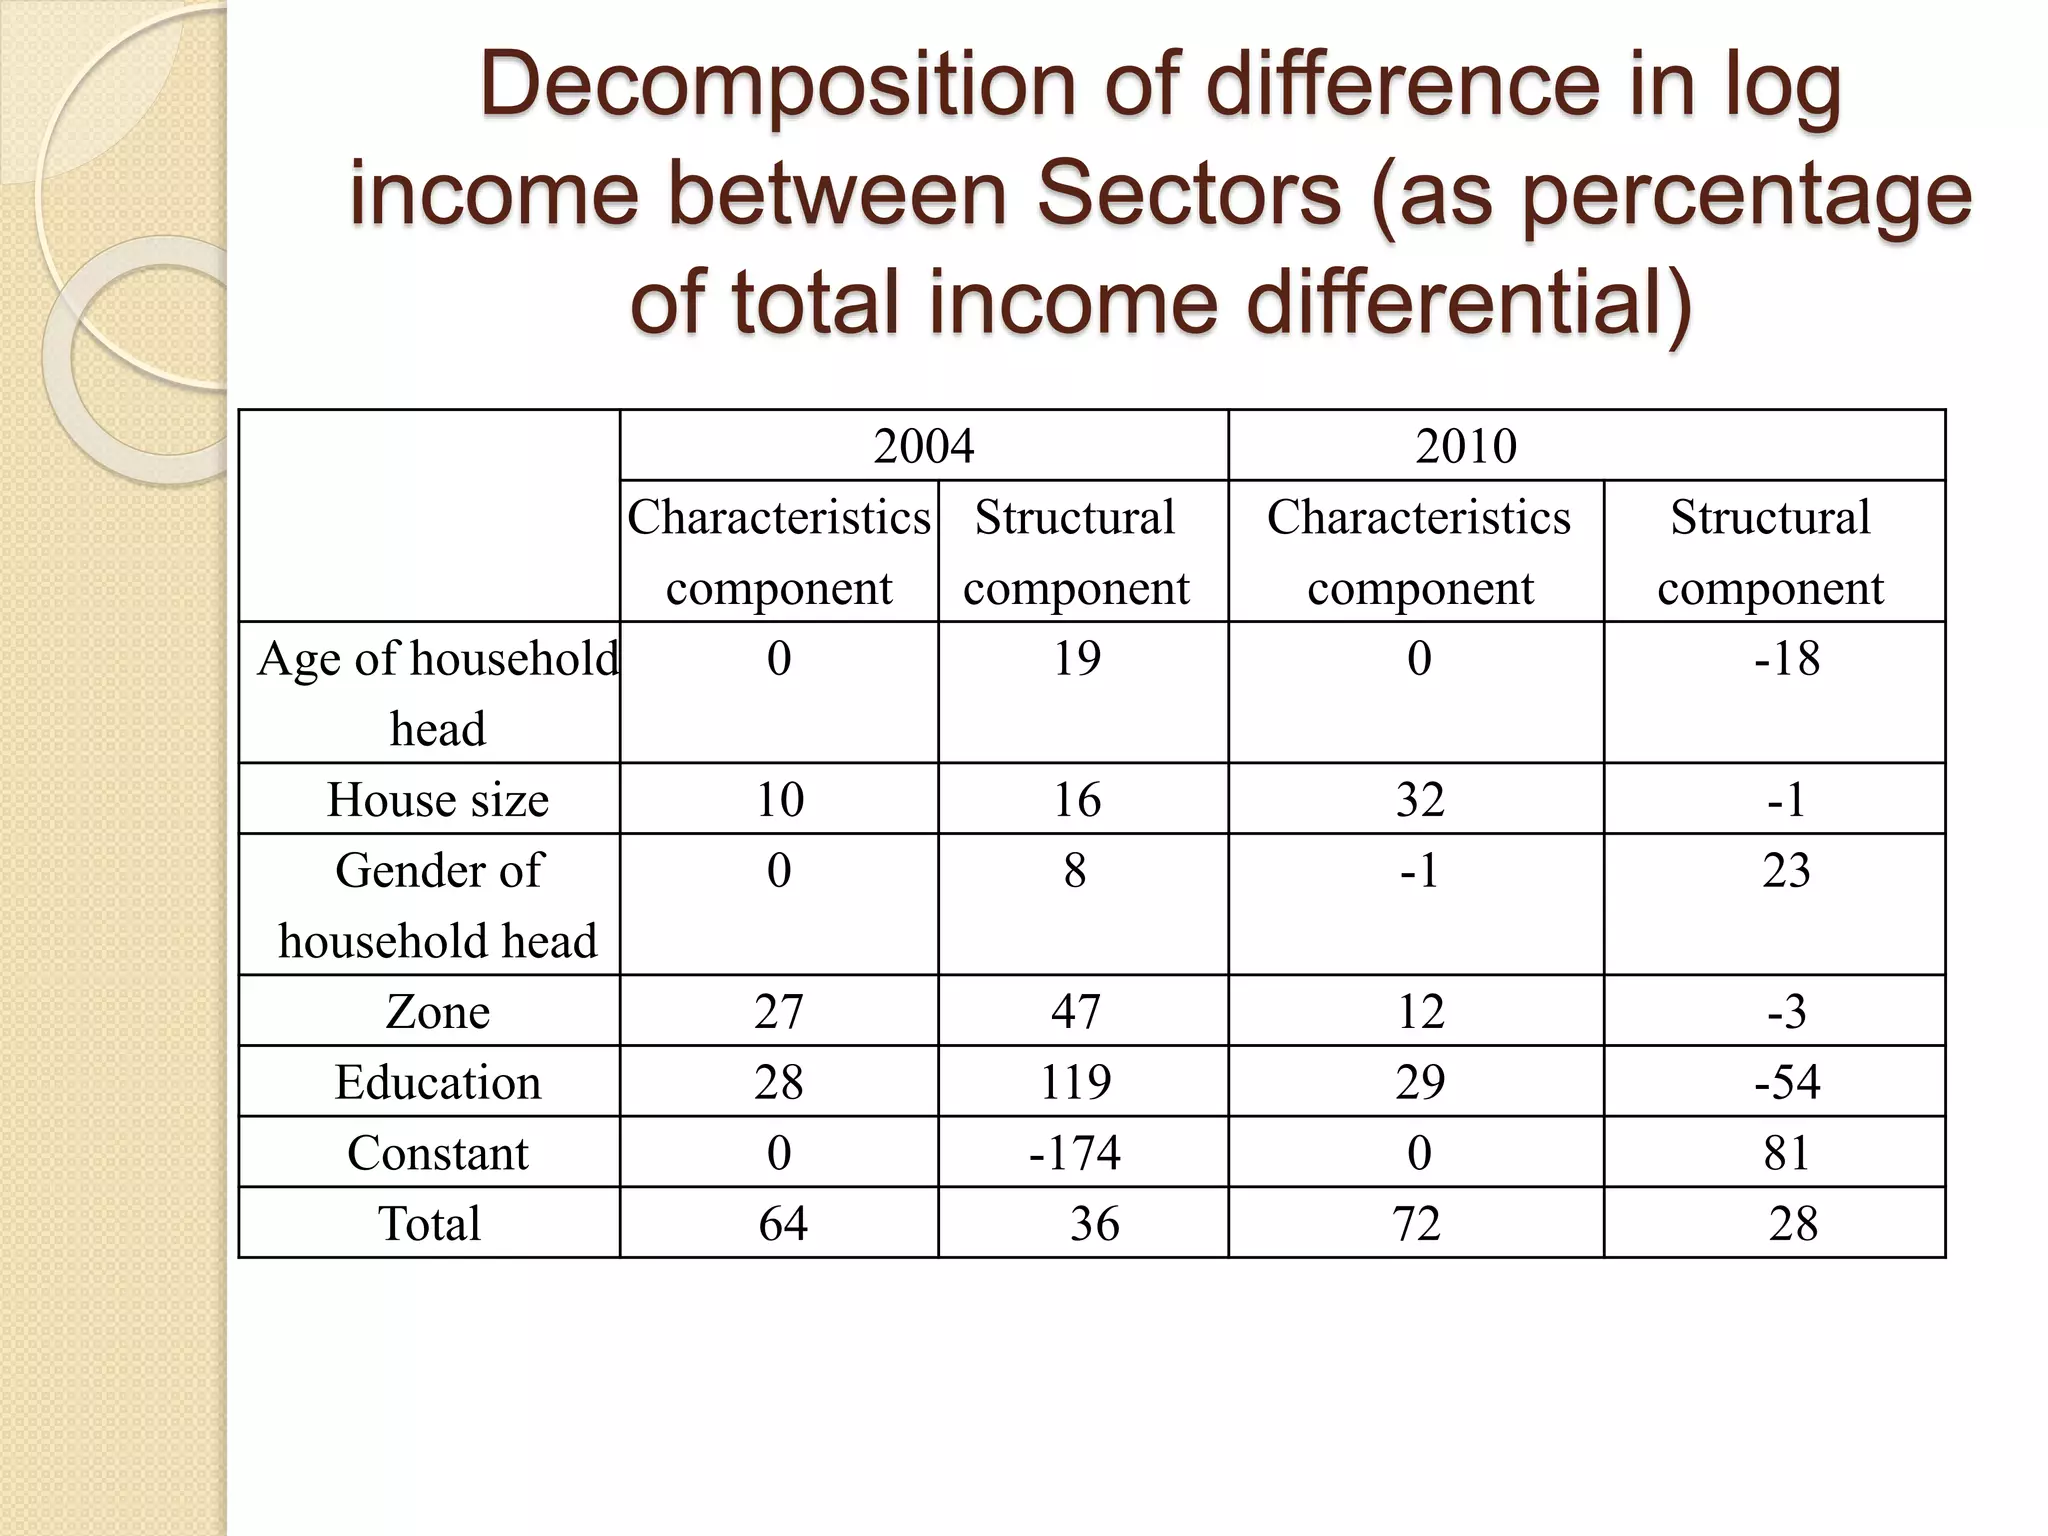
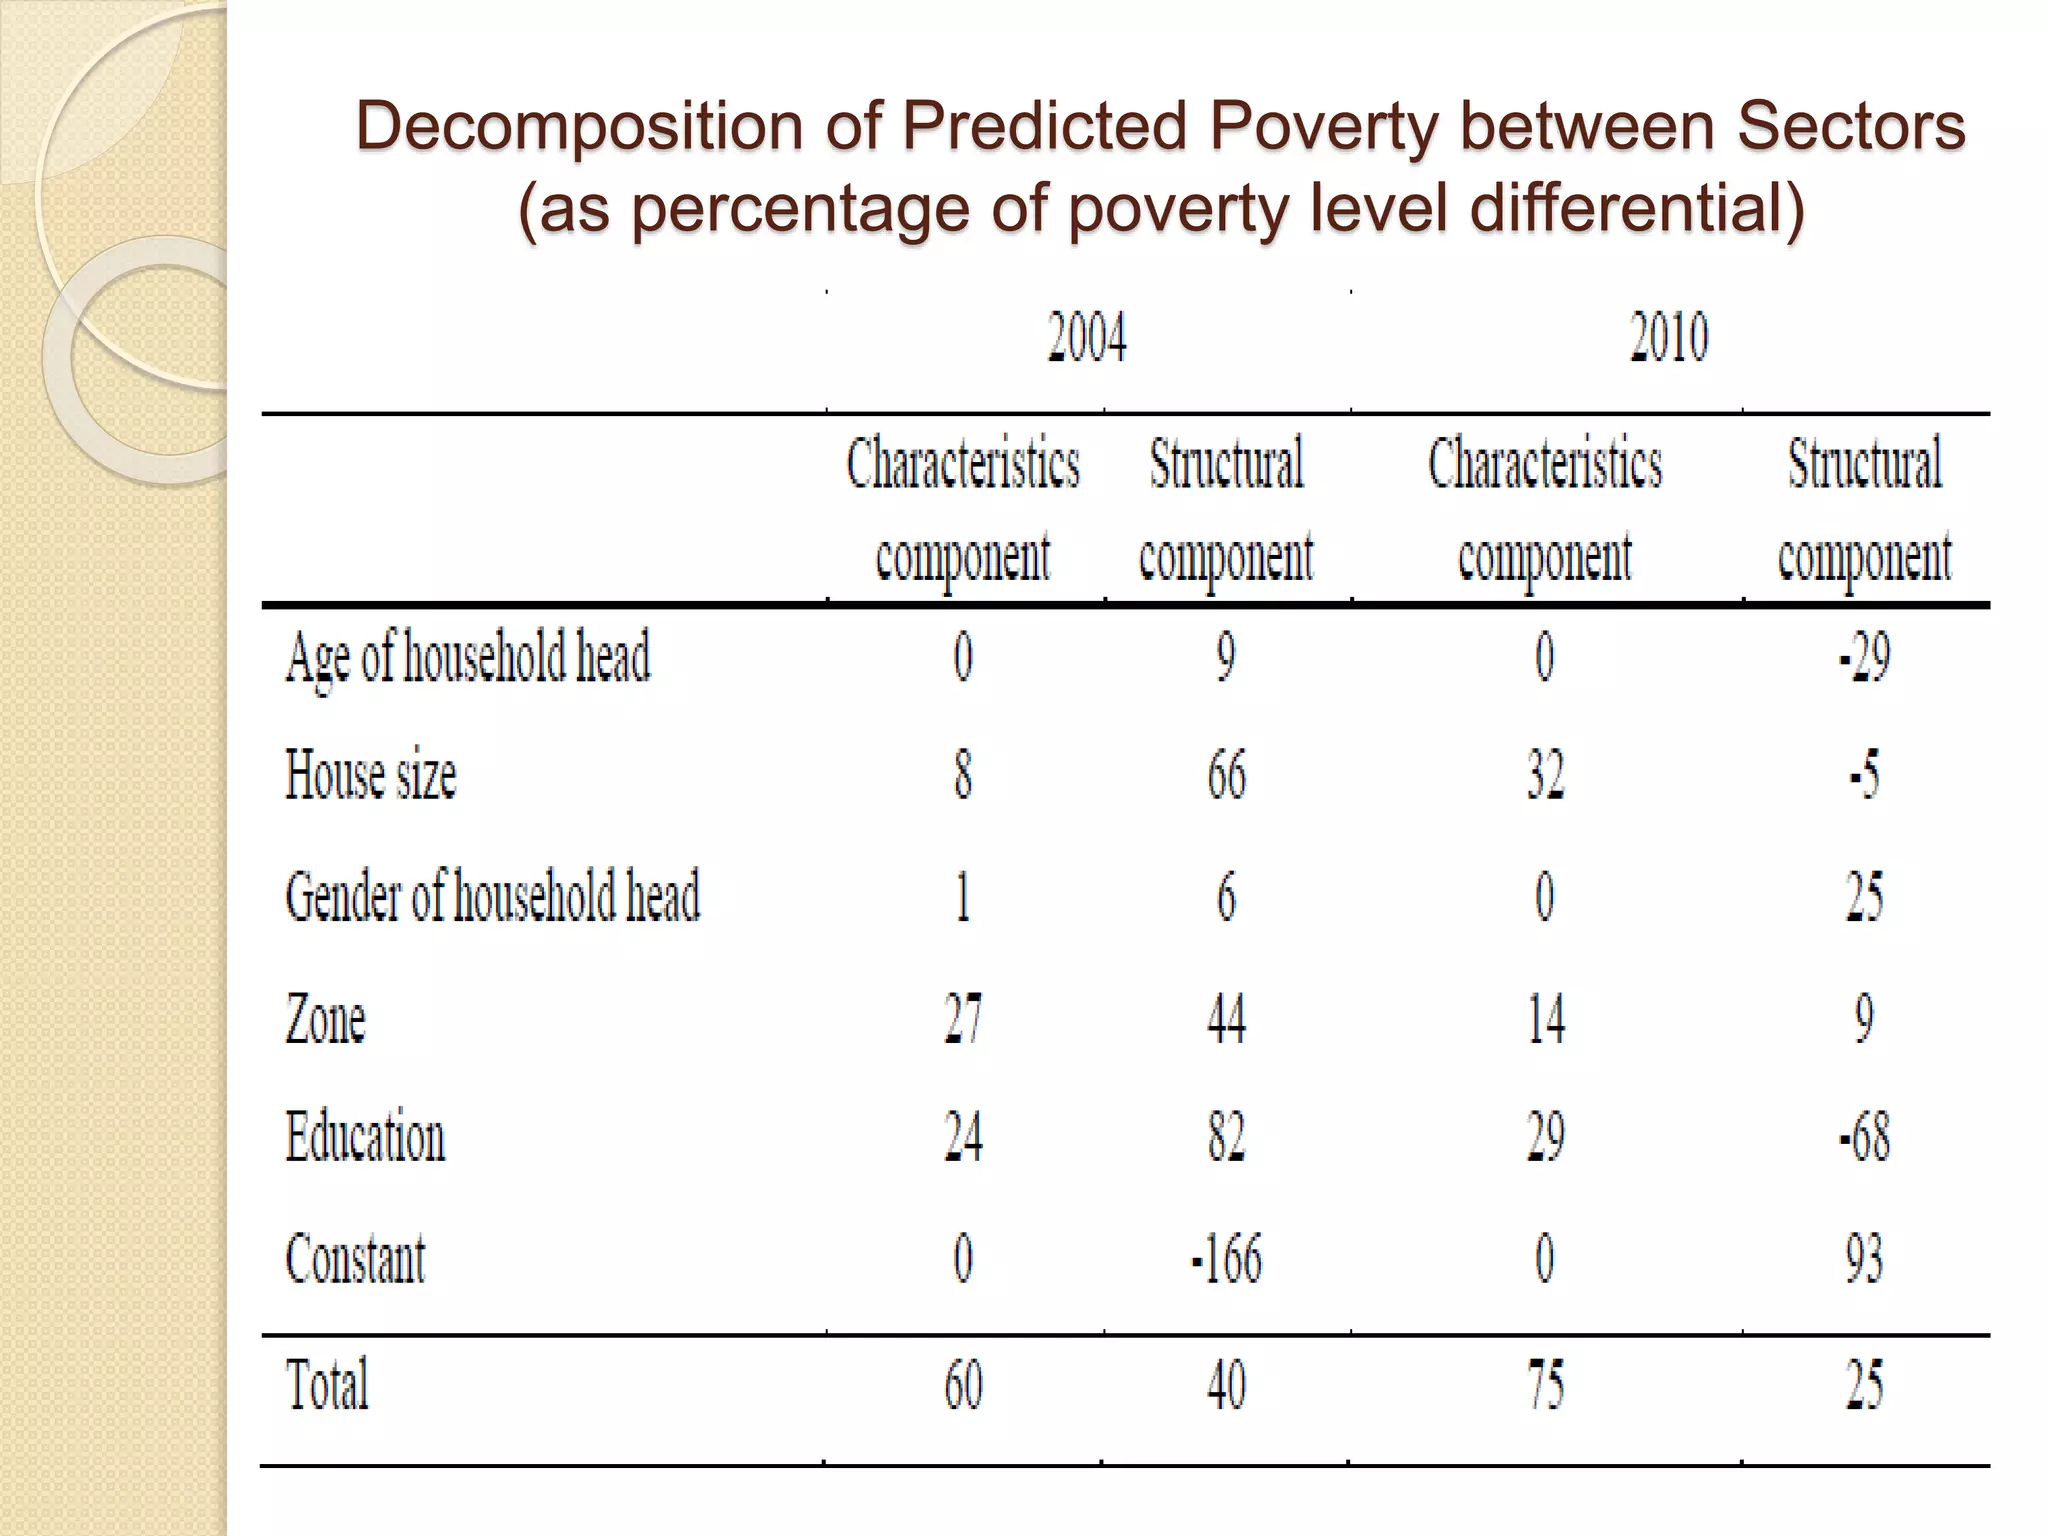
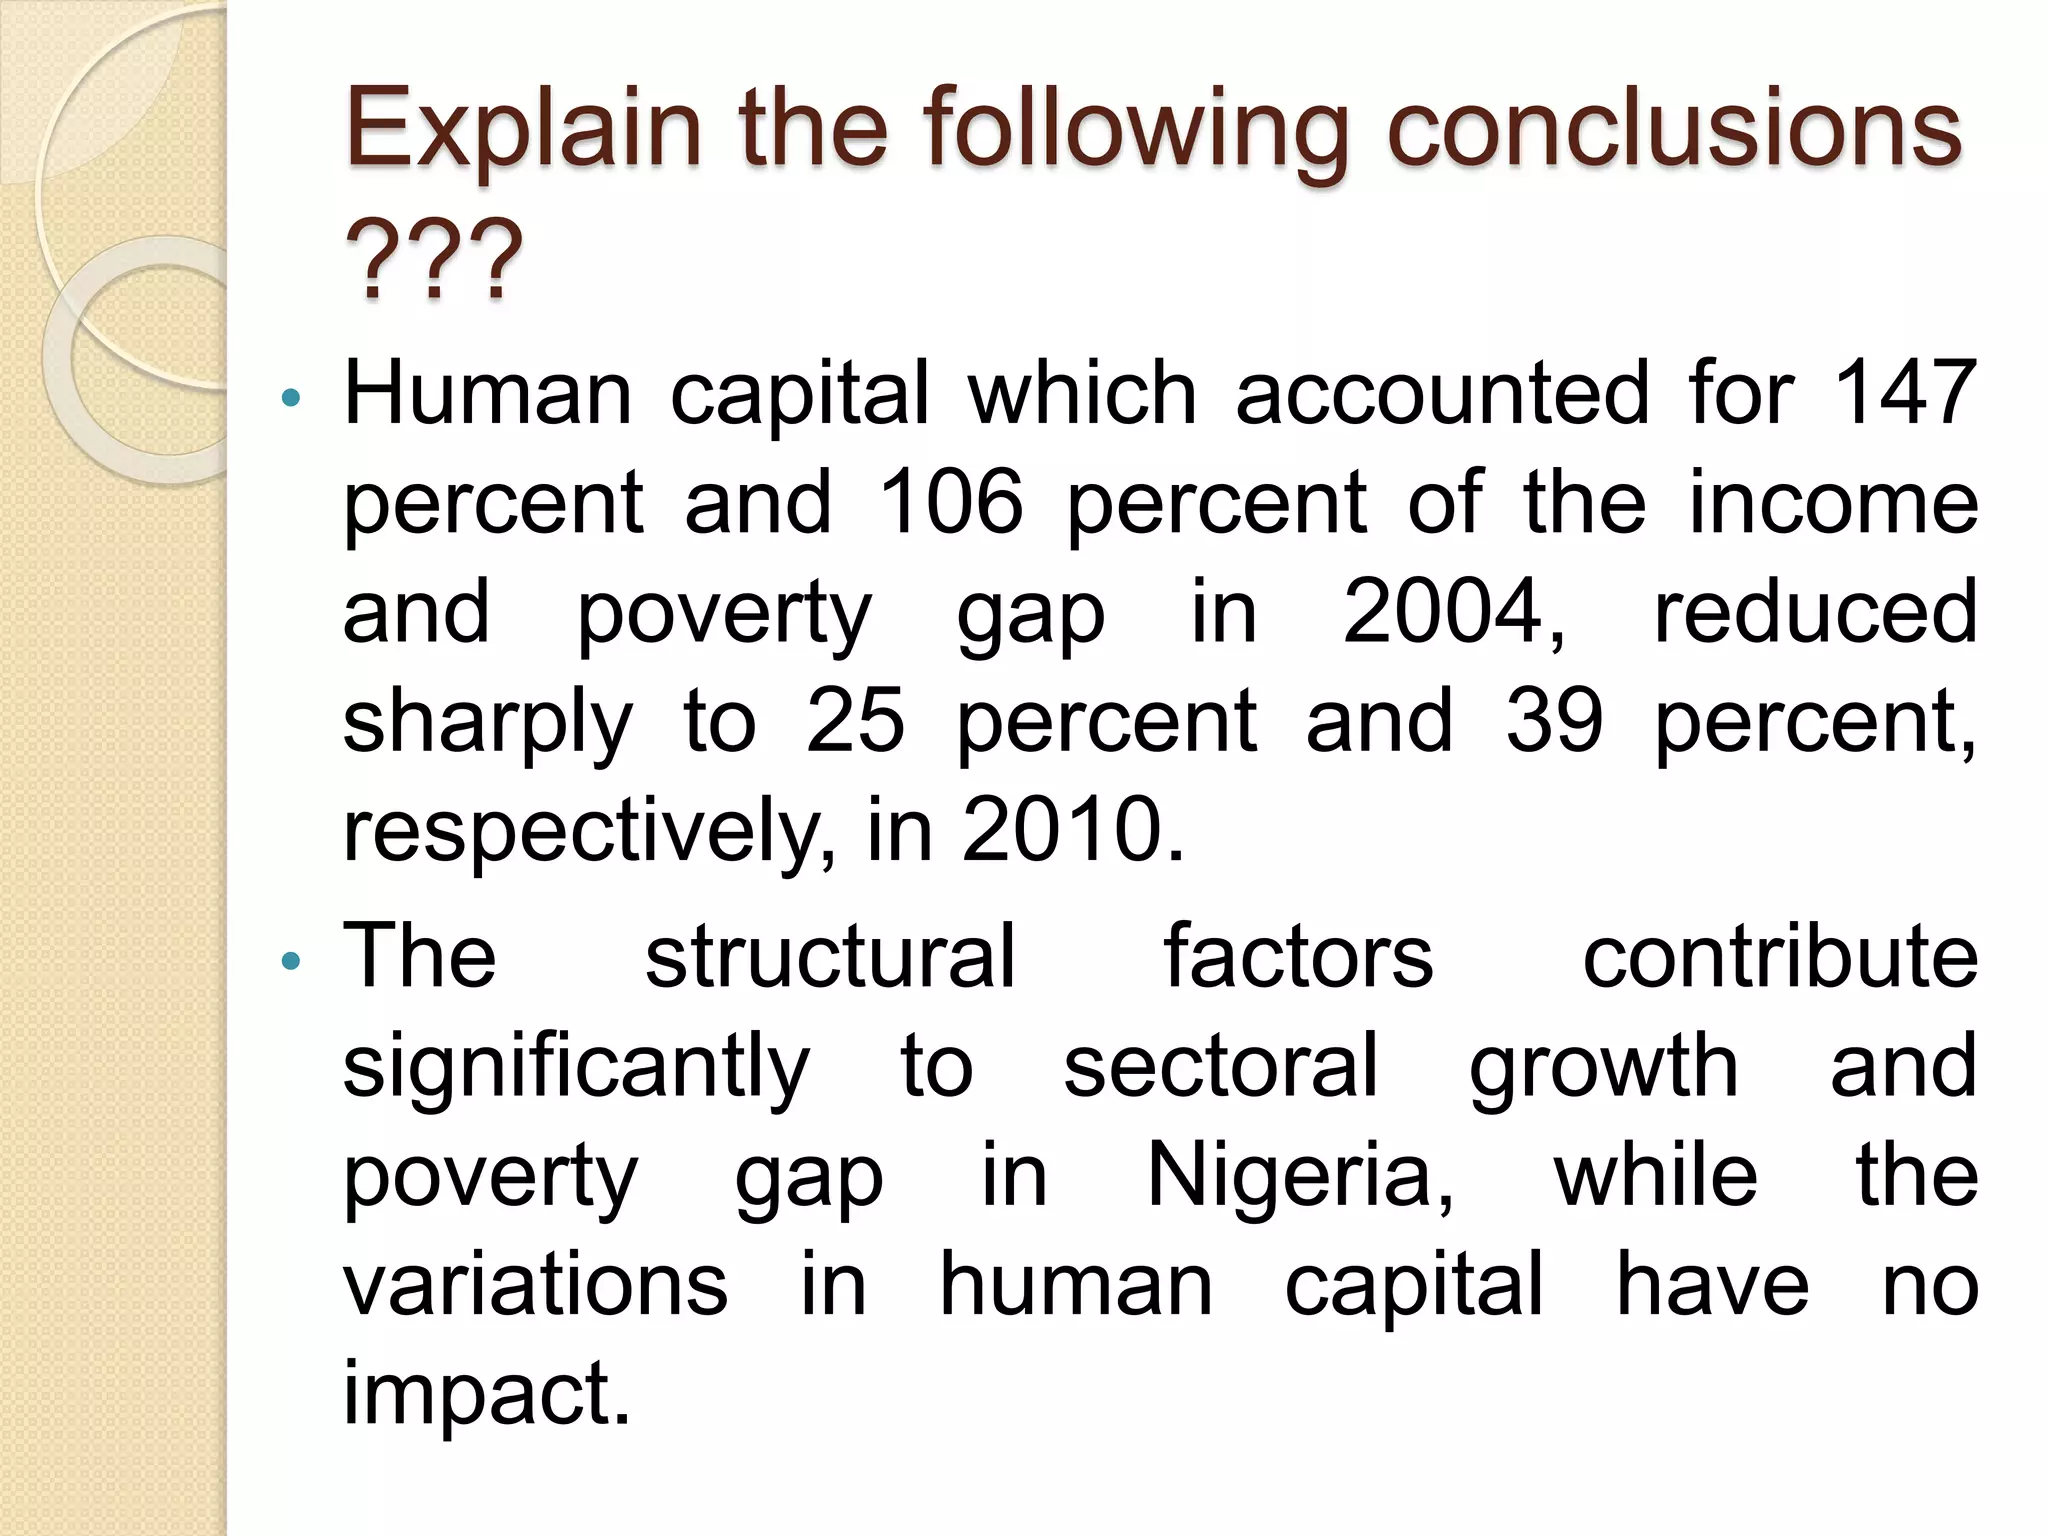
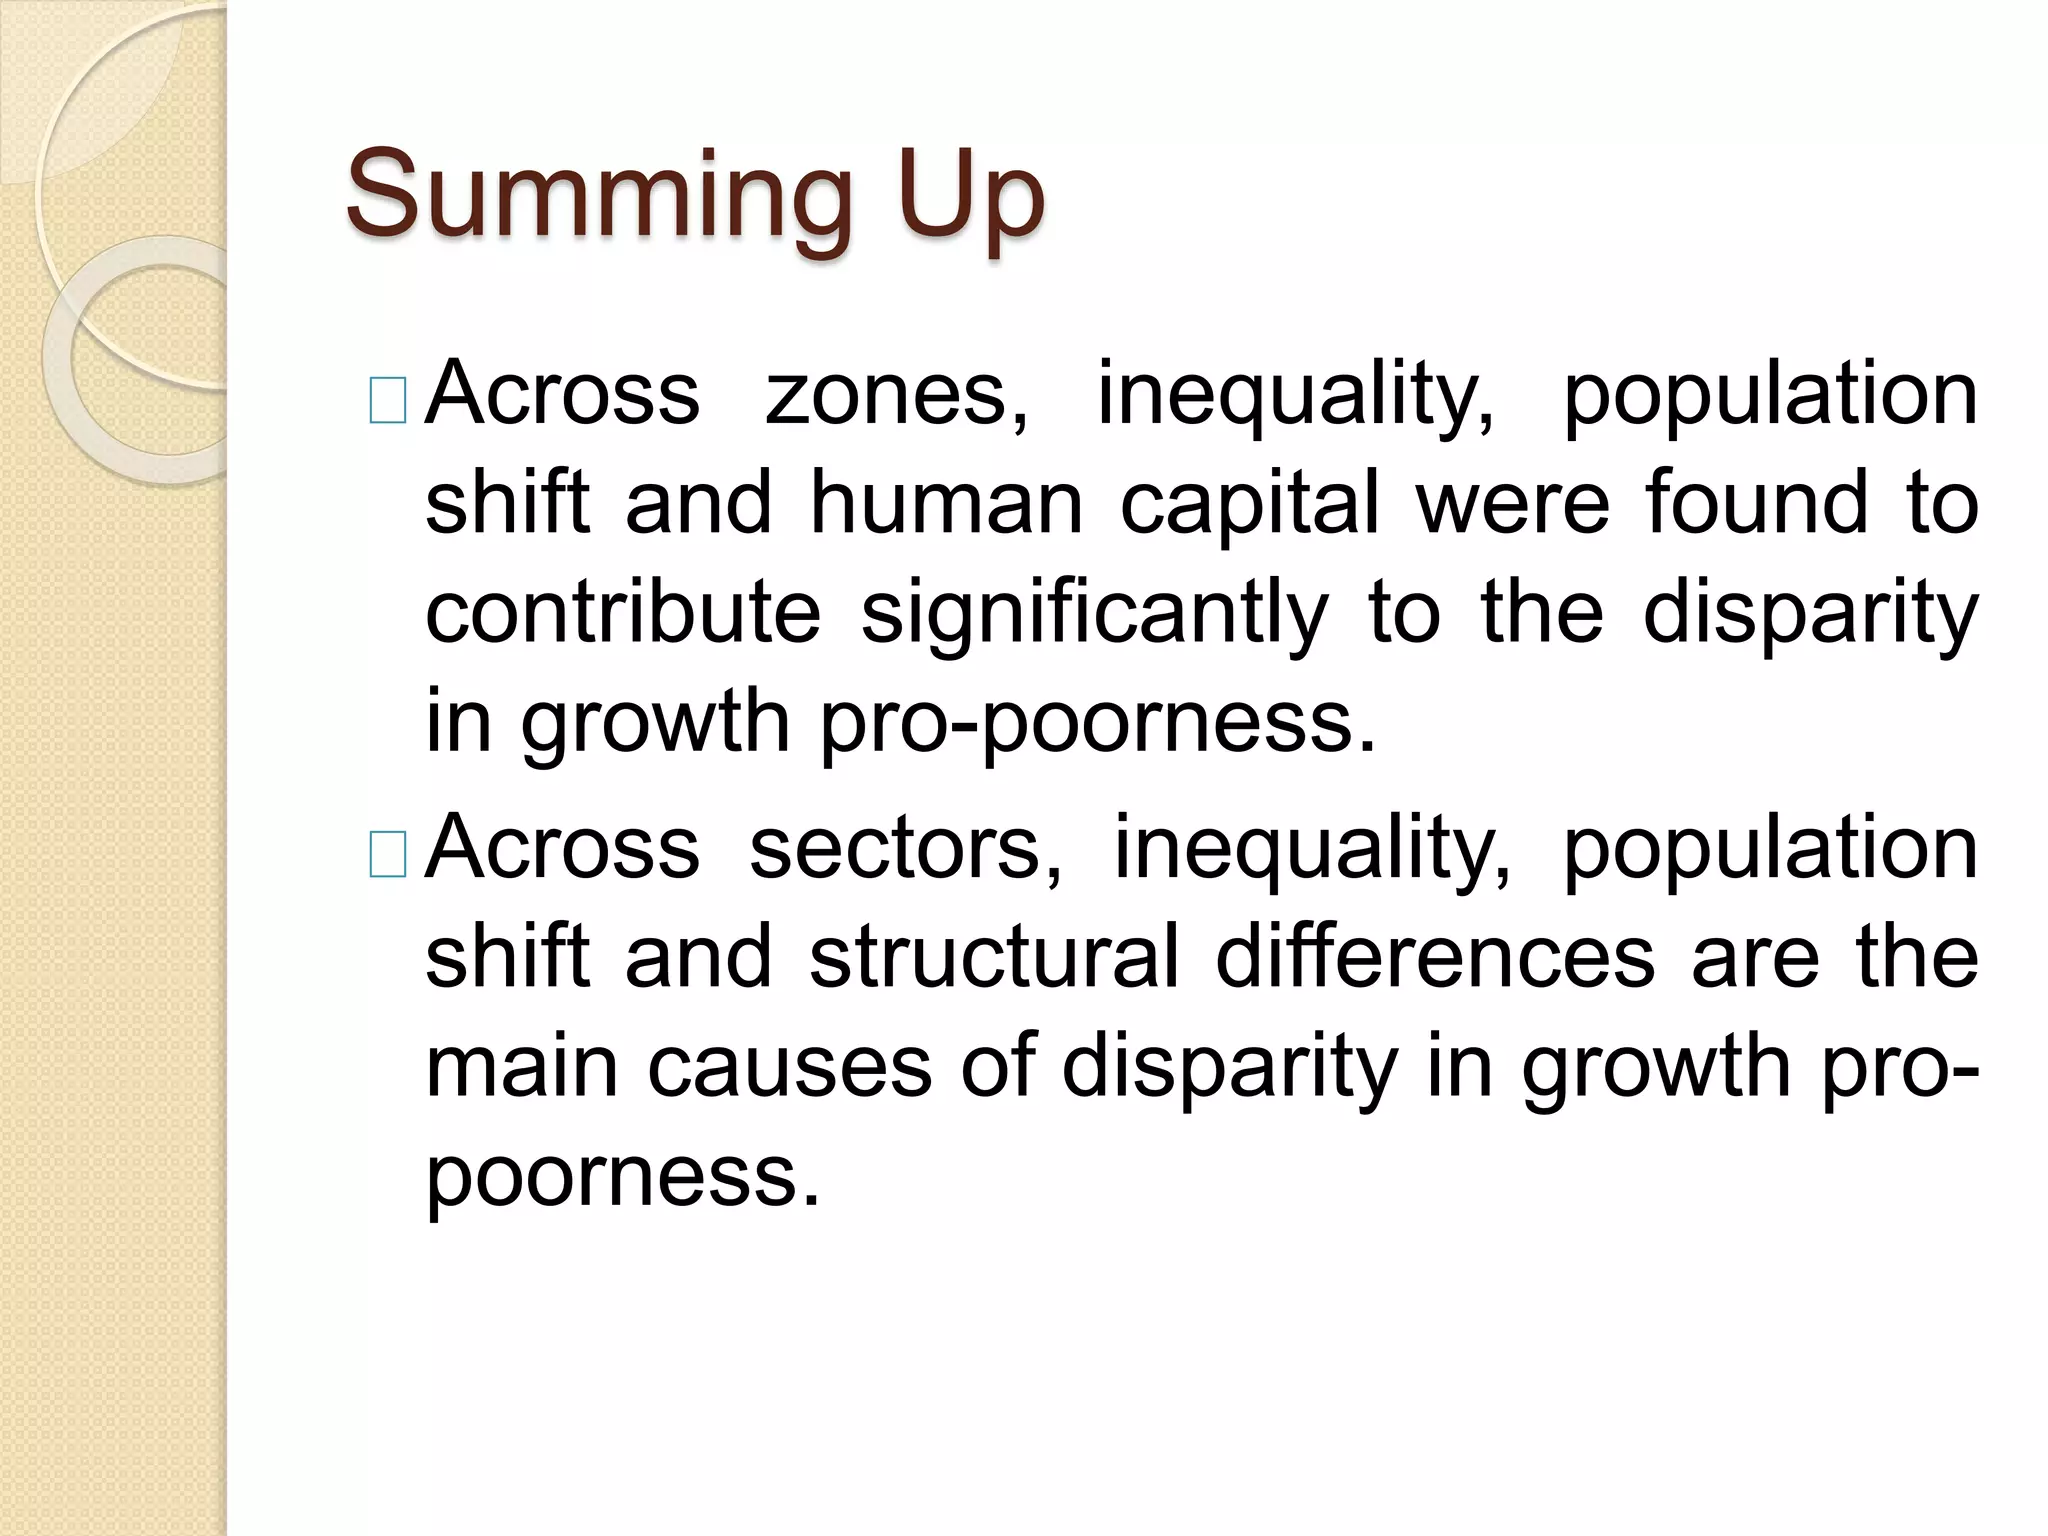
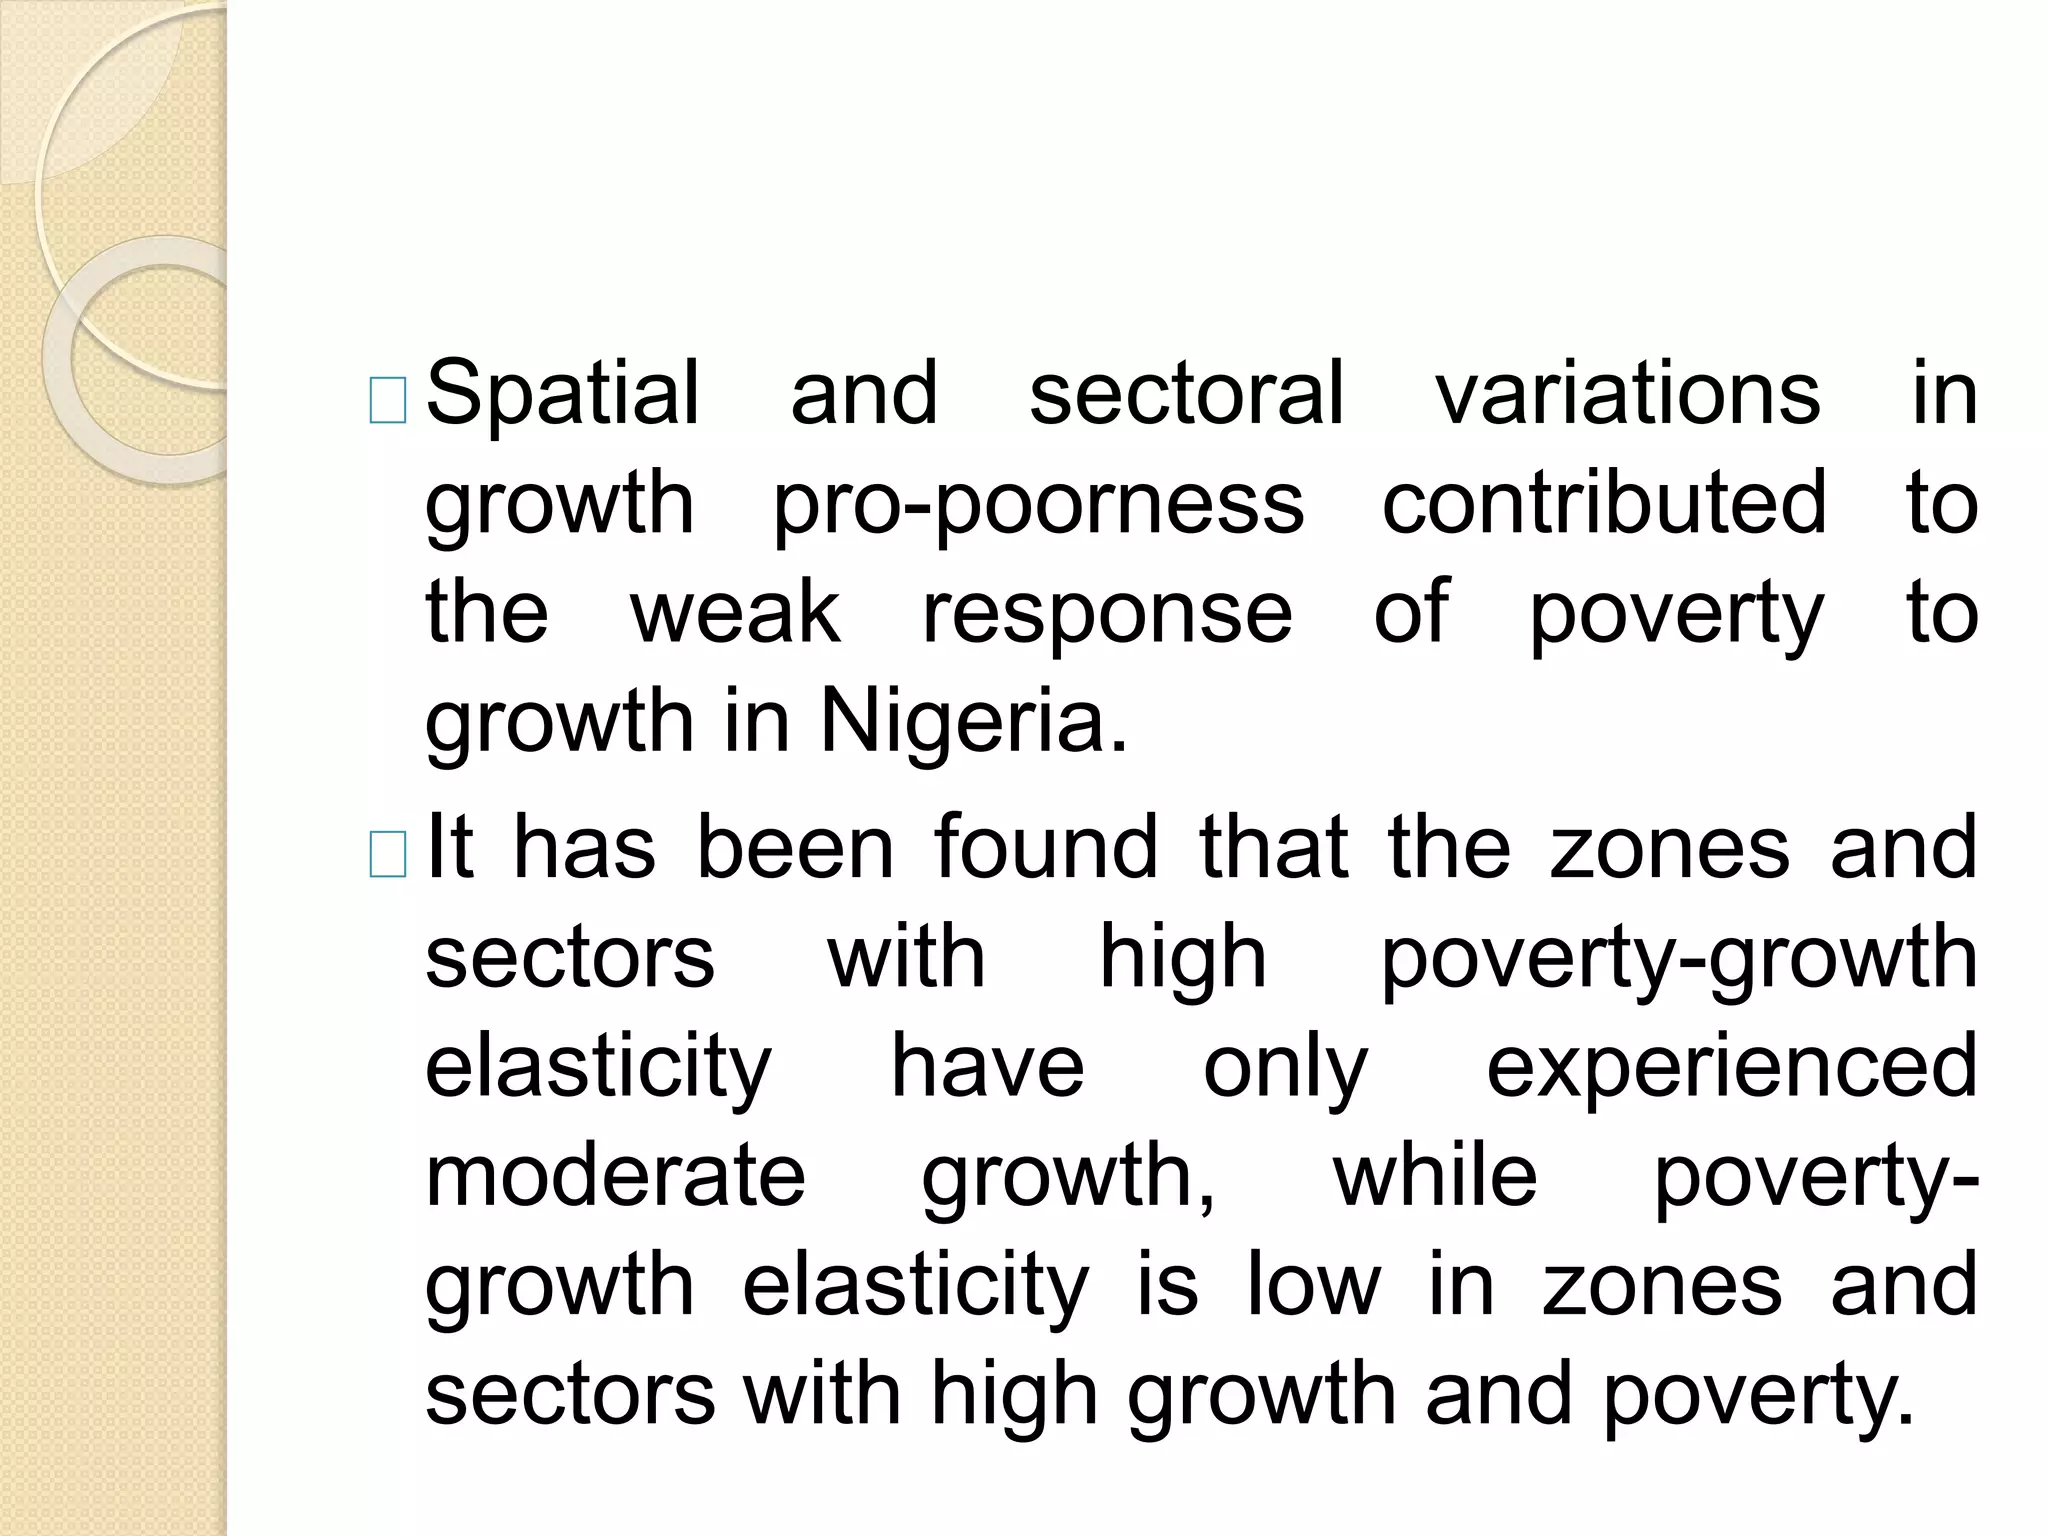
Explaining the Spatial and Sectoral 
Variations in Growth Pro-poorness in 
Nigeria 
Eberechukwu Uneze 
Adedeji Adeniran 
Centre for the Study of the Economies of Africa, 
Nigeria 
___________________________________________ 
_ 
Discussant: Anupama Uppal 
Punjabi University, Patiala 
India
Objectives 
This paper has following two main 
objectives: 
1. To estimate the poverty and growth 
trends as well as the poverty-growth 
elasticity across zones and sectors. 
2. To examine the factors that could 
explain the observed variations in 
poverty and growth and pro-poorness 
of growth.
Methodology 
The Data 
National Living Standard Survey 
(NLSS), 2003/04 and Harmonized 
Nigeria Living Standard Survey 
(HNLSS) 2009/2010 conducted by the 
National Bureau of Statistics (NBS).
Methodology 
Poverty Line: 
Dollar A Day Poverty Line converted to 
annual per capita income equivalent to 
NGN21608 per annum in 2003/04 and 
NGN54750 per annum in 2009/10 
1 USD=161.87 NGN 
1 Euro= 214.35 NGN
Methodology 
Shapley Decomposition 
• Ravallion-Huppi (Sectoral) 
Decomposition
Methodology 
Oaxaca-Blinder decomposition
Trends in Poverty and Growth in 
Nigeria 
Between 2004 and 2010, poverty level 
increased in Nigeria. The head count index 
has shown a rise from 56 per cent in 2004 to 
73.4 per cent in 2010 
Poverty rates are relatively higher in Northern 
zone and the rural sector as compared to the 
southern zone and the urban sector 
The Northern and rural sector also recorded 
relatively higher growth of per capita 
expenditure as compared to the southern 
zone and the urban sector 
CONVERGENCE?????
Household Income by Quintile 
Groups 
Top 20 per cent – 11.87 per cent 
Bottom 20 per cent – 0.78 per cent
Poverty-growth elasticity 
Across zones and the sectors, the 
average poverty growth elasticity is 
found to be negative but less than one 
The northern zones and the rural 
sectors have relatively lower poverty-growth 
elasticity compared to southern 
and urban sectors
Drivers of Pro-Poor Growth 
Inequality Effect (the Shapley 
Decomposition) 
With constant poverty lines, the 
poverty ratios declined between two 
periods 
The results show that the change in 
poverty is mainly due to growth effect 
The inequality seems to worsening the 
conditions as we have a positive value 
of the inequality effect.
Poverty Decomposition into Growth 
and Inequality 
Unit Poverty Growth Inequality 
change component component 
Nigeria -0.270 -0.597 0.326 
Sector 
Urban -0.303 -0.410 0.107 
Rural -0.287 -0.634 0.347 
Geopolitical Zone 
South-South -0.199 -0.371 0.173 
South-East -0.123 -0.466 0.343 
South-West -0.345 -0.410 0.065 
North-Central -0.361 -0.658 0.297 
North-East -0.274 -0.632 0.358 
North-West -0.259 -0.601 0.342
Population Shift Effect 
Proportion of population in rural areas 
increased from 55.8 per cent in 2004 
to 66.1 per cent in 2009-10 
The rural poverty increased by 6.7 per 
cent as compared to 4.5 per cent fall 
in urban poverty rates 
The effect of population shift effect is 
stronger in northern zones than in 
southern zones
Sectoral Decomposition of 
Change in Poverty 
Unit 
Population 
share in 
2004 
Population 
share in 
2010 
Intra-sectoral 
effect 
Population 
shift effect 
Interaction 
effect 
Poverty 
change 
Nigeria 1 1 -0.294 0.022 0.002 -0.27 
Sector 
urban 0.442 0.339 -0.134 -0.045 0.031 -0.148 
rural 0.558 0.661 -0.16 0.067 -0.029 -0.122
Question? 
The authors have suggested that the 
population is moving towards the rural 
areas as the poor in urban sector are 
finding it increasingly difficult to 
cope……and this is despite the fact 
that the urban poverty rates are lower 
than the rural poverty rates. WHY?? 
Explain the interaction effect
Effect of Human Capital and 
Structural Differences 
Decomposition of difference in income 
and poverty between zones 
Decomposition of difference in income 
and poverty between sectors
Decomposition of difference in log income 
between Zones (as percentage of total income 
differential)
Decomposition of Predicted Poverty between 
Zones (as percentage of poverty rate 
differential)
Explain?? 
The authors have derived that the 
contribution of human capital to 
income and poverty gap increased by 
99 and 77 percentage points 
respectively????
Decomposition of difference in log 
income between Sectors (as percentage 
of total income differential) 
2004 2010 
Characteristics 
component 
Structural 
component 
Characteristics 
component 
Structural 
component 
Age of household 
head 
0 19 0 -18 
House size 10 16 32 -1 
Gender of 
household head 
0 8 -1 23 
Zone 27 47 12 -3 
Education 28 119 29 -54 
Constant 0 -174 0 81 
Total 64 36 72 28
Decomposition of Predicted Poverty between Sectors 
(as percentage of poverty level differential)
Explain the following conclusions 
??? 
• Human capital which accounted for 147 
percent and 106 percent of the income 
and poverty gap in 2004, reduced 
sharply to 25 percent and 39 percent, 
respectively, in 2010. 
• The structural factors contribute 
significantly to sectoral growth and 
poverty gap in Nigeria, while the 
variations in human capital have no 
impact.
Summing Up 
Across zones, inequality, population 
shift and human capital were found to 
contribute significantly to the disparity 
in growth pro-poorness. 
Across sectors, inequality, population 
shift and structural differences are the 
main causes of disparity in growth pro-poorness.
Spatial and sectoral variations in 
growth pro-poorness contributed to 
the weak response of poverty to 
growth in Nigeria. 
It has been found that the zones and 
sectors with high poverty-growth 
elasticity have only experienced 
moderate growth, while poverty-growth 
elasticity is low in zones and 
sectors with high growth and poverty.
Case Poverty Line Latest 
Income 
Proportion 
below 
Poverty Line 
I Original Deflated Fall, rise 
II Latest Not deflated Fall, rise 
III Latest Deflate Rise 
IV Original Not deflated Fall

Session 6 b uneze's paper, session 6 b

  • 1.
    Explaining the Spatialand Sectoral Variations in Growth Pro-poorness in Nigeria Eberechukwu Uneze Adedeji Adeniran Centre for the Study of the Economies of Africa, Nigeria ___________________________________________ _ Discussant: Anupama Uppal Punjabi University, Patiala India
  • 2.
    Objectives This paperhas following two main objectives: 1. To estimate the poverty and growth trends as well as the poverty-growth elasticity across zones and sectors. 2. To examine the factors that could explain the observed variations in poverty and growth and pro-poorness of growth.
  • 3.
    Methodology The Data National Living Standard Survey (NLSS), 2003/04 and Harmonized Nigeria Living Standard Survey (HNLSS) 2009/2010 conducted by the National Bureau of Statistics (NBS).
  • 4.
    Methodology Poverty Line: Dollar A Day Poverty Line converted to annual per capita income equivalent to NGN21608 per annum in 2003/04 and NGN54750 per annum in 2009/10 1 USD=161.87 NGN 1 Euro= 214.35 NGN
  • 5.
    Methodology Shapley Decomposition • Ravallion-Huppi (Sectoral) Decomposition
  • 6.
  • 7.
    Trends in Povertyand Growth in Nigeria Between 2004 and 2010, poverty level increased in Nigeria. The head count index has shown a rise from 56 per cent in 2004 to 73.4 per cent in 2010 Poverty rates are relatively higher in Northern zone and the rural sector as compared to the southern zone and the urban sector The Northern and rural sector also recorded relatively higher growth of per capita expenditure as compared to the southern zone and the urban sector CONVERGENCE?????
  • 8.
    Household Income byQuintile Groups Top 20 per cent – 11.87 per cent Bottom 20 per cent – 0.78 per cent
  • 9.
    Poverty-growth elasticity Acrosszones and the sectors, the average poverty growth elasticity is found to be negative but less than one The northern zones and the rural sectors have relatively lower poverty-growth elasticity compared to southern and urban sectors
  • 10.
    Drivers of Pro-PoorGrowth Inequality Effect (the Shapley Decomposition) With constant poverty lines, the poverty ratios declined between two periods The results show that the change in poverty is mainly due to growth effect The inequality seems to worsening the conditions as we have a positive value of the inequality effect.
  • 11.
    Poverty Decomposition intoGrowth and Inequality Unit Poverty Growth Inequality change component component Nigeria -0.270 -0.597 0.326 Sector Urban -0.303 -0.410 0.107 Rural -0.287 -0.634 0.347 Geopolitical Zone South-South -0.199 -0.371 0.173 South-East -0.123 -0.466 0.343 South-West -0.345 -0.410 0.065 North-Central -0.361 -0.658 0.297 North-East -0.274 -0.632 0.358 North-West -0.259 -0.601 0.342
  • 12.
    Population Shift Effect Proportion of population in rural areas increased from 55.8 per cent in 2004 to 66.1 per cent in 2009-10 The rural poverty increased by 6.7 per cent as compared to 4.5 per cent fall in urban poverty rates The effect of population shift effect is stronger in northern zones than in southern zones
  • 13.
    Sectoral Decomposition of Change in Poverty Unit Population share in 2004 Population share in 2010 Intra-sectoral effect Population shift effect Interaction effect Poverty change Nigeria 1 1 -0.294 0.022 0.002 -0.27 Sector urban 0.442 0.339 -0.134 -0.045 0.031 -0.148 rural 0.558 0.661 -0.16 0.067 -0.029 -0.122
  • 14.
    Question? The authorshave suggested that the population is moving towards the rural areas as the poor in urban sector are finding it increasingly difficult to cope……and this is despite the fact that the urban poverty rates are lower than the rural poverty rates. WHY?? Explain the interaction effect
  • 15.
    Effect of HumanCapital and Structural Differences Decomposition of difference in income and poverty between zones Decomposition of difference in income and poverty between sectors
  • 16.
    Decomposition of differencein log income between Zones (as percentage of total income differential)
  • 17.
    Decomposition of PredictedPoverty between Zones (as percentage of poverty rate differential)
  • 18.
    Explain?? The authorshave derived that the contribution of human capital to income and poverty gap increased by 99 and 77 percentage points respectively????
  • 19.
    Decomposition of differencein log income between Sectors (as percentage of total income differential) 2004 2010 Characteristics component Structural component Characteristics component Structural component Age of household head 0 19 0 -18 House size 10 16 32 -1 Gender of household head 0 8 -1 23 Zone 27 47 12 -3 Education 28 119 29 -54 Constant 0 -174 0 81 Total 64 36 72 28
  • 20.
    Decomposition of PredictedPoverty between Sectors (as percentage of poverty level differential)
  • 21.
    Explain the followingconclusions ??? • Human capital which accounted for 147 percent and 106 percent of the income and poverty gap in 2004, reduced sharply to 25 percent and 39 percent, respectively, in 2010. • The structural factors contribute significantly to sectoral growth and poverty gap in Nigeria, while the variations in human capital have no impact.
  • 22.
    Summing Up Acrosszones, inequality, population shift and human capital were found to contribute significantly to the disparity in growth pro-poorness. Across sectors, inequality, population shift and structural differences are the main causes of disparity in growth pro-poorness.
  • 23.
    Spatial and sectoralvariations in growth pro-poorness contributed to the weak response of poverty to growth in Nigeria. It has been found that the zones and sectors with high poverty-growth elasticity have only experienced moderate growth, while poverty-growth elasticity is low in zones and sectors with high growth and poverty.
  • 24.
    Case Poverty LineLatest Income Proportion below Poverty Line I Original Deflated Fall, rise II Latest Not deflated Fall, rise III Latest Deflate Rise IV Original Not deflated Fall