Download to read offline


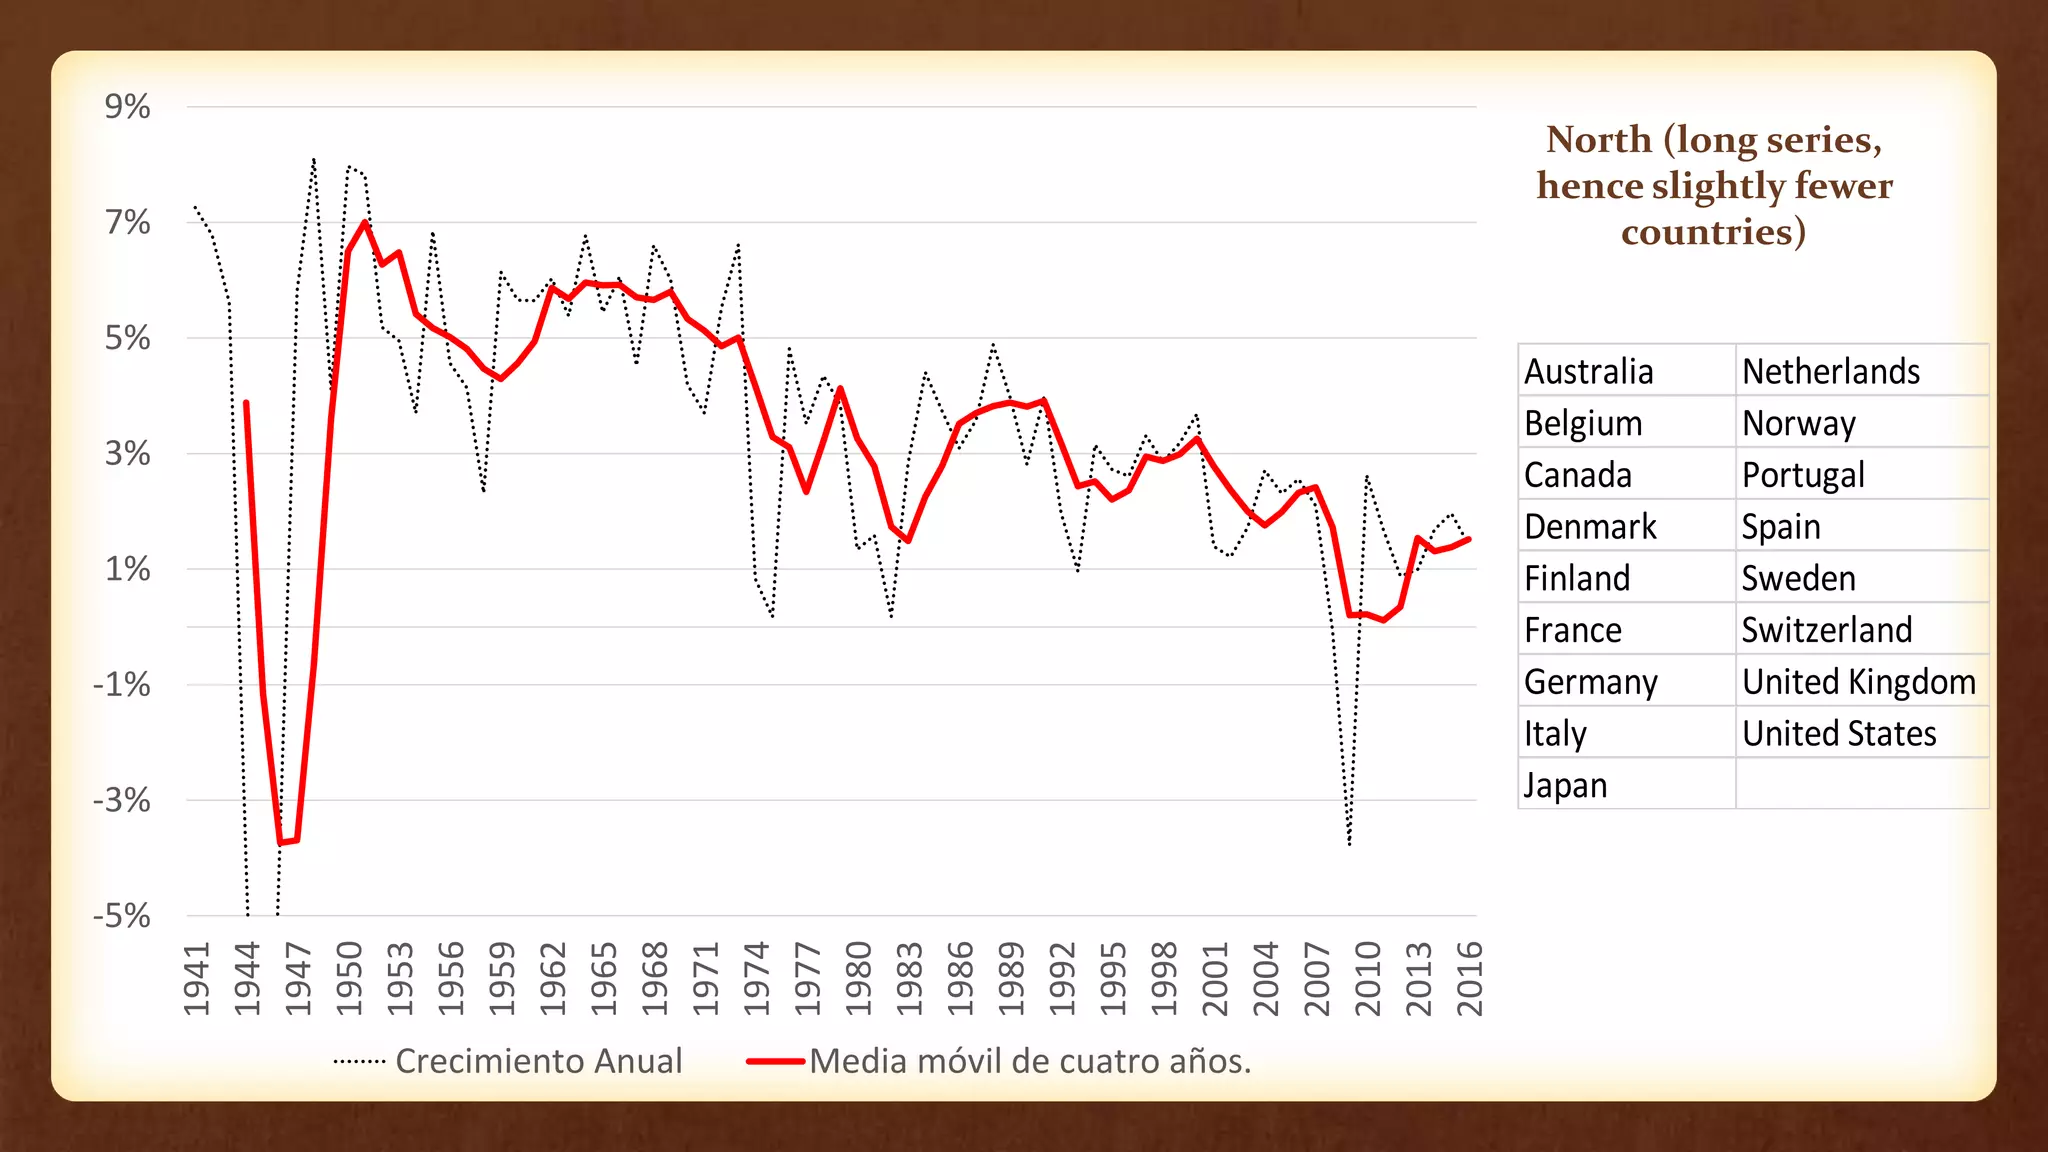


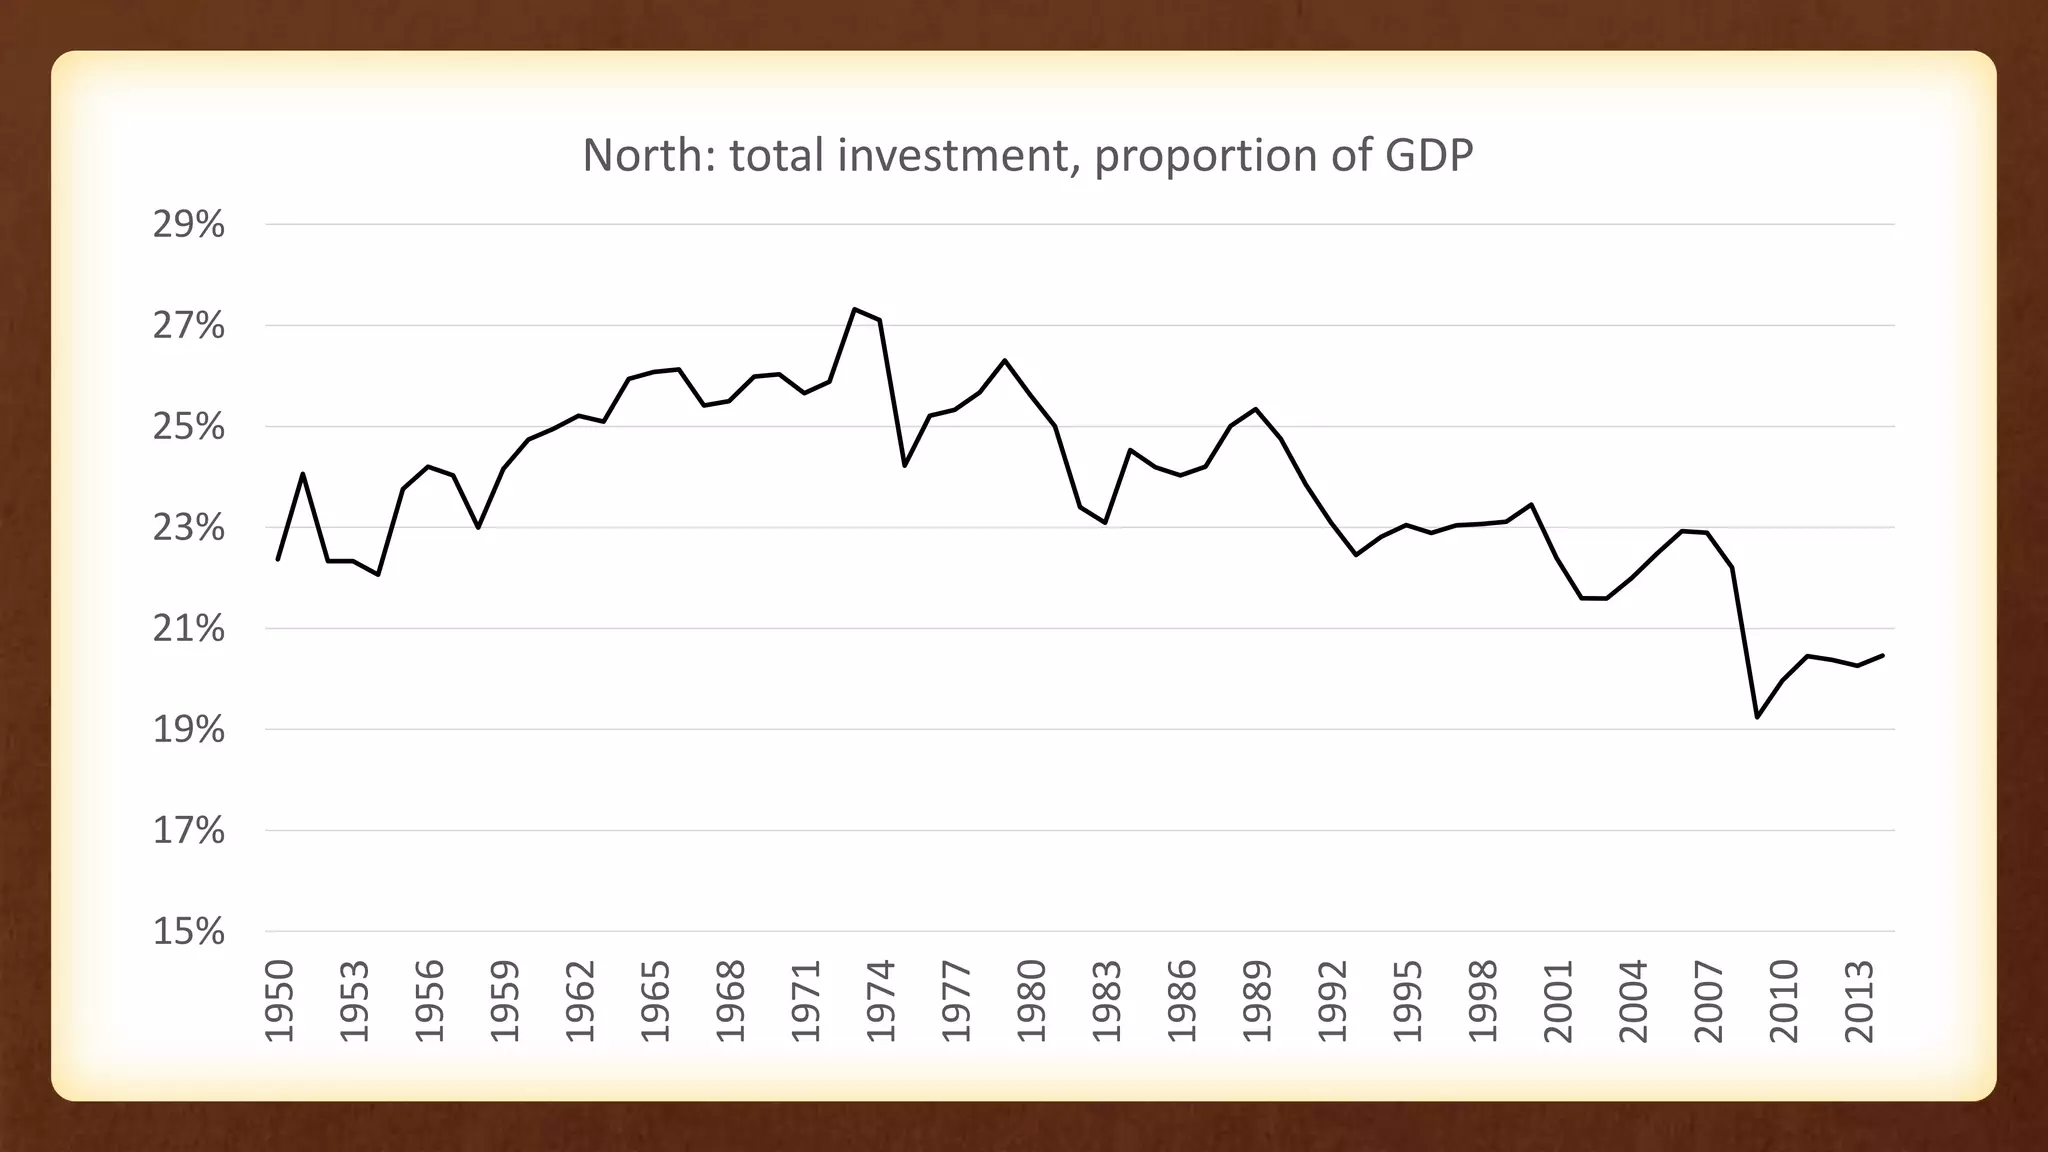


The document discusses the economic divergence between the 'North' (advanced economies) and the 'South' (developing nations), emphasizing how neoliberal policies have failed to solve problems for the North at the South's expense. It outlines key economic indicators and trends showing the persistent inequality and stagnation in growth in the South, leading to a decline in standards of living and a lack of recovery since the 1970s. The author critiques the myths surrounding economic recovery and convergence, highlighting the need for political action and development strategies in the South.


![Economics presentation1[1]](https://cdn.slidesharecdn.com/ss_thumbnails/economicspresentation11-131216075459-phpapp01-thumbnail.jpg?width=640&height=640&fit=bounds)


