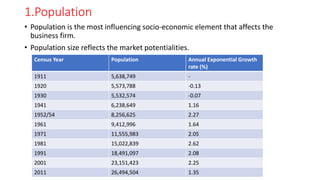
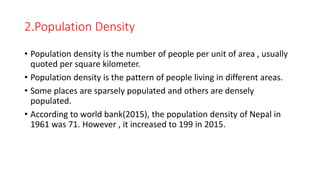
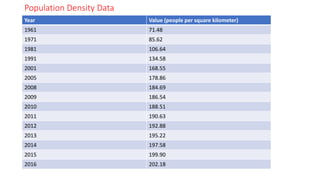
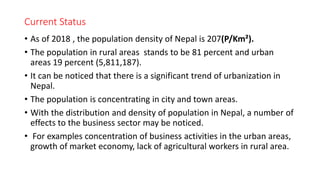
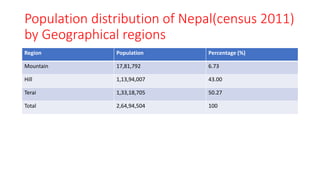
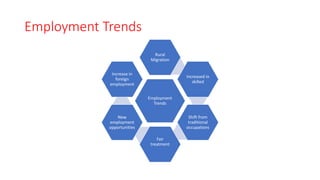
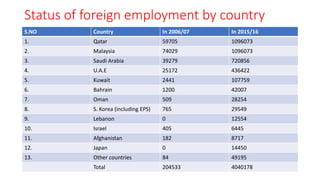
Socio-Economic Dimensions
The socio-economic dimension indicates the demographic features
which affect the economy directly or indirectly. Some of the important
variables to reflect the socio-economic dimension in Nepal are :
1.Population
2.Population Density
3.Age and sex structure
4.Employment trends
5.Labour Market Issues
6.Migration and Foreign Employment
1.Population
• Population is the most influencing socio-economic element that affects the
business firm.
• Population size reflects the market potentialities.
Census Year Population Annual Exponential Growth
rate (%)
1911 5,638,749 -
1920 5,573,788 -0.13
1930 5,532,574 -0.07
1941 6,238,649 1.16
1952/54 8,256,625 2.27
1961 9,412,996 1.64
1971 11,555,983 2.05
1981 15,022,839 2.62
1991 18,491,097 2.08
2001 23,151,423 2.25
2011 26,494,504 1.35
2011-Present
Year Population Male Female
2011 26,494,504 12,849,041 13,645,463
2012 26,875,445 13,032,023 13,843,422
2013 27,264,592 13,219,533 14,045,059
2014 27,660,775 13,411,039 14,249,736
2015 28,062,832 13,605,956 14,456,875
2016 28,469,460 13,803,646 14,665,815
2017 28,879,636 14,003,583 14,876,054
2018 29,291,746 14,204,970 15,086,776
Central Bureau Of Statistics
Population Projection
Year Population Male Female
2019 29,704,501 14,407,174 15,297,327
2020 30,116,424 14,609,422 15,507,003
2021 30,526,143 14,810,977 15,715,165
2022 30,931,387 15,010,639 15,920,747
2023 31,330,247 15,207,394 16,122,853
2024 31,721,524 15,400,599 16,320,925
2025 32,104,281 15,589,750 16,514,530
2026 32,477,618 15,774,368 16,703,251
2027 32,840,509 15,953,903 16,886,606
2.Population Density
• Population density is the number of people per unit of area , usually
quoted per square kilometer.
• Population density is the pattern of people living in different areas.
• Some places are sparsely populated and others are densely
populated.
• According to world bank(2015), the population density of Nepal in
1961 was 71. However , it increased to 199 in 2015.
Population Density Data
Year Value (people per square kilometer)
1961 71.48
1971 85.62
1981 106.64
1991 134.58
2001 168.55
2005 178.86
2008 184.69
2009 186.54
2010 188.51
2011 190.63
2012 192.88
2013 195.22
2014 197.58
2015 199.90
2016 202.18
Current Status
• As of 2018 , the population density of Nepal is 207(P/Km²).
• The population in rural areas stands to be 81 percent and urban
areas 19 percent (5,811,187).
• It can be noticed that there is a significant trend of urbanization in
Nepal.
• The population is concentrating in city and town areas.
• With the distribution and density of population in Nepal, a number of
effects to the business sector may be noticed.
• For examples concentration of business activities in the urban areas,
growth of market economy, lack of agricultural workers in rural area.
Population distribution of Nepal(census 2011)
by Geographical regions
Region Population Percentage (%)
Mountain 17,81,792 6.73
Hill 1,13,94,007 43.00
Terai 1,33,18,705 50.27
Total 2,64,94,504 100
3.Age and Sex Structure
• A business has great concern over age and sex structure of the
population.
• It is the base of market segmentation to formulate marketing and
other strategies by focusing on the target customers as male or
female , young or old , etc.
As of beginning of 2018
Age Male Female Percentage(%)
Under 15 5,172,133 4,978,930 34.6
Age from 15-64 8,598,690 9,335,091 61.1
65+ 596,931 680,613 4.4
• Median age 23.2 years
• Sex ratio 0.98(14,662,281 men to 14,898,573 women)
• Life expectancy 66.2 years (64.9 men ,67.4 women)
Age dependency Ratio
• Dependency Ratio of a population is a ratio of people who are
generally not in labor force (the dependents) to workforce of a
country ( the productive part of population).
• The dependent part includes the population under 15 and over 64.
• The productive part of population accordingly consists of population
between 15 to 64 years.
• The total dependency ratio of population in Nepal is 63.7%.
• Child dependency ratio is 56.6%.
• Aged dependency ratio is 7.1%.
4.Employment Trends
• With the increase in cost of living and desire of better facilities ,
people see for employment.
• It is the main source of livelihood for people.
• Employment condition is one of the indicators of economic
development of a country.
• Labor force in Nepal is gradually shifting from agricultural sector to
other sectors mainly in service sectors.
Employment Trends
Employment
Trends
Rural
Migration
Increased in
skilled
Shift from
traditional
occupations
Fair
treatment
New
employment
opportunities
Increase in
foreign
employment
5.Labour Market Issues
• Labour market is where workers seeking jobs and employers interact each
other.
• Simply , it refers to demand and supply for labour.
• The labour market determines the allocation of labour and its costs.
• There are many issues governing labour market in Nepal and they are:
1.Employment dominated by agriculture sector
2.Higher number of women in labour force
3.A slight decline in labour force participation rate
4.Increase in unemployment rate
5.Low labour productivity
6.Migration for foreign employment
7.Pervalence of child labour
8.High dependency on informal sector
6.Migration and foreign employment
• Migration is the movement of person or group of people to settle in
another place.
• Migration can be both internal or external, temporal or permanent.
• People migrate for several purposes that may be security, education ,
employment, better facilities.
• There is high tendency of migration in Nepal.
• People living in Himalayan and hilly region migrate to terai in search
of better opportunities and living standard.
Foreign employment
• Foreign employment is the main reason of international migration
from Nepal.
• More than 3.8 million permits to work abroad (excluding India) were
issued by the government during the 1993/94-2014/15 fiscal years,
which represent almost 14 percent of the population.
• There has been huge increase in inflow of remittances, from 58.6
billion rupees in 2003/04 to NRP 589.5 billion in 2014/15.
• According to world bank , Nepal holds the second position among the
countries to receive highest proportion of remittance to GDP in 2016.
• Therefore remittance is a major contributor to development financing
in Nepal.
Status of foreign employment by country
S.NO Country In 2006/07 In 2015/16
1. Qatar 59705 1096073
2. Malaysia 74029 1096073
3. Saudi Arabia 39279 720856
4. U.A.E 25172 436422
5. Kuwait 2441 107759
6. Bahrain 1200 42007
7. Oman 509 28254
8. S. Korea (including EPS) 765 29549
9. Lebanon 0 12554
10. Israel 405 6445
11. Afghanistan 182 8717
12. Japan 0 14450
13. Other countries 84 49195
Total 204533 4040178

Socio economic dimensions

  • 1.
    Socio-Economic Dimensions The socio-economicdimension indicates the demographic features which affect the economy directly or indirectly. Some of the important variables to reflect the socio-economic dimension in Nepal are : 1.Population 2.Population Density 3.Age and sex structure 4.Employment trends 5.Labour Market Issues 6.Migration and Foreign Employment
  • 2.
    1.Population • Population isthe most influencing socio-economic element that affects the business firm. • Population size reflects the market potentialities. Census Year Population Annual Exponential Growth rate (%) 1911 5,638,749 - 1920 5,573,788 -0.13 1930 5,532,574 -0.07 1941 6,238,649 1.16 1952/54 8,256,625 2.27 1961 9,412,996 1.64 1971 11,555,983 2.05 1981 15,022,839 2.62 1991 18,491,097 2.08 2001 23,151,423 2.25 2011 26,494,504 1.35
  • 3.
    2011-Present Year Population MaleFemale 2011 26,494,504 12,849,041 13,645,463 2012 26,875,445 13,032,023 13,843,422 2013 27,264,592 13,219,533 14,045,059 2014 27,660,775 13,411,039 14,249,736 2015 28,062,832 13,605,956 14,456,875 2016 28,469,460 13,803,646 14,665,815 2017 28,879,636 14,003,583 14,876,054 2018 29,291,746 14,204,970 15,086,776 Central Bureau Of Statistics
  • 4.
    Population Projection Year PopulationMale Female 2019 29,704,501 14,407,174 15,297,327 2020 30,116,424 14,609,422 15,507,003 2021 30,526,143 14,810,977 15,715,165 2022 30,931,387 15,010,639 15,920,747 2023 31,330,247 15,207,394 16,122,853 2024 31,721,524 15,400,599 16,320,925 2025 32,104,281 15,589,750 16,514,530 2026 32,477,618 15,774,368 16,703,251 2027 32,840,509 15,953,903 16,886,606
  • 5.
    2.Population Density • Populationdensity is the number of people per unit of area , usually quoted per square kilometer. • Population density is the pattern of people living in different areas. • Some places are sparsely populated and others are densely populated. • According to world bank(2015), the population density of Nepal in 1961 was 71. However , it increased to 199 in 2015.
  • 6.
    Population Density Data YearValue (people per square kilometer) 1961 71.48 1971 85.62 1981 106.64 1991 134.58 2001 168.55 2005 178.86 2008 184.69 2009 186.54 2010 188.51 2011 190.63 2012 192.88 2013 195.22 2014 197.58 2015 199.90 2016 202.18
  • 7.
    Current Status • Asof 2018 , the population density of Nepal is 207(P/Km²). • The population in rural areas stands to be 81 percent and urban areas 19 percent (5,811,187). • It can be noticed that there is a significant trend of urbanization in Nepal. • The population is concentrating in city and town areas. • With the distribution and density of population in Nepal, a number of effects to the business sector may be noticed. • For examples concentration of business activities in the urban areas, growth of market economy, lack of agricultural workers in rural area.
  • 8.
    Population distribution ofNepal(census 2011) by Geographical regions Region Population Percentage (%) Mountain 17,81,792 6.73 Hill 1,13,94,007 43.00 Terai 1,33,18,705 50.27 Total 2,64,94,504 100
  • 9.
    3.Age and SexStructure • A business has great concern over age and sex structure of the population. • It is the base of market segmentation to formulate marketing and other strategies by focusing on the target customers as male or female , young or old , etc.
  • 10.
    As of beginningof 2018 Age Male Female Percentage(%) Under 15 5,172,133 4,978,930 34.6 Age from 15-64 8,598,690 9,335,091 61.1 65+ 596,931 680,613 4.4
  • 11.
    • Median age23.2 years • Sex ratio 0.98(14,662,281 men to 14,898,573 women) • Life expectancy 66.2 years (64.9 men ,67.4 women) Age dependency Ratio • Dependency Ratio of a population is a ratio of people who are generally not in labor force (the dependents) to workforce of a country ( the productive part of population). • The dependent part includes the population under 15 and over 64. • The productive part of population accordingly consists of population between 15 to 64 years. • The total dependency ratio of population in Nepal is 63.7%. • Child dependency ratio is 56.6%. • Aged dependency ratio is 7.1%.
  • 12.
    4.Employment Trends • Withthe increase in cost of living and desire of better facilities , people see for employment. • It is the main source of livelihood for people. • Employment condition is one of the indicators of economic development of a country. • Labor force in Nepal is gradually shifting from agricultural sector to other sectors mainly in service sectors.
  • 13.
    Employment Trends Employment Trends Rural Migration Increased in skilled Shiftfrom traditional occupations Fair treatment New employment opportunities Increase in foreign employment
  • 14.
    5.Labour Market Issues •Labour market is where workers seeking jobs and employers interact each other. • Simply , it refers to demand and supply for labour. • The labour market determines the allocation of labour and its costs. • There are many issues governing labour market in Nepal and they are: 1.Employment dominated by agriculture sector 2.Higher number of women in labour force 3.A slight decline in labour force participation rate 4.Increase in unemployment rate 5.Low labour productivity 6.Migration for foreign employment 7.Pervalence of child labour 8.High dependency on informal sector
  • 15.
    6.Migration and foreignemployment • Migration is the movement of person or group of people to settle in another place. • Migration can be both internal or external, temporal or permanent. • People migrate for several purposes that may be security, education , employment, better facilities. • There is high tendency of migration in Nepal. • People living in Himalayan and hilly region migrate to terai in search of better opportunities and living standard.
  • 16.
    Foreign employment • Foreignemployment is the main reason of international migration from Nepal. • More than 3.8 million permits to work abroad (excluding India) were issued by the government during the 1993/94-2014/15 fiscal years, which represent almost 14 percent of the population. • There has been huge increase in inflow of remittances, from 58.6 billion rupees in 2003/04 to NRP 589.5 billion in 2014/15. • According to world bank , Nepal holds the second position among the countries to receive highest proportion of remittance to GDP in 2016. • Therefore remittance is a major contributor to development financing in Nepal.
  • 17.
    Status of foreignemployment by country S.NO Country In 2006/07 In 2015/16 1. Qatar 59705 1096073 2. Malaysia 74029 1096073 3. Saudi Arabia 39279 720856 4. U.A.E 25172 436422 5. Kuwait 2441 107759 6. Bahrain 1200 42007 7. Oman 509 28254 8. S. Korea (including EPS) 765 29549 9. Lebanon 0 12554 10. Israel 405 6445 11. Afghanistan 182 8717 12. Japan 0 14450 13. Other countries 84 49195 Total 204533 4040178