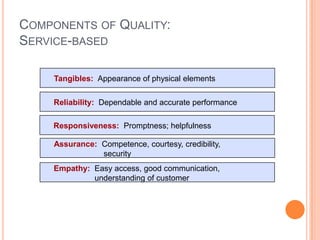
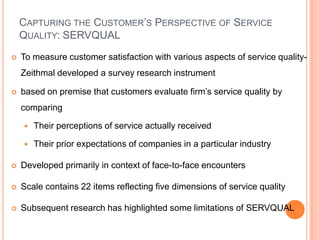
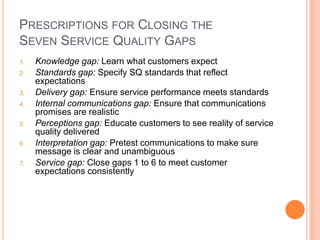
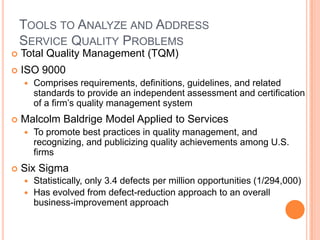
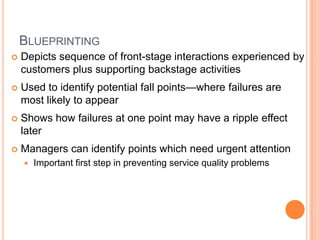
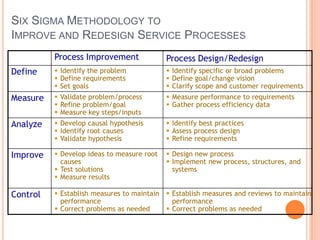
This document discusses improving service quality and productivity. It defines service quality and describes tools for measuring it, including SERVQUAL. The Gaps Model identifies seven gaps between customer expectations and perceptions and how to address them. Key tools for measuring and improving productivity are also outlined, such as fishbone diagrams, Pareto charts, blueprinting, and Six Sigma. Both soft and hard measures are important for quality, and strategies like process redesign and customer involvement can boost productivity.
Service quality and customer satisfaction are integral components of today's customer service world. Both of the attributes are inter-related to each other and combination of which appreciates the efficiency of a process.
This is a compilation of introductory notes on Service Marketing with emphasis on meaning, evolution, universal nature of services, challenges to delivering services and finally basic insights into 7Ps of marketing from the perspectives of marketing of services.
The purpose of this presentation is to obtain a better understanding of the extent to which service quality is delivered within the service sector service by drawing on front-line employees (FLE) and customer perceptions of service quality. The PPT shown how closely customer expectations of service and FLE perceptions of customer expectations match. SERVQUAL is used to measure service quality amongst FLE and customers in a major service sector department.
Significance of Service quality is very important for the success of a service company :
1. To win credibility & get repeat customers : If a company offers quality service consistently, It enjoys repeat business, i.e., customers visit it repeatedly. They may even refer it to their friends & relatives and provide positive word-of-mouth publicity to the quality service offered by the company.
2. To charge premium price : When a company offers superior quality service, compared to its competitors, customers who value quality will always prefer this company to other players in the market. So, the company will be in a position to charge a premium price from customers.
According to Berry & A Parasuraman, service quality is determined by customers using various criteria like credibility, security, access, communications, tangibles, responsiveness, reliability, competence, courtesy, tangibles, understanding, etc. Gronoos also suggested another list of criteria as professionalism & skills, attitude & behaviour, accessibility & flexibility, reliability & trustworthiness, reputation & credibility, and recovery. Since some of these factors are similar or overlapping, the authors have consolidated these into five distinct dimensions,
These dimensions represent how consumers organise information about service quality in their minds. These five dimensions were found relevant for banking, insurance, appliances repair, & maintenance, securities brokerage, long distance tele-service, auto repair service, & others. The dimensions are also applicable to retail & business services. This can be logically extended to internal services as well.
Total Quality Management in HealthcareGunjan Patel
Â
Now days, Healthcare systems are of fundamental interests to all level of Hospitals in our societies. Eventually, increasing importance and reliance are placed on total quality management in healthcare systems. Due to this rising importance that is also reflected in the increasing percentage of national and international resources for both private and public sector to allocated in hospital management systems. Hospitals and other healthcare organization across the globe have been progressively implementing TQM to reduce costs, improve efficiency and provide high quality patient care.
Measure Customer and Business Feedback to Drive ImprovementTechWell
Â
Companies often go to great lengths to collect metrics. However, even the most rigorously collected data tends to be ignored, despite the findings and potential for improving practices. Today, one metric that cannot be ignored is customer satisfaction. Customers are more than willing to share their thoughts in a manner that can impact your bottom line. Social media gives consumers a stronger voice than ever, and damage to your brand is only one tweet away. The question is: Are you listening to your customers? Paul Fratellone helps you break down current process metrics so you can build them back up with business and customer value at the forefront. With feedback on how well you are attaining your objectives, you can create a powerful action plan for change that will receive the attention it deserves. If you are serious about improving the value of your projects to the business, join this session and let the right data drive your improvement actions.
RMD24 | Retail media: hoe zet je dit in als je geen AH of Unilever bent? Heid...BBPMedia1
Â
Grote partijen zijn al een tijdje onderweg met retail media. Ondertussen worden in dit domein ook de kansen zichtbaar voor andere spelers in de markt. Maar met die kansen ontstaan ook vragen: Zelf retail media worden of erop adverteren? In welke fase van de funnel past het en hoe integreer je het in een mediaplan? Wat is nu precies het verschil met marketplaces en Programmatic ads? In dit half uur beslechten we de dilemma's en krijg je antwoorden op wanneer het voor jou tijd is om de volgende stap te zetten.
Enterprise Excellence is Inclusive Excellence.pdfKaiNexus
Â
Enterprise excellence and inclusive excellence are closely linked, and real-world challenges have shown that both are essential to the success of any organization. To achieve enterprise excellence, organizations must focus on improving their operations and processes while creating an inclusive environment that engages everyone. In this interactive session, the facilitator will highlight commonly established business practices and how they limit our ability to engage everyone every day. More importantly, though, participants will likely gain increased awareness of what we can do differently to maximize enterprise excellence through deliberate inclusion.
What is Enterprise Excellence?
Enterprise Excellence is a holistic approach that's aimed at achieving world-class performance across all aspects of the organization.
What might I learn?
A way to engage all in creating Inclusive Excellence. Lessons from the US military and their parallels to the story of Harry Potter. How belt systems and CI teams can destroy inclusive practices. How leadership language invites people to the party. There are three things leaders can do to engage everyone every day: maximizing psychological safety to create environments where folks learn, contribute, and challenge the status quo.
Who might benefit? Anyone and everyone leading folks from the shop floor to top floor.
Dr. William Harvey is a seasoned Operations Leader with extensive experience in chemical processing, manufacturing, and operations management. At Michelman, he currently oversees multiple sites, leading teams in strategic planning and coaching/practicing continuous improvement. William is set to start his eighth year of teaching at the University of Cincinnati where he teaches marketing, finance, and management. William holds various certifications in change management, quality, leadership, operational excellence, team building, and DiSC, among others.
Personal Brand Statement:
As an Army veteran dedicated to lifelong learning, I bring a disciplined, strategic mindset to my pursuits. I am constantly expanding my knowledge to innovate and lead effectively. My journey is driven by a commitment to excellence, and to make a meaningful impact in the world.
Buy Verified PayPal Account | Buy Google 5 Star Reviewsusawebmarket
Â
Buy Verified PayPal Account
Looking to buy verified PayPal accounts? Discover 7 expert tips for safely purchasing a verified PayPal account in 2024. Ensure security and reliability for your transactions.
PayPal Services Features-
🟢 Email Access
🟢 Bank Added
🟢 Card Verified
🟢 Full SSN Provided
🟢 Phone Number Access
🟢 Driving License Copy
🟢 Fasted Delivery
Client Satisfaction is Our First priority. Our services is very appropriate to buy. We assume that the first-rate way to purchase our offerings is to order on the website. If you have any worry in our cooperation usually You can order us on Skype or Telegram.
24/7 Hours Reply/Please Contact
usawebmarketEmail: support@usawebmarket.com
Skype: usawebmarket
Telegram: @usawebmarket
WhatsApp: +1‪(218) 203-5951‬
USA WEB MARKET is the Best Verified PayPal, Payoneer, Cash App, Skrill, Neteller, Stripe Account and SEO, SMM Service provider.100%Satisfection granted.100% replacement Granted.
What is the TDS Return Filing Due Date for FY 2024-25.pdfseoforlegalpillers
Â
It is crucial for the taxpayers to understand about the TDS Return Filing Due Date, so that they can fulfill your TDS obligations efficiently. Taxpayers can avoid penalties by sticking to the deadlines and by accurate filing of TDS. Timely filing of TDS will make sure about the availability of tax credits. You can also seek the professional guidance of experts like Legal Pillers for timely filing of the TDS Return.
The world of search engine optimization (SEO) is buzzing with discussions after Google confirmed that around 2,500 leaked internal documents related to its Search feature are indeed authentic. The revelation has sparked significant concerns within the SEO community. The leaked documents were initially reported by SEO experts Rand Fishkin and Mike King, igniting widespread analysis and discourse. For More Info:- https://news.arihantwebtech.com/search-disrupted-googles-leaked-documents-rock-the-seo-world/
Taurus Zodiac Sign_ Personality Traits and Sign Dates.pptxmy Pandit
Â
Explore the world of the Taurus zodiac sign. Learn about their stability, determination, and appreciation for beauty. Discover how Taureans' grounded nature and hardworking mindset define their unique personality.
2. LEARNING OBJECTIVES
ï‚¢ Define service quality
ï‚¢ Diagnose service quality problems using The Gaps
Measuring and improving service quality
ï‚¢ Explore key tools for measuring and improving
productivity
4. COMPONENTS OF QUALITY:
SERVICE-BASED
Tangibles: Appearance of physical elements
Reliability: Dependable and accurate performance
Responsiveness: Promptness; helpfulness
Assurance: Competence, courtesy, credibility,
security
Empathy: Easy access, good communication,
understanding of customer
5. CAPTURING THE CUSTOMER’S PERSPECTIVE OF SERVICE
QUALITY: SERVQUAL
ï‚¢ To measure customer satisfaction with various aspects of service quality-
Zeithmal developed a survey research instrument
 based on premise that customers evaluate firm’s service quality by
comparing
ï‚— Their perceptions of service actually received
ï‚— Their prior expectations of companies in a particular industry
ï‚¢ Developed primarily in context of face-to-face encounters
ï‚¢ Scale contains 22 items reflecting five dimensions of service quality
ï‚¢ Subsequent research has highlighted some limitations of SERVQUAL
6. SERVQUAL
ï‚¢ Respondents complete a series of scales that
measure their expectations of companies in a
particular industry on a wide array of service
characteristics
ï‚¢ Susbsequently they are asked to record their
perceptions of a specific company whose services
they have used
ï‚¢ When perceived performance ratings are lower
than expectations =poor quality
ï‚¢ Reverse= good quality
7. OTHER CONSIDERATIONS IN
SERVICE QUALITY MEASUREMENT
ï‚¢ In uncompetitive markets or in situations where
customers do not have a free choice, researchers
should use needs or wants as comparison
standards
ï‚— Time constraints
ï‚¢ Services high in credence characteristics may
cause consumers to use process factors and
tangible cues as proxies to evaluate quality—halo
effect
 Process factors: Customers’ feelings
8. The Gaps Model—A Conceptual Tool to
Identify and Correct Service Quality
Problems
9. SEVEN SERVICE QUALITY GAPS
(FIG 14.3)
Customer experience
relative to expectations
1. Knowledge Gap
2. Standards Gap
3. Delivery Gap
5. Perceptions Gap
7. Service Gap
Customer needs and
expectations
6. Interpretation Gap
4. Internal
Communications Gap
MANAGEMENT
CUSTOMER
4.
Customer perceptions
of service execution
Management definition
of these needs
Translation into
design/delivery specs
Execution of
design/delivery specs
Advertising and sales
promises
Customer interpretation
of communications
10. PRESCRIPTIONS FOR CLOSING THE
SEVEN SERVICE QUALITY GAPS
1. Knowledge gap: Learn what customers expect
2. Standards gap: Specify SQ standards that reflect
expectations
3. Delivery gap: Ensure service performance meets standards
4. Internal communications gap: Ensure that communications
promises are realistic
5. Perceptions gap: Educate customers to see reality of service
quality delivered
6. Interpretation gap: Pretest communications to make sure
message is clear and unambiguous
7. Service gap: Close gaps 1 to 6 to meet customer
expectations consistently
12. SOFT AND HARD MEASURES
OF SERVICE QUALITY
 Soft measures—not easily observed, must be collected by
talking to customers, employees, or others
ï‚— Provide direction, guidance, and feedback to employees on ways
to achieve customer satisfaction
ï‚— Can be quantified by measuring customer perceptions and beliefs
ï‚¢ For example: SERVQUAL, surveys, and customer advisory panels
 Hard measures—can be counted, timed, or measured
through audits
ï‚— Typically operational processes or outcomes
ï‚— Standards often set with reference to percentage of occasions on
which a particular measure is achieved
ï‚— Control charts are useful for displaying performance over time
against specific quality standards
13. COMPOSITION OF FEDEX’S
SERVICE QUALITY INDEX—SQI (TABLE 14.4)
Late delivery—right day
Late Delivery—wrong day
Tracing request unanswered
Complaints reopened
Missing proofs of delivery
Invoice adjustments
Missed pickups
Lost packages
Damaged packages
Aircraft delays (minutes)
Overcharged (packages missing label)
Abandoned calls
1
5
1
5
1
1
10
10
10
5
5
1
Failure Type
Total Failure Points (SQI) =
Weighting
Factor
XXX,XXX
Daily
Points
X
Number of
Incidents
=
Source: See Services Marketing textbook, page 417,
for full source information.
14. CONTROL CHART FOR DEPARTURE DELAYS
(FIG 14.3)
J F M A M J J A S O N D
60%
70%
80%
90%
100%
Month
% Flights Departing Within
15 Minutes of Schedule
15. TOOLS TO ANALYZE AND ADDRESS
SERVICE QUALITY PROBLEMS
ï‚¢ Fishbone diagram
ï‚— Cause-and-effect diagram to identify potential causes of problems
ï‚¢ Pareto Chart
ï‚— Separating the trivial from the important. Often, a majority of
problems is caused by a minority of causes (i.e. the 80/20 rule)
ï‚¢ Blueprinting
ï‚— Visualization of service delivery, identifying points where failures
are most likely to occur
16. TOOLS TO ANALYZE AND ADDRESS
SERVICE QUALITY PROBLEMS
ï‚¢ Total Quality Management (TQM)
ï‚¢ ISO 9000
ï‚— Comprises requirements, definitions, guidelines, and related
standards to provide an independent assessment and certification
of a firm’s quality management system
ï‚¢ Malcolm Baldrige Model Applied to Services
ï‚— To promote best practices in quality management, and
recognizing, and publicizing quality achievements among U.S.
firms
ï‚¢ Six Sigma
ï‚— Statistically, only 3.4 defects per million opportunities (1/294,000)
ï‚— Has evolved from defect-reduction approach to an overall
business-improvement approach
17. CAUSE-AND-EFFECT CHART FOR
FLIGHT DEPARTURE DELAYS (FIG 14.4)
Aircraft late to
gate
Late food
service
Late fuel
Late cabin
cleaners
Poor announcement of
departures
Weight and balance
sheet late
Delayed
Departures
Delayed check-in
procedure
Acceptance of late
passengers
Facilities,
Equipment
Front-Stage
Personnel
Procedures
Materials,
Supplies
Customers
Gate agents
cannot process
fast enough
Late/unavailable
airline crew
Arrive late
Oversized bags
Weather
Air traffic
Frontstage
Personnel
Procedures
Materials,
Supplies
Backstage
Personnel
Information
Customers
Other Causes
Mechanical
Failures
Late pushback
Late baggage
18. Late passengers
Waiting for pushback
Waiting for
fuelling
Late weight and balance sheet
Late cabin cleaning/supplies
Other
Newark
All stations, excluding
Chicago-Midway Hub
Washington Natl.
23.1%
23.1%
23.1%15.3%
15.4%
53.3%
15%
11.3%
8.7%
11.7%
33.3%
33.3%
19%
9.5%
4.9
%
Case: Analysis of Causes of
Flight Departure Delays
19. BLUEPRINTING
ï‚¢ Depicts sequence of front-stage interactions experienced by
customers plus supporting backstage activities
 Used to identify potential fall points—where failures are
most likely to appear
ï‚¢ Shows how failures at one point may have a ripple effect
later
ï‚¢ Managers can identify points which need urgent attention
ï‚— Important first step in preventing service quality problems
20. SIX SIGMA METHODOLOGY TO
IMPROVE AND REDESIGN SERVICE PROCESSES
Process Improvement Process Design/Redesign
Define  Identify the problem
 Define requirements
 Set goals
 Identify specific or broad problems
 Define goal/change vision
 Clarify scope and customer requirements
Measure  Validate problem/process
 Refine problem/goal
 Measure key steps/inputs
 Measure performance to requirements
 Gather process efficiency data
Analyze  Develop causal hypothesis
 Identify root causes
 Validate hypothesis
 Identify best practices
 Assess process design
 Refine requirements
Improve  Develop ideas to measure root
causes
 Test solutions
 Measure results
 Design new process
 Implement new process, structures, and
systems
Control  Establish measures to maintain
performance
 Correct problems as needed
 Establish measures and reviews to maintain
performance
 Correct problems as needed
21. TQM IN A SERVICE CONTEXT:
TWELVE CRITICAL DIMENSIONS FOR IMPLEMENTATION
ï‚¢ Top management commitment and visionary leadership
ï‚¢ Human resource management
ï‚¢ Technical system, including service process design and process
management
ï‚¢ Information and analysis system
ï‚¢ Benchmarking
ï‚¢ Continuous improvement
ï‚¢ Customer focus
ï‚¢ Employee satisfaction
ï‚¢ Union intervention and employee relations
ï‚¢ Social responsibility
ï‚¢ Servicescapes
ï‚¢ Service culture
22. RETURN ON QUALITY (ROQ)
ï‚¢ Assess costs and benefits of quality initiatives
ï‚— ROQ approach is based on four assumptions:
– Quality is an investment
– Quality efforts must be financially accountable
– It’s possible to spend too much on quality
– Not all quality expenditures are equally valid
ï‚— Implication: Quality improvement efforts may benefit from being
related to productivity improvement programs
ï‚— To determine feasibility of new quality improvement efforts,
determine costs and then relate to anticipated customer response
ï‚¢ Determine optimal level of reliability
ï‚— Diminishing returns set in as improvements require higher
investments
ï‚— Know when improving service reliability becomes uneconomical
23. WHEN DOES IMPROVING SERVICE RELIABILITY
BECOME UNECONOMICAL? (FIG 14.7)
Satisfy Target
Customers through
Service Recovery
Optimal Point of
Reliability: Cost of
Failure = Service
Recovery
Satisfy Target
Customers through
Service Delivery as
Planned
100%
ServiceReliability
Investment
Small Cost,
Large Improvement
Large Cost,
Small Improvement
A B C D
Assumption: Customers are equally (or even more)
satisfied with the service recovery provided than with a
service that is delivered as planned.
25. PRODUCTIVITY IN A SERVICE CONTEXT
ï‚¢ Productivity measures amount of output produced relative to the
amount of inputs.
ï‚¢ Improvement in productivity means an improvement in the ratio of
outputs to inputs.
ï‚¢ Intangible nature of many service elements makes it hard to
measure productivity of service firms, especially for information-
based services
ï‚— Difficult in most services because both input and output are
hard to define
ï‚— Relatively simpler in possession-processing services, as
compared to information- and people-processing services
26. SERVICE EFFICIENCY, PRODUCTIVITY,
AND EFFECTIVENESS
ï‚¢ Efficiency: Involves comparison to a standard,
usually time-based (for example: how long
employee takes to perform specific task)
ï‚— Problem: Focus on inputs rather than
outcomes
ï‚— May ignore variations in service quality/value
ï‚¢ Productivity: Involves financial valuation of outputs
to inputs
ï‚— Consistent delivery of outcomes desired by
customers should command higher prices
ï‚¢ Effectiveness: Degree to which firm meets goals
ï‚— Cannot divorce productivity from quality and
customer satisfaction
27. MEASURING SERVICE PRODUCTIVITY:
VARIABILITY IS A MAJOR PROBLEM
ï‚¢ Traditional measures of service output tend to ignore
variations in quality or value of service
ï‚— Focus on outputs rather than outcomes
ï‚— Stress efficiency but not effectiveness
ï‚¢ Firms that consistently deliver outcomes desired by
customers can command higher prices; loyal customers are
more profitable
ï‚¢ Measures with customers as denominator include:
ï‚— Profitability by customer
ï‚— Capital employed per customer
ï‚— Shareholder equity per customer
29. QUESTIONS WHEN DEVELOPING STRATEGIES
TO IMPROVE SERVICE PRODUCTIVITY
 How to transform inputs into outputs efficiently?
 Will improving productivity hurt quality?
 Will improving quality hurt productivity?
 Are employees or technology the key to productivity?
 Can customers contribute to higher productivity?
30. GENERIC PRODUCTIVITY
IMPROVEMENT STRATEGIES
ï‚¢ Typical strategies to improve service productivity:
ï‚— Careful control of costs at every step in process
ï‚— Efforts to reduce wasteful use of materials or labour
ï‚— Replacing workers by automated machines
ï‚— Installing expert systems that allow paraprofessionals to
take on work previously performed by professionals who
earn higher salaries
ï‚¢ Although improving productivity can be approached
incrementally, major gains often require redesigning
entire processes
31. IMPROVING SERVICE PRODUCTIVITY:
(1) OPERATIONS-DRIVEN STRATEGIES
ï‚¢ Control costs, reduce waste
ï‚¢ Set productive capacity to match average demand
ï‚¢ Automate labour tasks
ï‚¢ Upgrade equipment and systems
ï‚¢ Train employees
ï‚¢ Broadening array of tasks that a service worker can perform
ï‚¢ Leverage less-skilled employees through expert systems
ï‚¢ Service process redesign
32. IMPROVING SERVICE PRODUCTIVITY:
(2) CUSTOMER-DRIVEN STRATEGIES
ï‚¢ Change timing of customer demand
ï‚— By shifting demand away from peaks, managers can
make better use of firm’s productive assets and provide
better service
ï‚¢ Involve customers more in production
ï‚— Get customers to self-serve
ï‚— Encourage customers to obtain information and buy
from firm’s corporate websites
ï‚¢ Ask customers to use third parties
ï‚— Delegate delivery of supplementary service elements to
intermediary organizations
33. BACKSTAGE AND FRONT-STAGE PRODUCTIVITY
CHANGES: IMPLICATIONS FOR CUSTOMERS
ï‚¢ Backstage improvements can ripple to front and affect customers
ï‚— Keep abreast of proposed backstage changes, not only to
identify such ripples but also to prepare customers for them
ï‚¢ For example: New printing peripherals may affect appearance of bank statements
ï‚¢ Front-stage productivity enhancements are especially visible in
high contact services
ï‚— Some improvements only require passive acceptance, while
others require customers to change behaviour
ï‚— Must consider impacts on customers and address customer
resistance to changes
ï‚— Better to conduct market research first if changes are
substantial
 See Service Perspectives 14.1: Managing Customers’
Reluctance to Change
34. SUMMARY
ï‚¢ Customers evaluate services using five different categories
ï‚— Tangibles, reliability, responsiveness, assurance, empathy
ï‚¢ There are seven service quality gaps and solutions presented
in the Gaps Model
ï‚— Knowledge, standards, delivery, internal communications gap,
perceptions, interpretation, service
ï‚¢ Key tools for measuring and improving productivity are:
ï‚— Fishbone diagram
ï‚— Pareto Chart
ï‚— Blueprinting
ï‚— Total Quality Management (TQM)
ï‚— ISO 9000
ï‚— Malcolm Baldrige Model Applied to Services
ï‚— Six Sigma