Downloaded 267 times
![Dynamic Image Analysis Applications
Powders 30 µm – 30 mm
Glass beads
Sugar spheres
Fertilizers
Catalysts
Coating thickness
q3 [%/mm]
Q3 [%]
CoMo2-0,1%Absch_xc_min_001.rdf
90
180
80
160
70
140
60
120
50
100
40
80
30
60
20
40
10
20
0
0
1.4
1.6
1.8
2.0
2.2
2.4
x1
© 2010 HORIBA, Ltd. All rights reserved.
2.6
2.8
x2
x [mm]](https://image.slidesharecdn.com/technologyseries-selectingthebestparticlesizeanalyzer-110707223450-phpapp01/85/Selecting-the-Best-Particle-Size-Analyzer-for-your-Application-34-320.jpg)
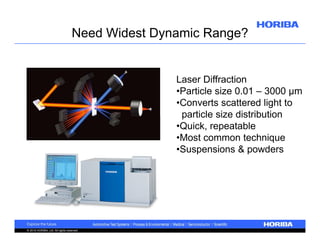
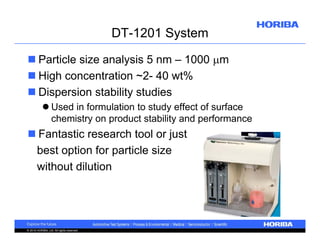
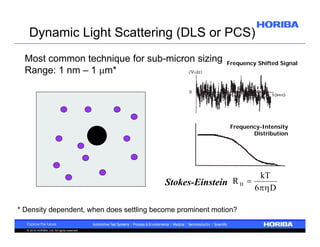
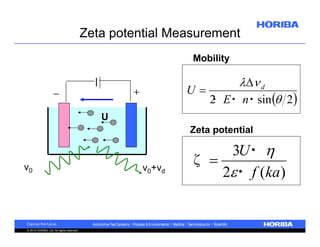
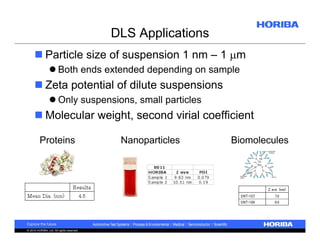
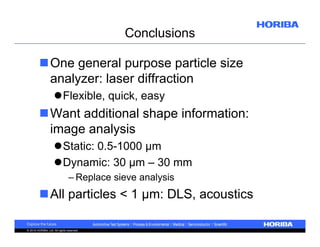

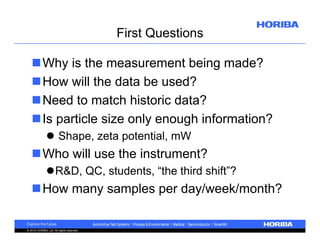
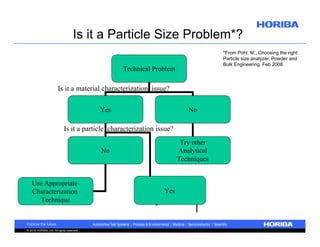
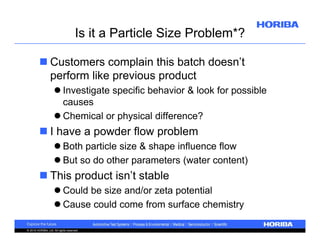
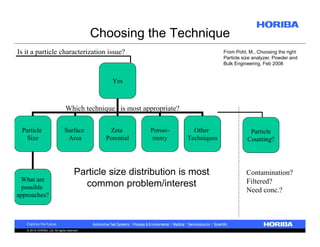
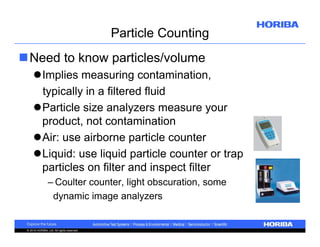
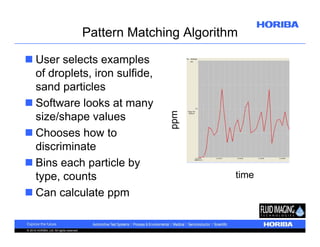
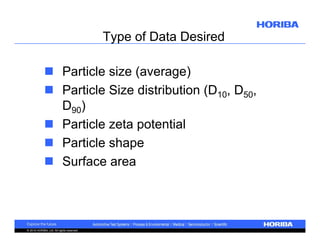
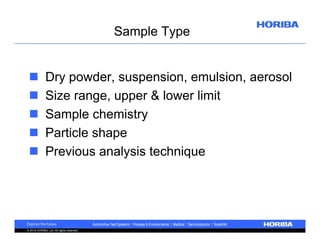
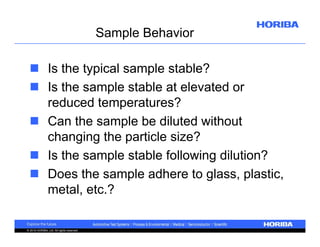
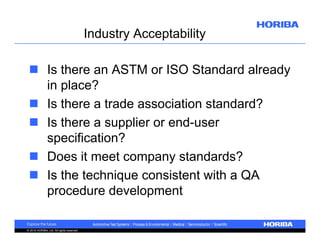
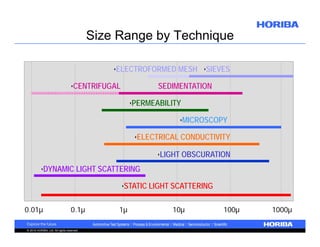
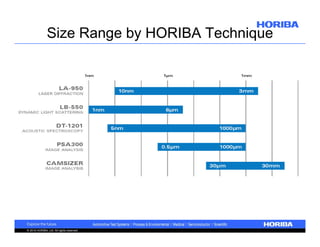
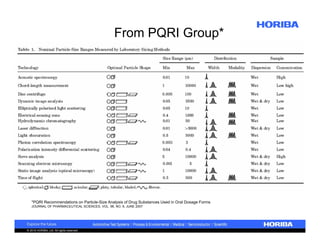
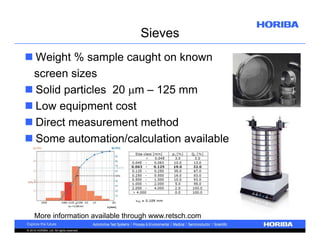
The document discusses the selection of particle characterization analyzers based on specific application needs, including factors such as measurement purpose, sample type, and data requirements. It reviews various techniques for particle characterization, including size analysis, zeta potential measurement, and image analysis, highlighting the importance of understanding sample behavior, type, and industry standards. The document emphasizes the necessity of defining suitable methods for accurate analysis, suggesting that no single technique fits all applications.