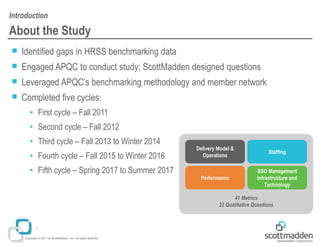
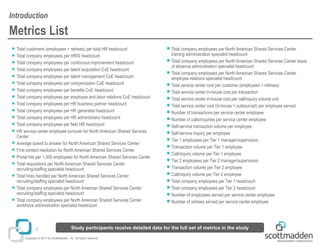
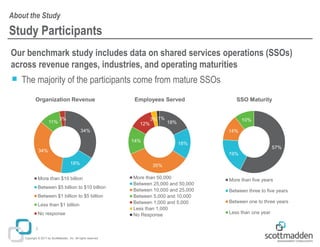
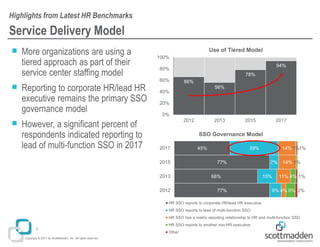
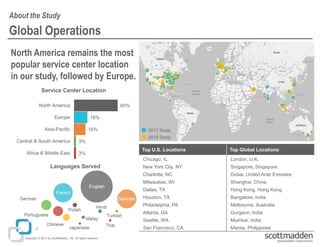
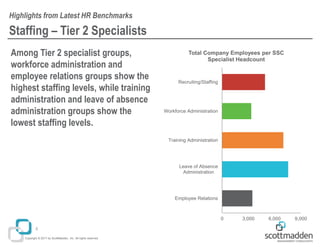
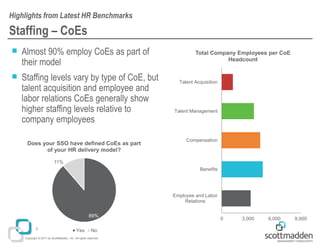
Copyright © 2017 ScottMadden, Inc. All rights reserved. Overhead_2017
HR Shared Services
Benchmarking Study Highlights
ScottMadden and APQC HR Shared Services
Benchmarking Study
October 2017
Copyright © 2017 by ScottMadden, Inc. All rights reserved.
About the Study
■ Identified gaps in HRSS benchmarking data
■ Engaged APQC to conduct study; ScottMadden designed questions
■ Leveraged APQC’s benchmarking methodology and member network
■ Completed five cycles:
• First cycle – Fall 2011
• Second cycle – Fall 2012
• Third cycle – Fall 2013 to Winter 2014
• Fourth cycle – Fall 2015 to Winter 2016
• Fifth cycle – Spring 2017 to Summer 2017
Introduction
1
41 Metrics
22 Qualitative Questions
Staffing
SSO Management
Infrastructure and
Technology
Delivery Model &
Operations
Performance
Copyright © 2017 by ScottMadden, Inc. All rights reserved.
Metrics List
■ Total customers (employees + retirees) per total HR headcount
■ Total company employees per HRIS headcount
■ Total company employees per continuous improvement headcount
■ Total company employees per talent acquisition CoE headcount
■ Total company employees per talent management CoE headcount
■ Total company employees per compensation CoE headcount
■ Total company employees per benefits CoE headcount
■ Total company employees per employee and labor relations CoE headcount
■ Total company employees per HR business partner headcount
■ Total company employees per HR generalist headcount
■ Total company employees per HR administrator headcount
■ Total company employees per field HR headcount
■ HR service center employee turnover for North American Shared Services
Center
■ Average speed to answer for North American Shared Services Center
■ First-contact resolution for North American Shared Services Center
■ Portal hits per 1,000 employees for North American Shared Services Center
■ Total requisitions per North American Shared Services Center
recruiting/staffing specialist headcount
■ Total hires handled per North American Shared Services Center
recruiting/staffing specialist headcount
■ Total company employees per North American Shared Services Center
recruiting/staffing specialist headcount
■ Total company employees per North American Shared Services Center
workforce administration specialist headcount
■ Total company employees per North American Shared Services Center
training administration specialist headcount
■ Total company employees per North American Shared Services Center leave
of absence administration specialist headcount
■ Total company employees per North American Shared Services Center
employee relations specialist headcount
■ Total service center cost per customer (employees + retirees)
■ Total service center in-house cost per transaction
■ Total service center in-house cost per call/inquiry volume unit
■ Total service center cost (in-house + outsourced) per employee served
■ Number of transactions per service center employee
■ Number of calls/inquiries per service center employee
■ Self-service transaction volume per employee
■ Self-service inquiry per employee
■ Tier 1 employees per Tier 1 manager/supervisors
■ Transaction volume per Tier 1 employee
■ Call/inquiry volume per Tier 1 employee
■ Tier 2 employees per Tier 2 manager/supervisors
■ Transaction volume per Tier 2 employee
■ Call/inquiry volume per Tier 2 employee
■ Total company employees per Tier 1 headcount
■ Total company employees per Tier 2 headcount
■ Number of employees served per service center employee
■ Number of retirees served per service center employee
2
Introduction
Study participants receive detailed data for the full set of metrics in the study
Copyright © 2017 by ScottMadden, Inc. All rights reserved.
Study Participants
Our benchmark study includes data on shared services operations (SSOs)
across revenue ranges, industries, and operating maturities
■ The majority of the participants come from mature SSOs
3
About the Study
34%
18%
34%
11%
3%
Organization Revenue
More than $10 billion
Between $5 billion to $10 billion
Between $1 billion to $5 billion
Less than $1 billion
No response
18%
16%
35%
14%
12%
3%1%
Employees Served
More than 50,000
Between 25,000 and 50,000
Between 10,000 and 25,000
Between 5,000 and 10,000
Between 1,000 and 5,000
Less than 1,000
No Response
57%
19%
14%
10%
SSO Maturity
More than five years
Between three to five years
Between one to three years
Less than one year
Copyright © 2017 by ScottMadden, Inc. All rights reserved.
Service Delivery Model
■ More organizations are using a
tiered approach as part of their
service center staffing model
■ Reporting to corporate HR/lead HR
executive remains the primary SSO
governance model
■ However, a significant percent of
respondents indicated reporting to
lead of multi-function SSO in 2017
4
Highlights from Latest HR Benchmarks
66%
56%
78%
94%
0%
20%
40%
60%
80%
100%
2012 2013 2015 2017
Use of Tiered Model
77%
68%
77%
45%
9%
15%
7%
39%
4%
11%
14%
14%
8%
4%
1%
1%
2%
1%
1%
2012
2013
2015
2017
SSO Governance Model
HR SSO reports to corporate HR/lead HR executive
HR SSO reports to lead of multi-function SSO
HR SSO has a matrix reporting relationship to HR and multi-function SSO
HR SSO reports to another non-HR executive
Other
Copyright © 2017 by ScottMadden, Inc. All rights reserved.
Global Operations
5
About the Study
North America remains the most
popular service center location
in our study, followed by Europe.
Top U.S. Locations Top Global Locations
Chicago, IL London, U.K.
New York City, NY Singapore, Singapore
Charlotte, NC Dubai, United Arab Emirates
Milwaukee, WI Shanghai, China
Dallas, TX Hong Kong, Hong Kong
Houston, TX Bangalore, India
Philadelphia, PA Melbourne, Australia
Atlanta, GA Gurgaon, India
Seattle, WA Mumbai, India
San Francisco, CA Manila, Philippines
2017 Study
2015 Study
60%
18%
16%
3%
3%
North America
Europe
Asia-Pacific
Central & South America
Africa & Middle East
Service Center Location
Languages Served
Copyright © 2017 by ScottMadden, Inc. All rights reserved.
Technology Standardization
Service center and customer care technologies show the most standardization
across centers, followed closely by HRIS.
Highlights from Latest HR Benchmarks
51%
45%
52%
30%
31%
29%
19%
20%
17%
3%
2%
0% 20% 40% 60% 80% 100%
HRIS
Payroll
Service Center /
Customer Care
Technology Standardization
Single instance used across all centers (full standardization)
Common tool used but different configurations for centers or regions
Multiple tools used with some centers using standard tools
No common tools or standardization6
Copyright © 2017 by ScottMadden, Inc. All rights reserved.
Staffing – Service Center
■ Median service center staffing level is nearly 600 employees per service center
headcount
■ SSOs in the top quartile can operate with less than a third of service center
employees than those in the bottom quartile
7
Highlights from Latest HR Benchmarks
0
200
400
600
800
1,000
1,200
Top Quartile Median Bottom Quartile
Total Company Employees per Service Center Employee
Copyright © 2017 by ScottMadden, Inc. All rights reserved.
Staffing – Tier 2 Specialists
Among Tier 2 specialist groups,
workforce administration and
employee relations groups show the
highest staffing levels, while training
administration and leave of absence
administration groups show the
lowest staffing levels.
8
Highlights from Latest HR Benchmarks
0 3,000 6,000 9,000
Employee Relations
Leave of Absence
Administration
Training Administration
Workforce Administration
Recruiting/Staffing
Total Company Employees per SSC
Specialist Headcount
Copyright © 2017 by ScottMadden, Inc. All rights reserved.
Staffing – CoEs
■ Almost 90% employ CoEs as part of
their model
■ Staffing levels vary by type of CoE, but
talent acquisition and employee and
labor relations CoEs generally show
higher staffing levels relative to
company employees
9
Highlights from Latest HR Benchmarks
89%
11%
Does your SSO have defined CoEs as part
of your HR delivery model?
Yes No
0 3,000 6,000 9,000
Employee and Labor
Relations
Benefits
Compensation
Talent Management
Talent Acquisition
Total Company Employees per CoE
Headcount
Copyright © 2017 by ScottMadden, Inc. All rights reserved.
Staffing – Field HR
Most continue to leverage multiple roles in their field HR organizations.
10
Highlights from Latest HR Benchmarks
98%
98%
97%
95%
92%
96%
2017
2015
Types of Positions Included within the
Field HR Organization
HR business partners
HR generalists
HR administrators
0
100
200
300
400
500
600
Top Quartile Median Bottom Quartile
Total Company Employees per Field HR
Headcount
Copyright © 2017 by ScottMadden, Inc. All rights reserved.
Top-Performer Group Comparison Group
71%in operation for
five or more years
43%in operation for five or
more years
20,850 employees served 15,218 employees served
1.3 centers within SSO 2.8 centers within SSO
SSO Maturity
Number of Employees Served
Number of Centers in SSO
Who Are the Top Performers?
An analysis of top-performing
organizations across key metrics in
the study was used to identify
common characteristics
■ More mature
■ Larger entities
■ Less distributed (fewer centers)
■ Are governed by a lead HR executive
■ Use a tiered approach with higher use of Tier
2 specialists
■ Use more robust portals
■ Use more self-service
11
Highlights from Latest HR Benchmarks
Copyright © 2017 by ScottMadden, Inc. All rights reserved.
Want to Find Out How You Compare?
■ Contact us at info@scottmadden.com
■ Sign up to be notified of our next cycle
12
 Unique benchmarking study, focused on HRSSOs
 No cost to participate
 Receive detailed report of all metrics and qualitative
results
 Peer group comparisons are provided where relevant
Copyright © 2017 by ScottMadden, Inc. All rights reserved.
Type name here
Type title here
ScottMadden, Inc.
2626 Glenwood Avenue
Suite 480
Raleigh, NC 27608
xxx@scottmadden.com
O: 919-781-4191 M: xxx-xxx-xxxx
Type name here
Type title here
ScottMadden, Inc.
3495 Piedmont Road
Building 10, Suite 805
Atlanta, GA 30305
xxx@scottmadden.com
O: 404-814-0020 M: xxx-xxx-xxxx
Scott Manning
Partner and Corporate & Shared
Services Practice Leader
ScottMadden, Inc.
3495 Piedmont Road
Building 10, Suite 805
Atlanta, GA 30305
sbmanning@scottmadden.com
O: 404-814-0020 M: 404-456-1176
Karen Hilton
Partner
ScottMadden, Inc.
2626 Glenwood Avenue
Suite 480
Raleigh, NC 27608
karenhilton@scottmadden.com
O: 919-781-4191 M: 919-423-8399
Contact Us
13

ScottMadden HR Shared Services Benchmarking Study Highlights 2017

  • 1.
    Copyright © 2017ScottMadden, Inc. All rights reserved. Overhead_2017 HR Shared Services Benchmarking Study Highlights ScottMadden and APQC HR Shared Services Benchmarking Study October 2017
  • 2.
    Copyright © 2017by ScottMadden, Inc. All rights reserved. About the Study ■ Identified gaps in HRSS benchmarking data ■ Engaged APQC to conduct study; ScottMadden designed questions ■ Leveraged APQC’s benchmarking methodology and member network ■ Completed five cycles: • First cycle – Fall 2011 • Second cycle – Fall 2012 • Third cycle – Fall 2013 to Winter 2014 • Fourth cycle – Fall 2015 to Winter 2016 • Fifth cycle – Spring 2017 to Summer 2017 Introduction 1 41 Metrics 22 Qualitative Questions Staffing SSO Management Infrastructure and Technology Delivery Model & Operations Performance
  • 3.
    Copyright © 2017by ScottMadden, Inc. All rights reserved. Metrics List ■ Total customers (employees + retirees) per total HR headcount ■ Total company employees per HRIS headcount ■ Total company employees per continuous improvement headcount ■ Total company employees per talent acquisition CoE headcount ■ Total company employees per talent management CoE headcount ■ Total company employees per compensation CoE headcount ■ Total company employees per benefits CoE headcount ■ Total company employees per employee and labor relations CoE headcount ■ Total company employees per HR business partner headcount ■ Total company employees per HR generalist headcount ■ Total company employees per HR administrator headcount ■ Total company employees per field HR headcount ■ HR service center employee turnover for North American Shared Services Center ■ Average speed to answer for North American Shared Services Center ■ First-contact resolution for North American Shared Services Center ■ Portal hits per 1,000 employees for North American Shared Services Center ■ Total requisitions per North American Shared Services Center recruiting/staffing specialist headcount ■ Total hires handled per North American Shared Services Center recruiting/staffing specialist headcount ■ Total company employees per North American Shared Services Center recruiting/staffing specialist headcount ■ Total company employees per North American Shared Services Center workforce administration specialist headcount ■ Total company employees per North American Shared Services Center training administration specialist headcount ■ Total company employees per North American Shared Services Center leave of absence administration specialist headcount ■ Total company employees per North American Shared Services Center employee relations specialist headcount ■ Total service center cost per customer (employees + retirees) ■ Total service center in-house cost per transaction ■ Total service center in-house cost per call/inquiry volume unit ■ Total service center cost (in-house + outsourced) per employee served ■ Number of transactions per service center employee ■ Number of calls/inquiries per service center employee ■ Self-service transaction volume per employee ■ Self-service inquiry per employee ■ Tier 1 employees per Tier 1 manager/supervisors ■ Transaction volume per Tier 1 employee ■ Call/inquiry volume per Tier 1 employee ■ Tier 2 employees per Tier 2 manager/supervisors ■ Transaction volume per Tier 2 employee ■ Call/inquiry volume per Tier 2 employee ■ Total company employees per Tier 1 headcount ■ Total company employees per Tier 2 headcount ■ Number of employees served per service center employee ■ Number of retirees served per service center employee 2 Introduction Study participants receive detailed data for the full set of metrics in the study
  • 4.
    Copyright © 2017by ScottMadden, Inc. All rights reserved. Study Participants Our benchmark study includes data on shared services operations (SSOs) across revenue ranges, industries, and operating maturities ■ The majority of the participants come from mature SSOs 3 About the Study 34% 18% 34% 11% 3% Organization Revenue More than $10 billion Between $5 billion to $10 billion Between $1 billion to $5 billion Less than $1 billion No response 18% 16% 35% 14% 12% 3%1% Employees Served More than 50,000 Between 25,000 and 50,000 Between 10,000 and 25,000 Between 5,000 and 10,000 Between 1,000 and 5,000 Less than 1,000 No Response 57% 19% 14% 10% SSO Maturity More than five years Between three to five years Between one to three years Less than one year
  • 5.
    Copyright © 2017by ScottMadden, Inc. All rights reserved. Service Delivery Model ■ More organizations are using a tiered approach as part of their service center staffing model ■ Reporting to corporate HR/lead HR executive remains the primary SSO governance model ■ However, a significant percent of respondents indicated reporting to lead of multi-function SSO in 2017 4 Highlights from Latest HR Benchmarks 66% 56% 78% 94% 0% 20% 40% 60% 80% 100% 2012 2013 2015 2017 Use of Tiered Model 77% 68% 77% 45% 9% 15% 7% 39% 4% 11% 14% 14% 8% 4% 1% 1% 2% 1% 1% 2012 2013 2015 2017 SSO Governance Model HR SSO reports to corporate HR/lead HR executive HR SSO reports to lead of multi-function SSO HR SSO has a matrix reporting relationship to HR and multi-function SSO HR SSO reports to another non-HR executive Other
  • 6.
    Copyright © 2017by ScottMadden, Inc. All rights reserved. Global Operations 5 About the Study North America remains the most popular service center location in our study, followed by Europe. Top U.S. Locations Top Global Locations Chicago, IL London, U.K. New York City, NY Singapore, Singapore Charlotte, NC Dubai, United Arab Emirates Milwaukee, WI Shanghai, China Dallas, TX Hong Kong, Hong Kong Houston, TX Bangalore, India Philadelphia, PA Melbourne, Australia Atlanta, GA Gurgaon, India Seattle, WA Mumbai, India San Francisco, CA Manila, Philippines 2017 Study 2015 Study 60% 18% 16% 3% 3% North America Europe Asia-Pacific Central & South America Africa & Middle East Service Center Location Languages Served
  • 7.
    Copyright © 2017by ScottMadden, Inc. All rights reserved. Technology Standardization Service center and customer care technologies show the most standardization across centers, followed closely by HRIS. Highlights from Latest HR Benchmarks 51% 45% 52% 30% 31% 29% 19% 20% 17% 3% 2% 0% 20% 40% 60% 80% 100% HRIS Payroll Service Center / Customer Care Technology Standardization Single instance used across all centers (full standardization) Common tool used but different configurations for centers or regions Multiple tools used with some centers using standard tools No common tools or standardization6
  • 8.
    Copyright © 2017by ScottMadden, Inc. All rights reserved. Staffing – Service Center ■ Median service center staffing level is nearly 600 employees per service center headcount ■ SSOs in the top quartile can operate with less than a third of service center employees than those in the bottom quartile 7 Highlights from Latest HR Benchmarks 0 200 400 600 800 1,000 1,200 Top Quartile Median Bottom Quartile Total Company Employees per Service Center Employee
  • 9.
    Copyright © 2017by ScottMadden, Inc. All rights reserved. Staffing – Tier 2 Specialists Among Tier 2 specialist groups, workforce administration and employee relations groups show the highest staffing levels, while training administration and leave of absence administration groups show the lowest staffing levels. 8 Highlights from Latest HR Benchmarks 0 3,000 6,000 9,000 Employee Relations Leave of Absence Administration Training Administration Workforce Administration Recruiting/Staffing Total Company Employees per SSC Specialist Headcount
  • 10.
    Copyright © 2017by ScottMadden, Inc. All rights reserved. Staffing – CoEs ■ Almost 90% employ CoEs as part of their model ■ Staffing levels vary by type of CoE, but talent acquisition and employee and labor relations CoEs generally show higher staffing levels relative to company employees 9 Highlights from Latest HR Benchmarks 89% 11% Does your SSO have defined CoEs as part of your HR delivery model? Yes No 0 3,000 6,000 9,000 Employee and Labor Relations Benefits Compensation Talent Management Talent Acquisition Total Company Employees per CoE Headcount
  • 11.
    Copyright © 2017by ScottMadden, Inc. All rights reserved. Staffing – Field HR Most continue to leverage multiple roles in their field HR organizations. 10 Highlights from Latest HR Benchmarks 98% 98% 97% 95% 92% 96% 2017 2015 Types of Positions Included within the Field HR Organization HR business partners HR generalists HR administrators 0 100 200 300 400 500 600 Top Quartile Median Bottom Quartile Total Company Employees per Field HR Headcount
  • 12.
    Copyright © 2017by ScottMadden, Inc. All rights reserved. Top-Performer Group Comparison Group 71%in operation for five or more years 43%in operation for five or more years 20,850 employees served 15,218 employees served 1.3 centers within SSO 2.8 centers within SSO SSO Maturity Number of Employees Served Number of Centers in SSO Who Are the Top Performers? An analysis of top-performing organizations across key metrics in the study was used to identify common characteristics ■ More mature ■ Larger entities ■ Less distributed (fewer centers) ■ Are governed by a lead HR executive ■ Use a tiered approach with higher use of Tier 2 specialists ■ Use more robust portals ■ Use more self-service 11 Highlights from Latest HR Benchmarks
  • 13.
    Copyright © 2017by ScottMadden, Inc. All rights reserved. Want to Find Out How You Compare? ■ Contact us at info@scottmadden.com ■ Sign up to be notified of our next cycle 12  Unique benchmarking study, focused on HRSSOs  No cost to participate  Receive detailed report of all metrics and qualitative results  Peer group comparisons are provided where relevant
  • 14.
    Copyright © 2017by ScottMadden, Inc. All rights reserved. Type name here Type title here ScottMadden, Inc. 2626 Glenwood Avenue Suite 480 Raleigh, NC 27608 xxx@scottmadden.com O: 919-781-4191 M: xxx-xxx-xxxx Type name here Type title here ScottMadden, Inc. 3495 Piedmont Road Building 10, Suite 805 Atlanta, GA 30305 xxx@scottmadden.com O: 404-814-0020 M: xxx-xxx-xxxx Scott Manning Partner and Corporate & Shared Services Practice Leader ScottMadden, Inc. 3495 Piedmont Road Building 10, Suite 805 Atlanta, GA 30305 sbmanning@scottmadden.com O: 404-814-0020 M: 404-456-1176 Karen Hilton Partner ScottMadden, Inc. 2626 Glenwood Avenue Suite 480 Raleigh, NC 27608 karenhilton@scottmadden.com O: 919-781-4191 M: 919-423-8399 Contact Us 13