Download as PDF, PPTX


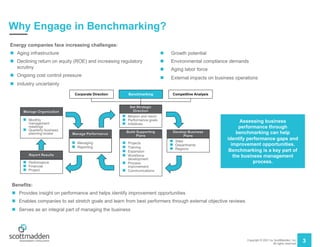
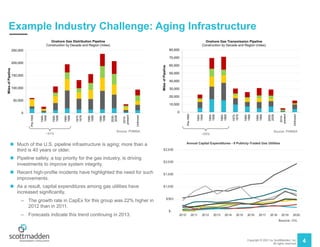
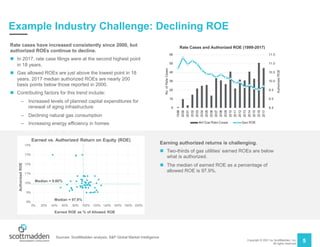
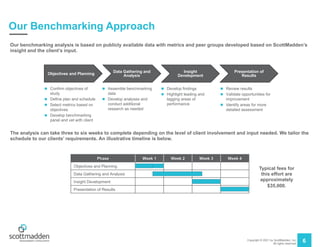

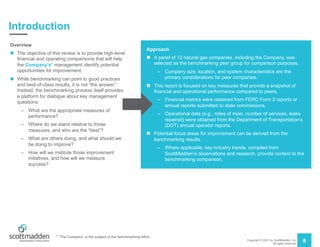
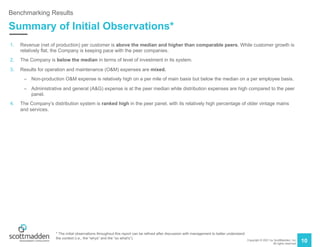
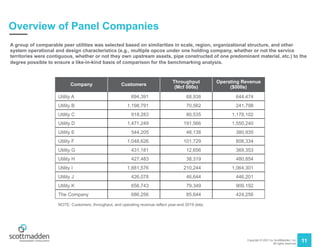
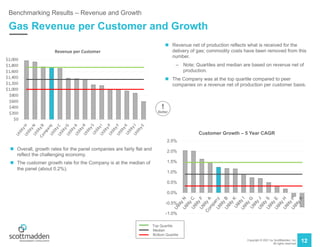
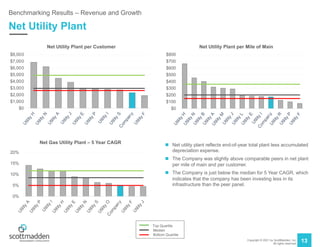
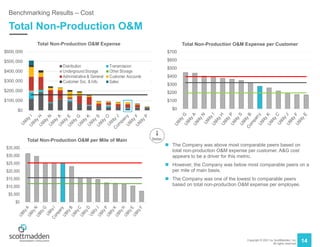
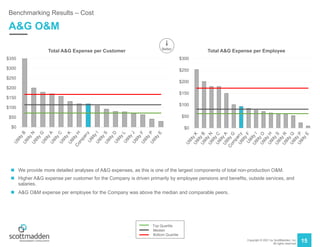
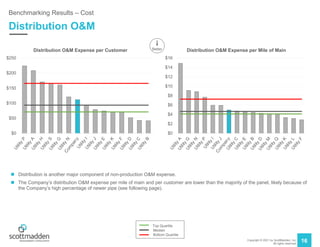
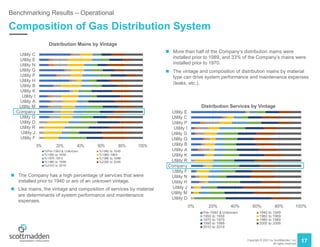
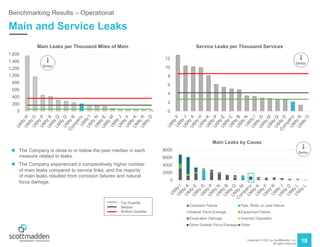
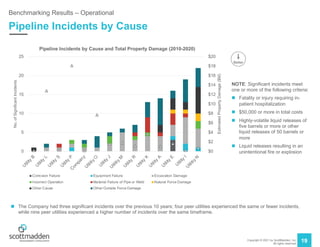
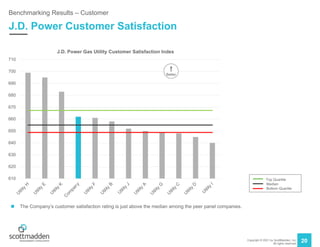


The document provides an overview of natural gas benchmarking, emphasizing its importance for energy companies facing challenges such as aging infrastructure, declining returns on equity, and regulatory scrutiny. It describes a benchmarking process that identifies performance gaps and improvement opportunities through a detailed analysis of financial and operational metrics against peer companies. The document includes example findings related to revenue, operational expenses, and investment levels in infrastructure, as well as insights into corporate performance management.


![[Oil & Gas White Paper] Best Practices Support Success in the Open Natural Ga...](https://cdn.slidesharecdn.com/ss_thumbnails/bestpracticessupportsuccess2012-130830025223-phpapp01-thumbnail.jpg?width=640&height=640&fit=bounds)


