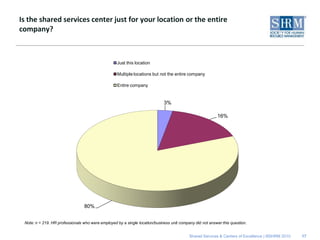
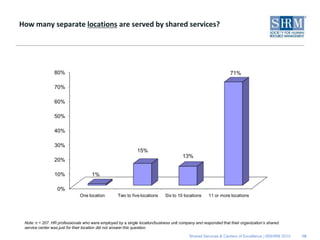
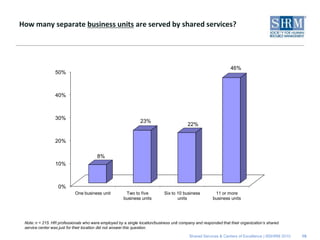
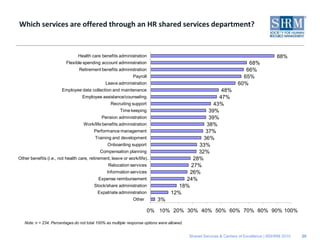
The document discusses a SHRM poll on shared services and centers of excellence models for administering HR transactions and services. Some key findings include:
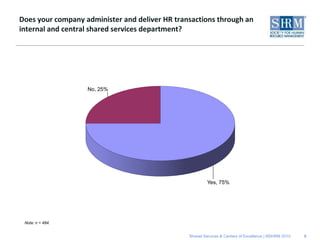
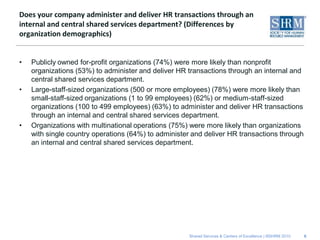
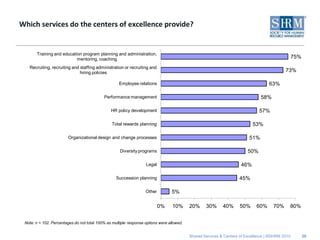
- 75% of organizations administer HR transactions through an internal shared services department. Larger organizations and those with multinational operations were more likely to use this model.
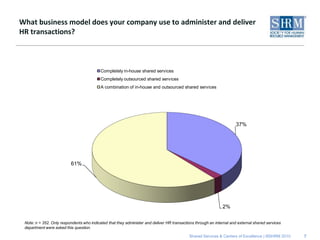
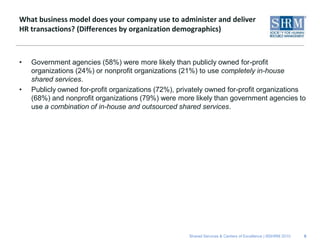
- 61% use a combination of in-house and outsourced shared services, while government agencies were more likely than others to use completely in-house services.
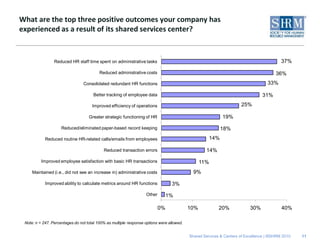
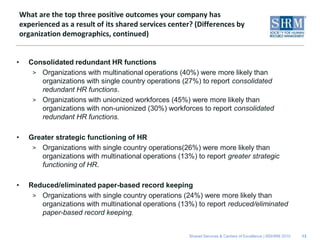
- Top positive outcomes of shared services included reduced HR staff time on administrative tasks and reduced administrative costs. Larger organizations saw greater benefits.
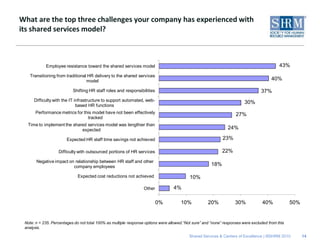
- Top challenges included employee resistance and transition difficulties. Multinational organizations saw more relationship challenges between HR