Download as PDF, PPTX
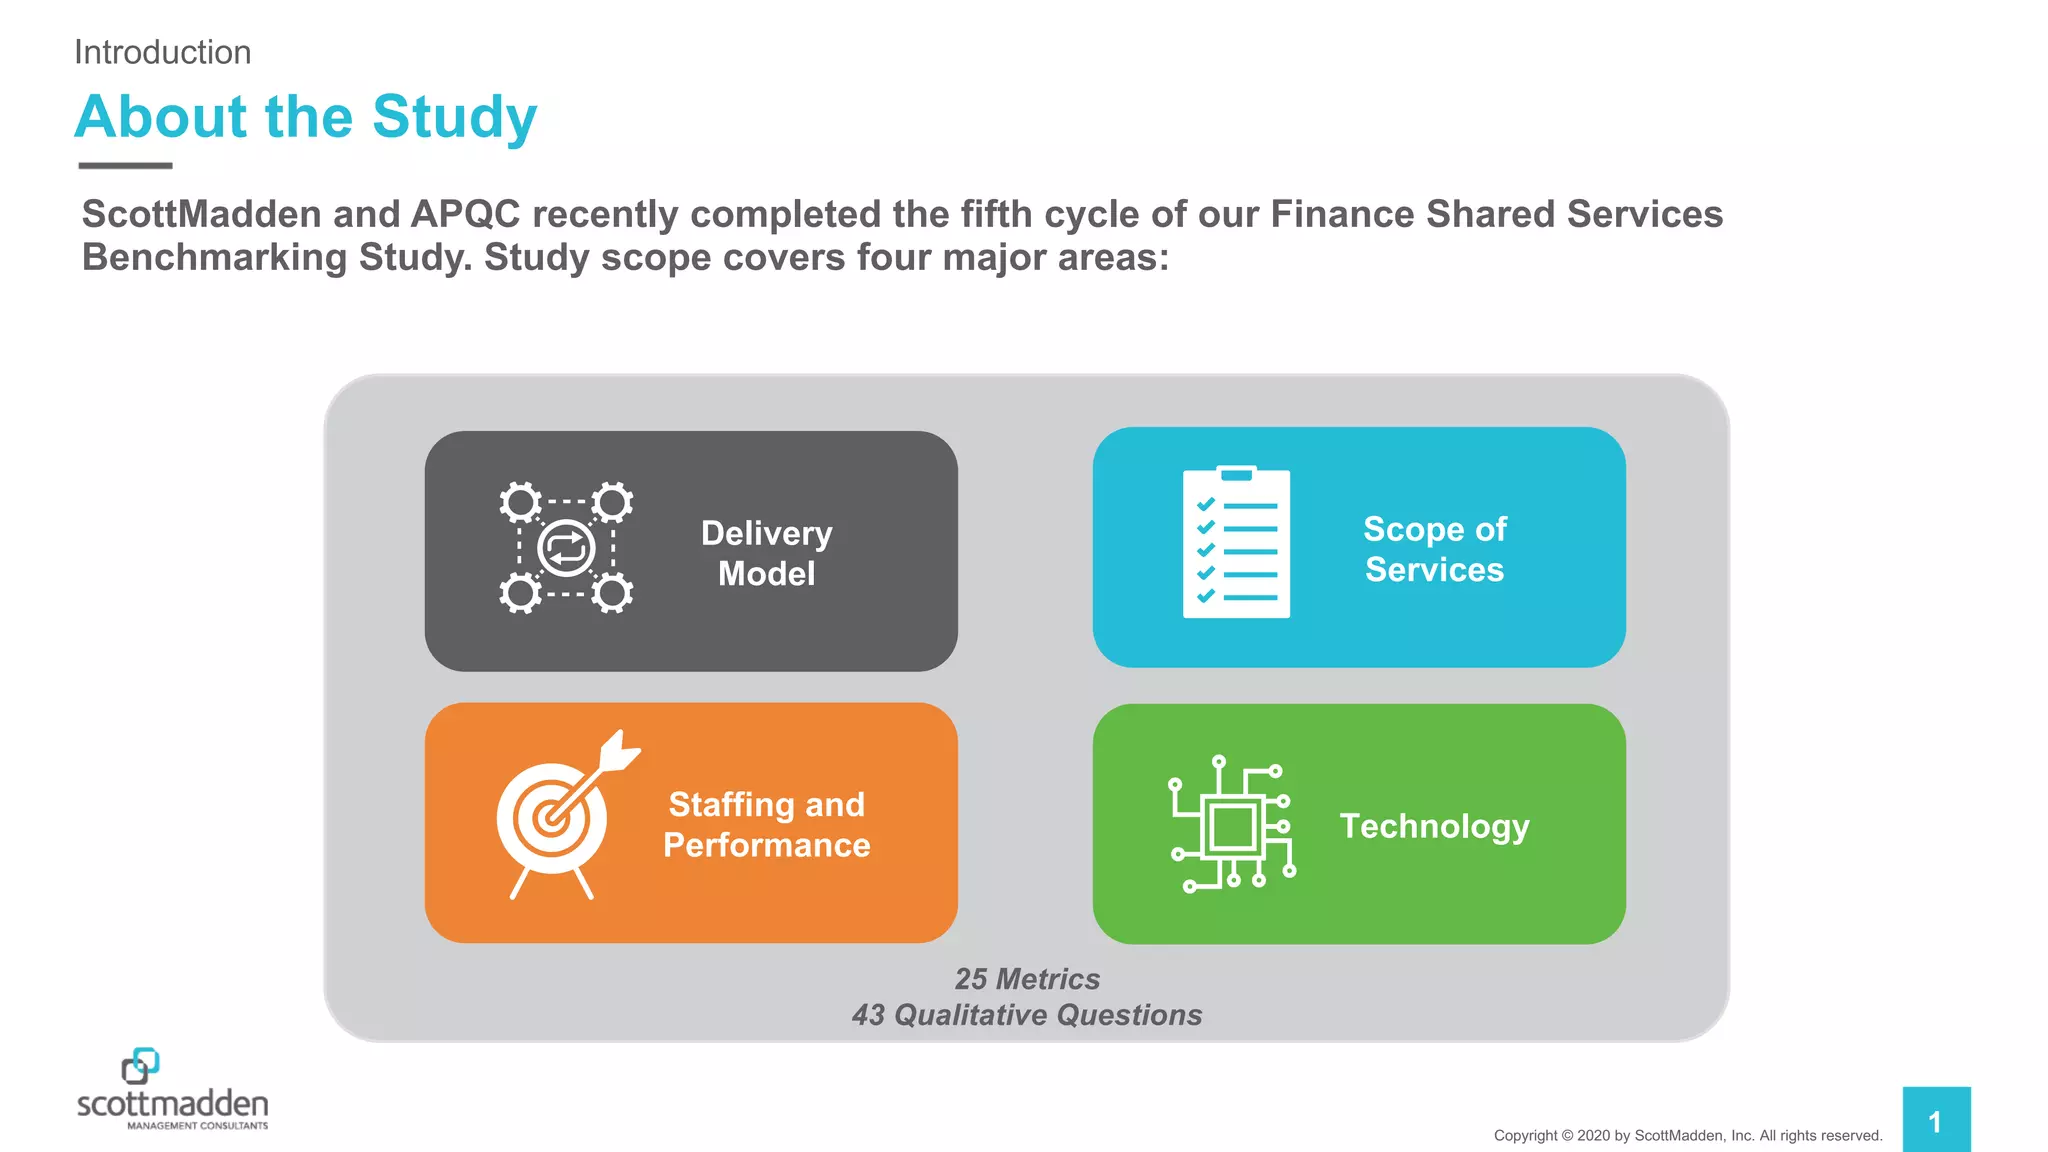
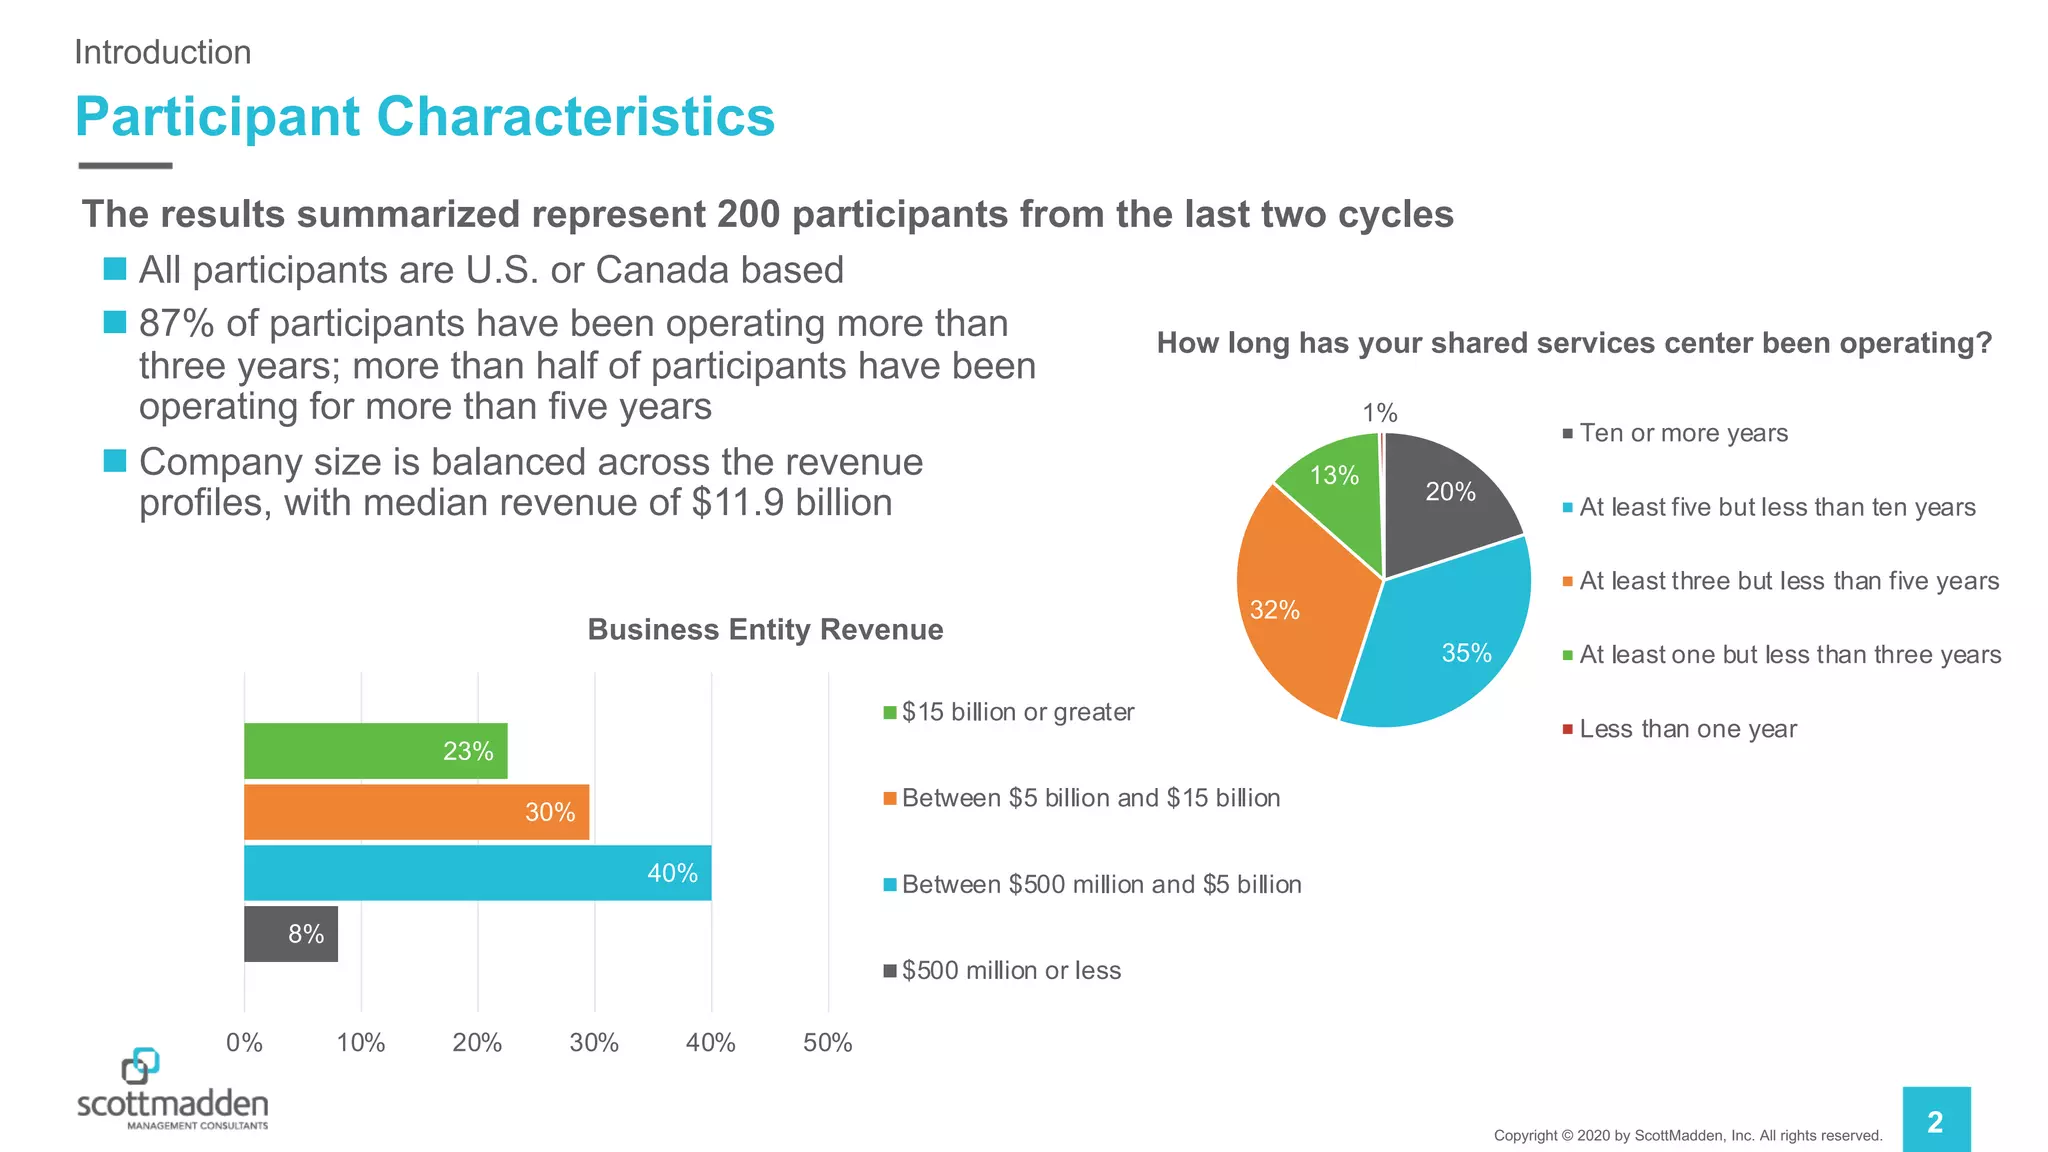
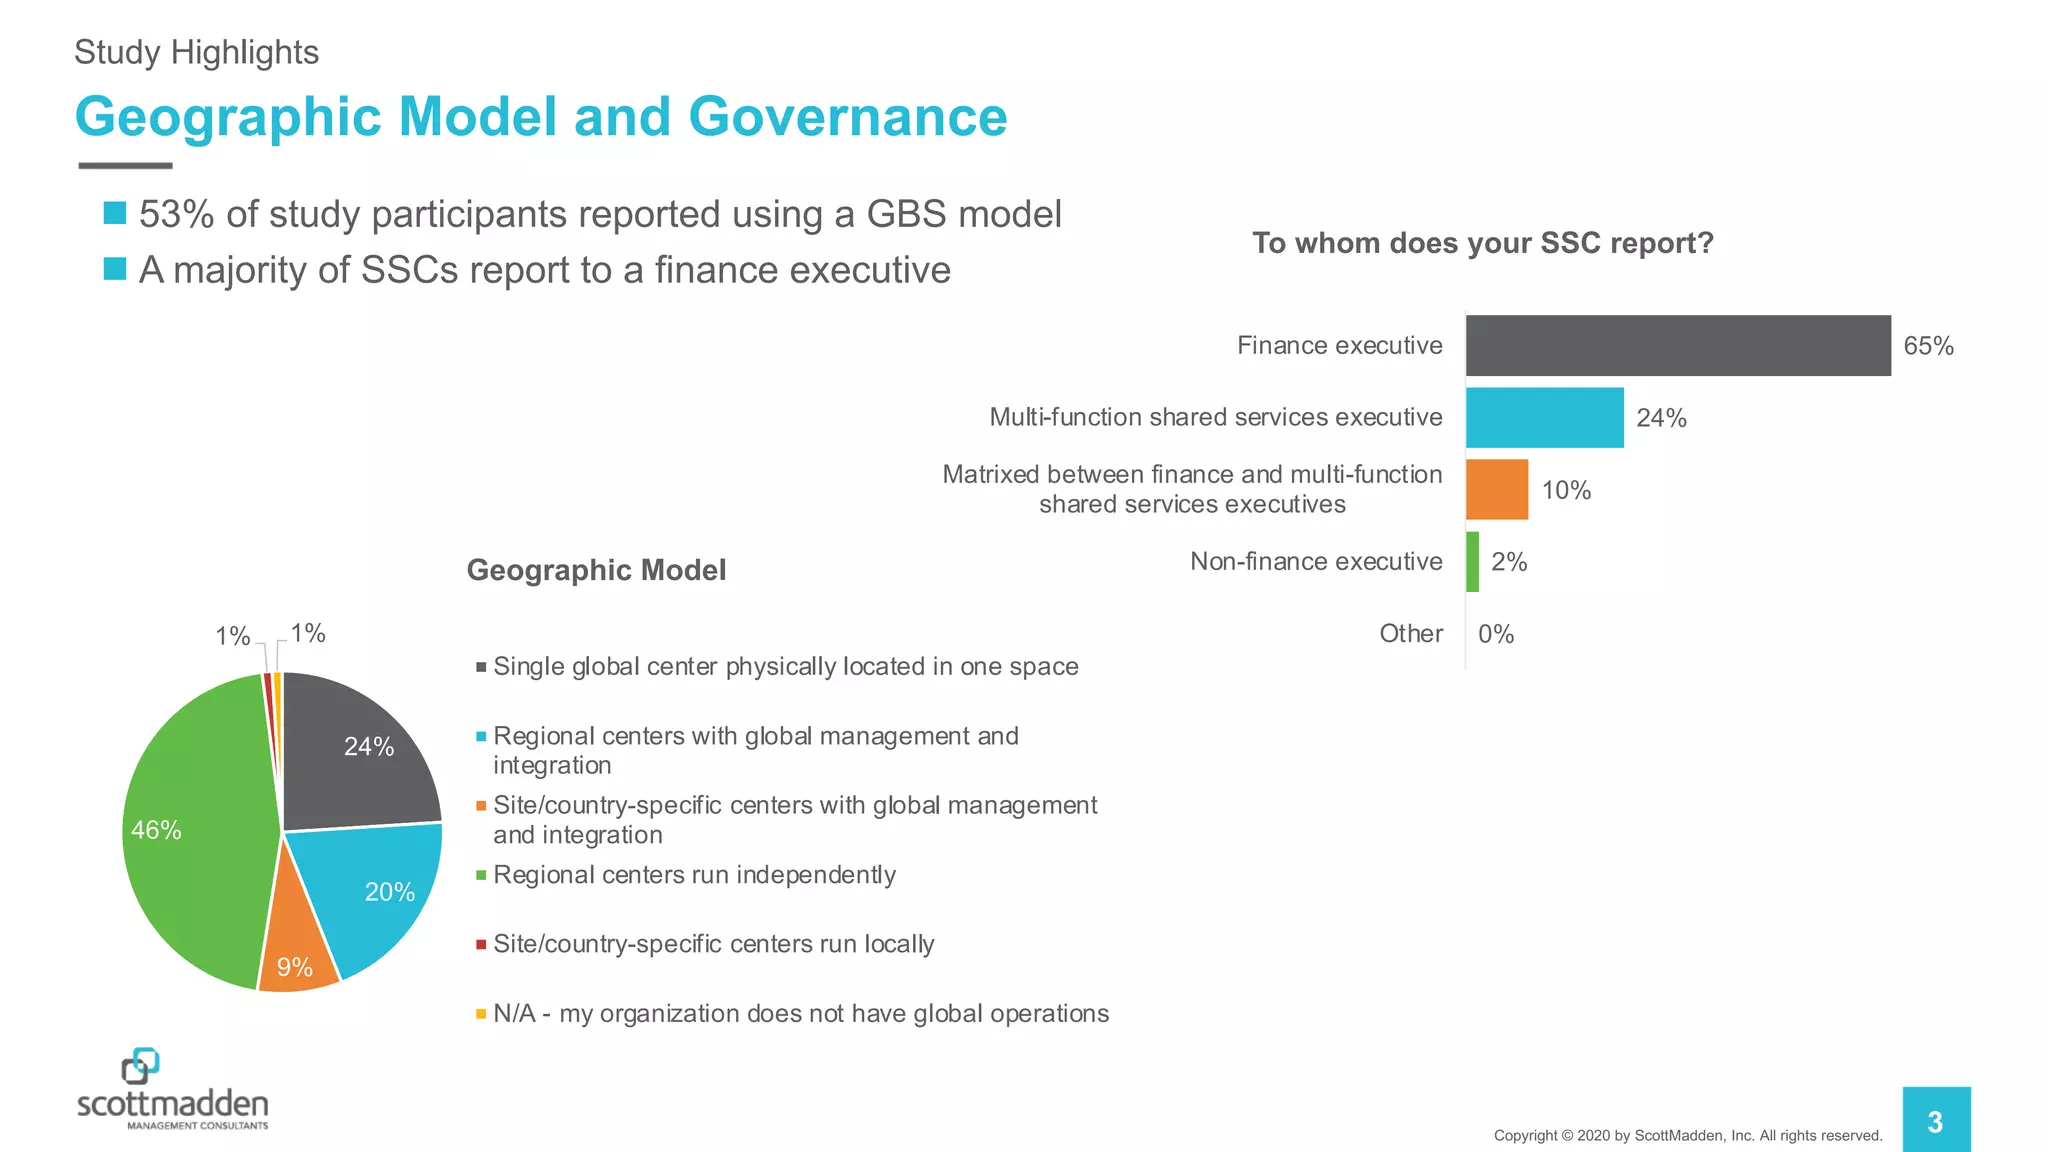
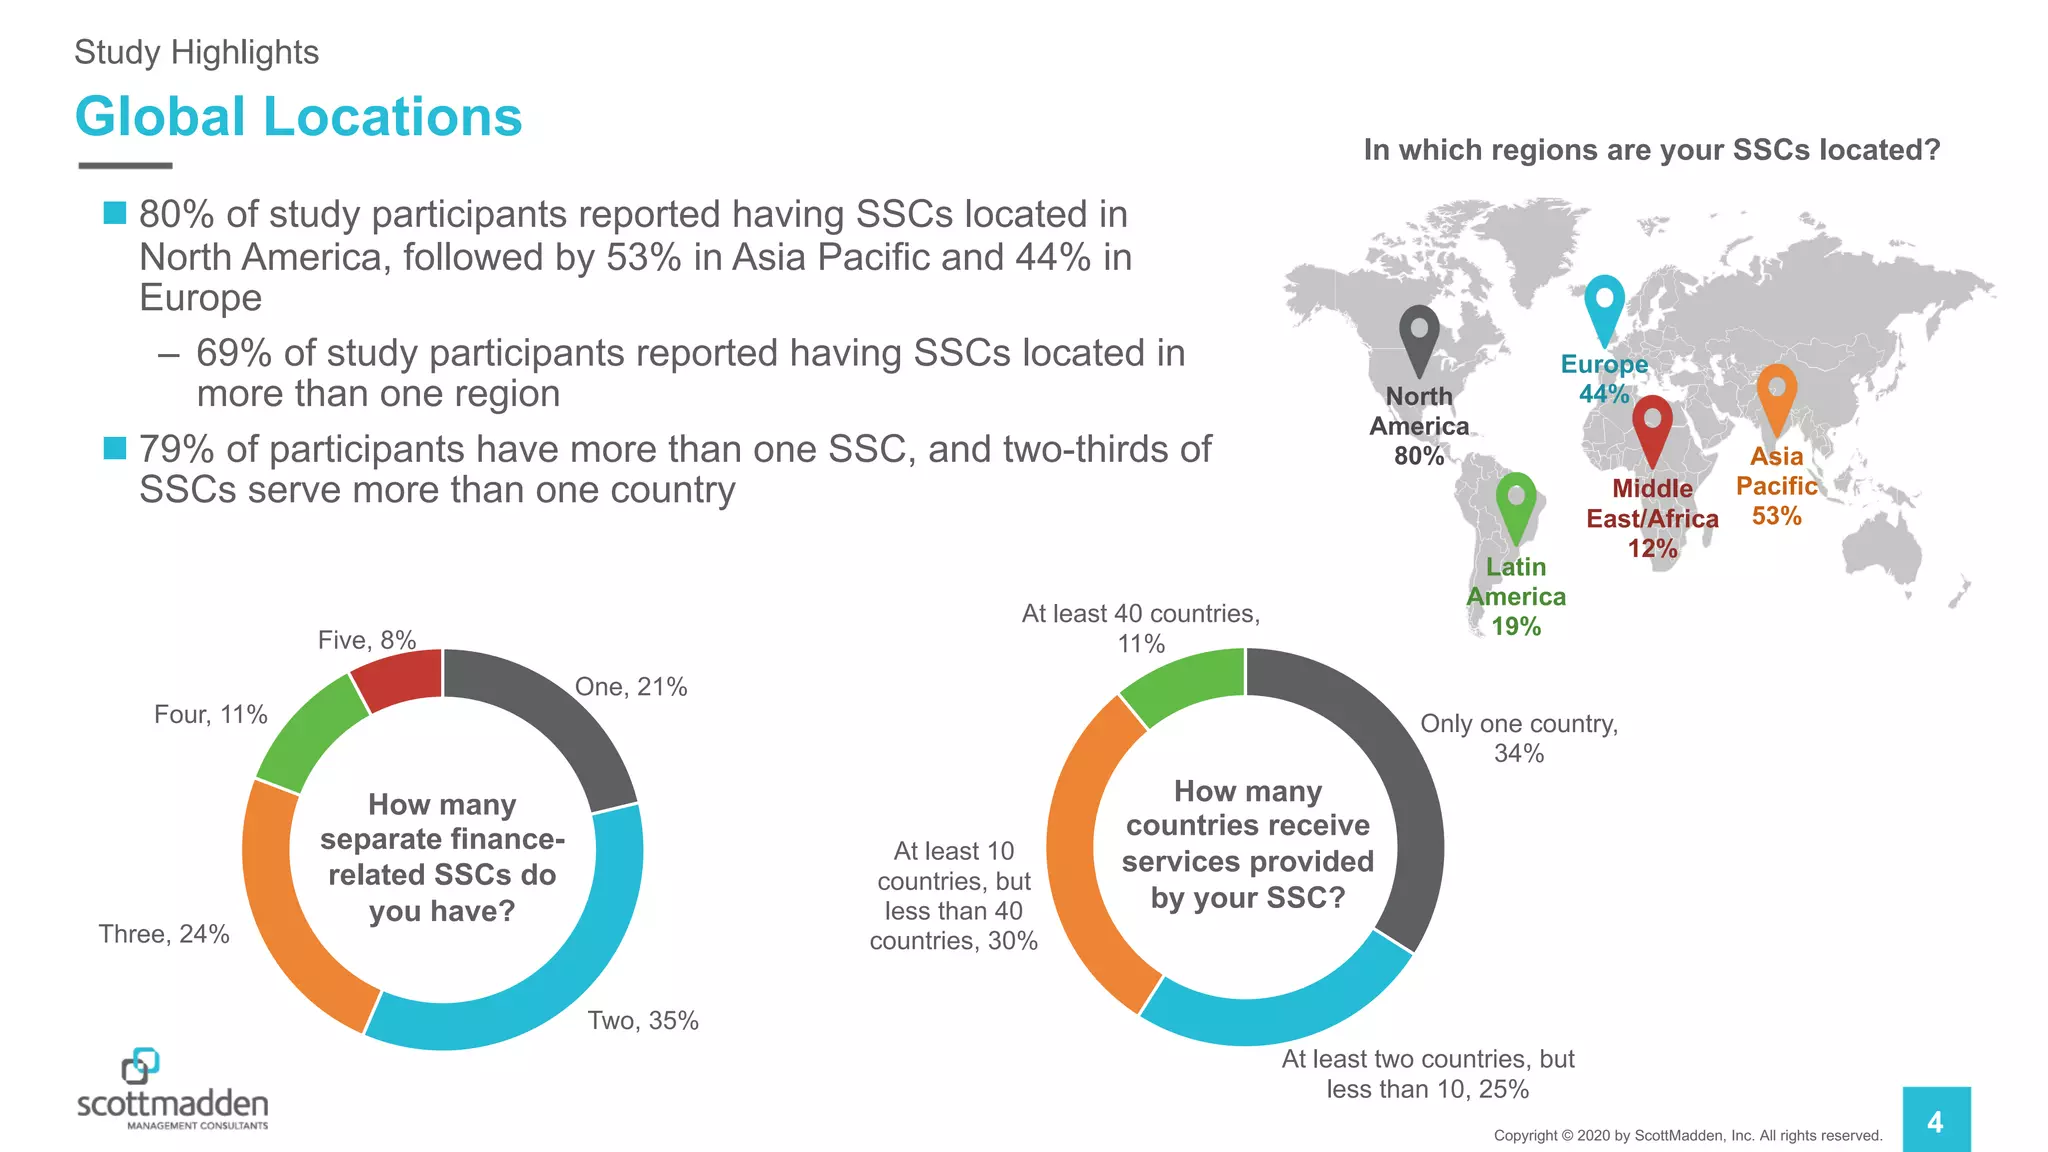
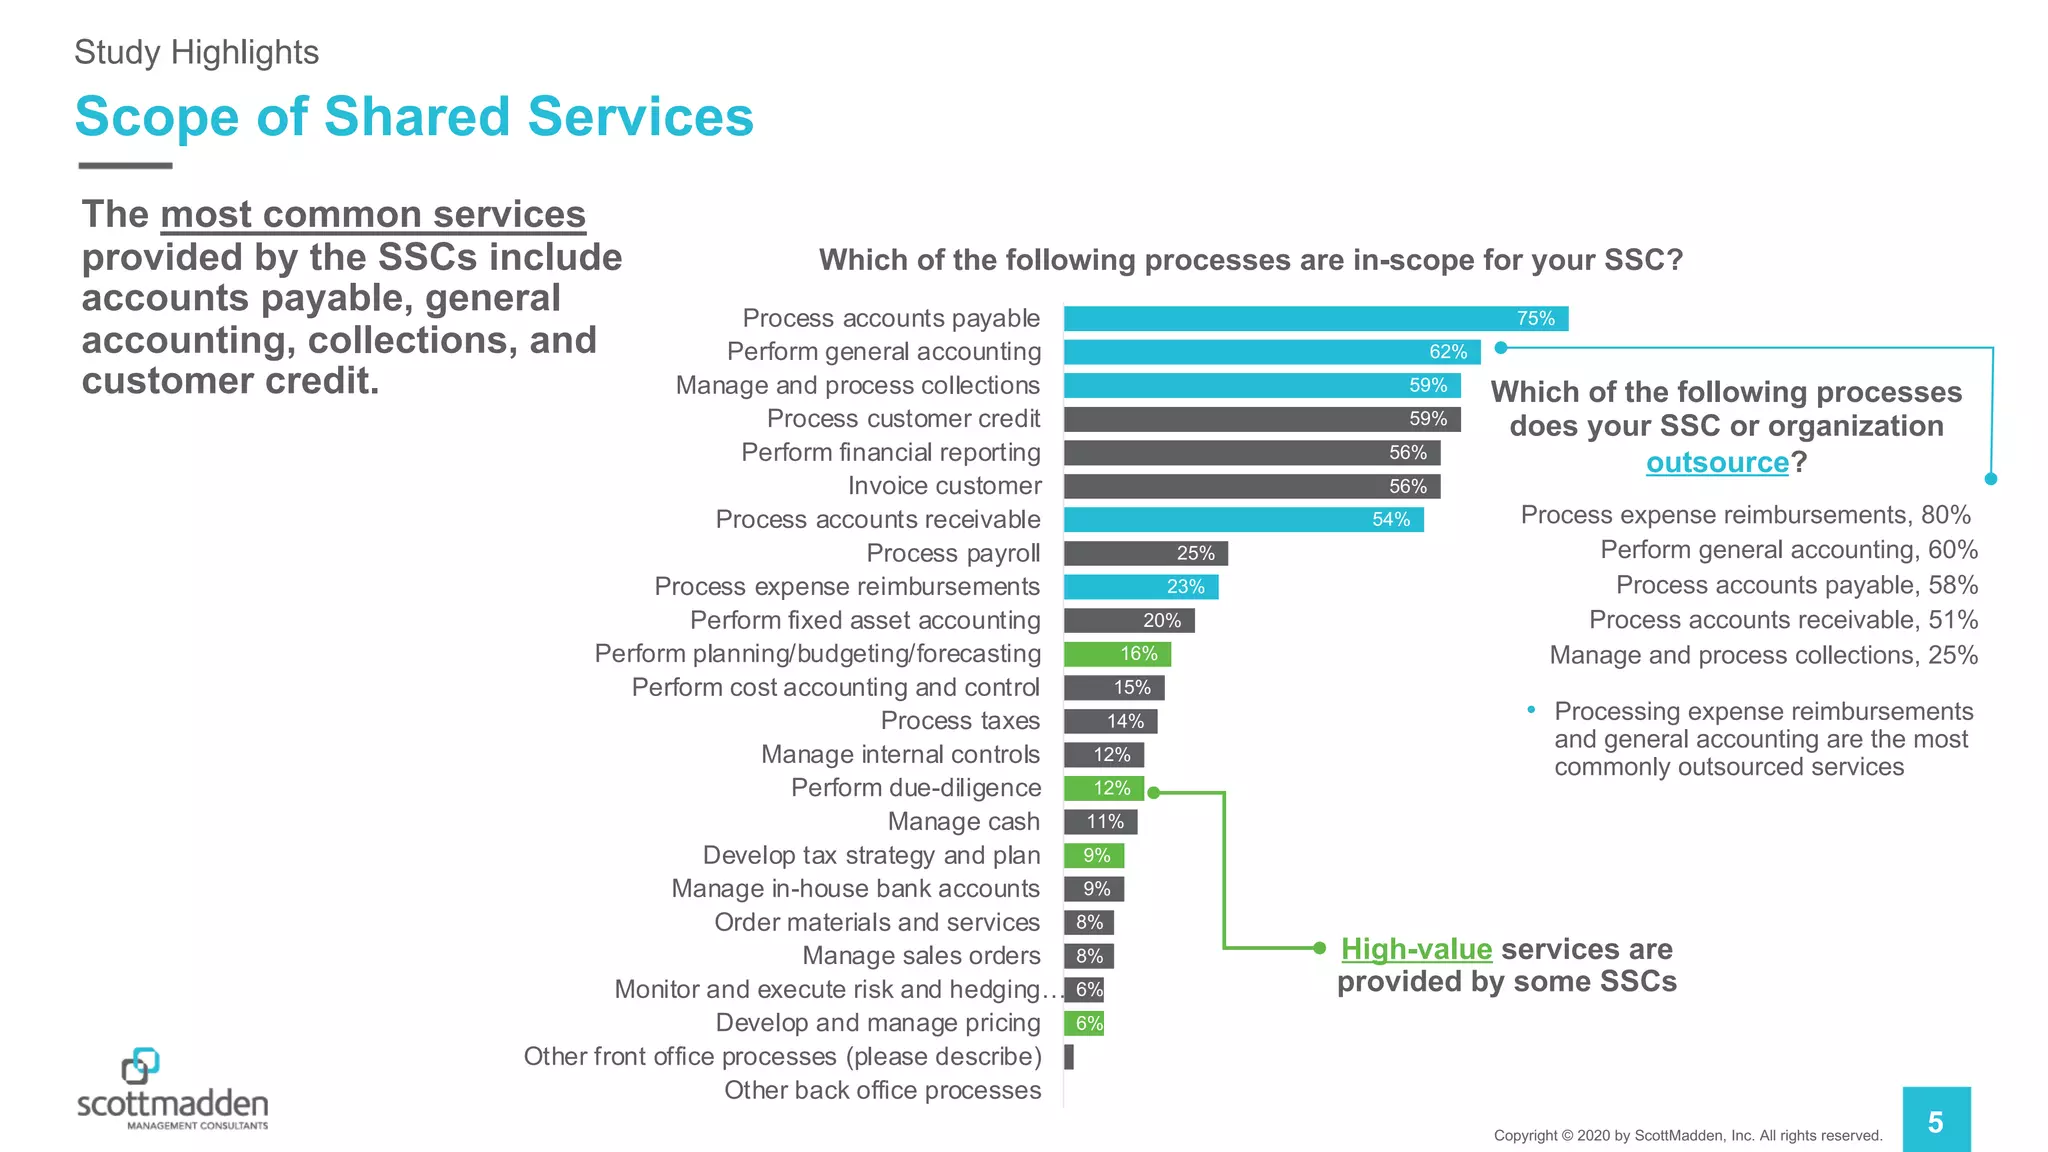
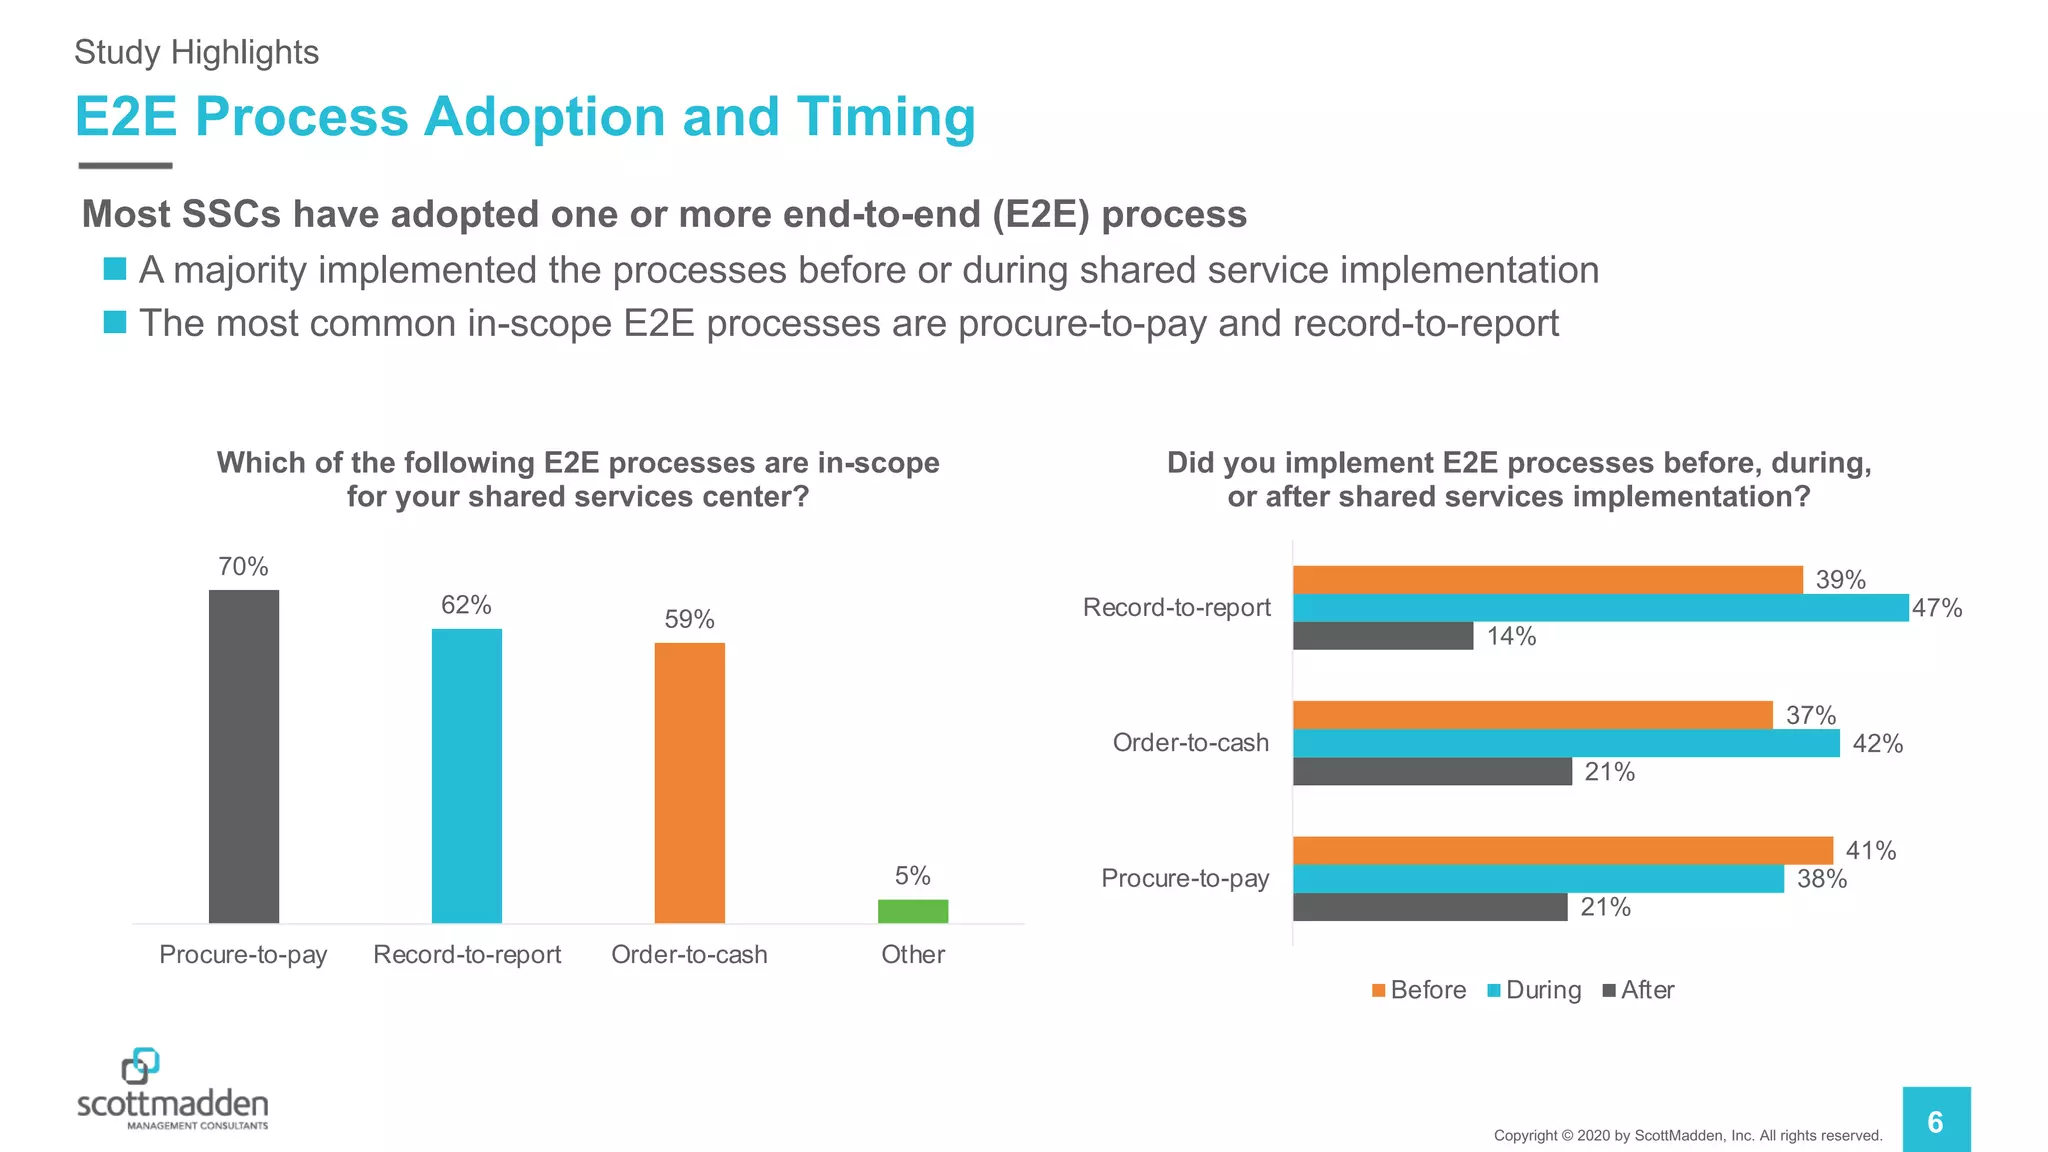
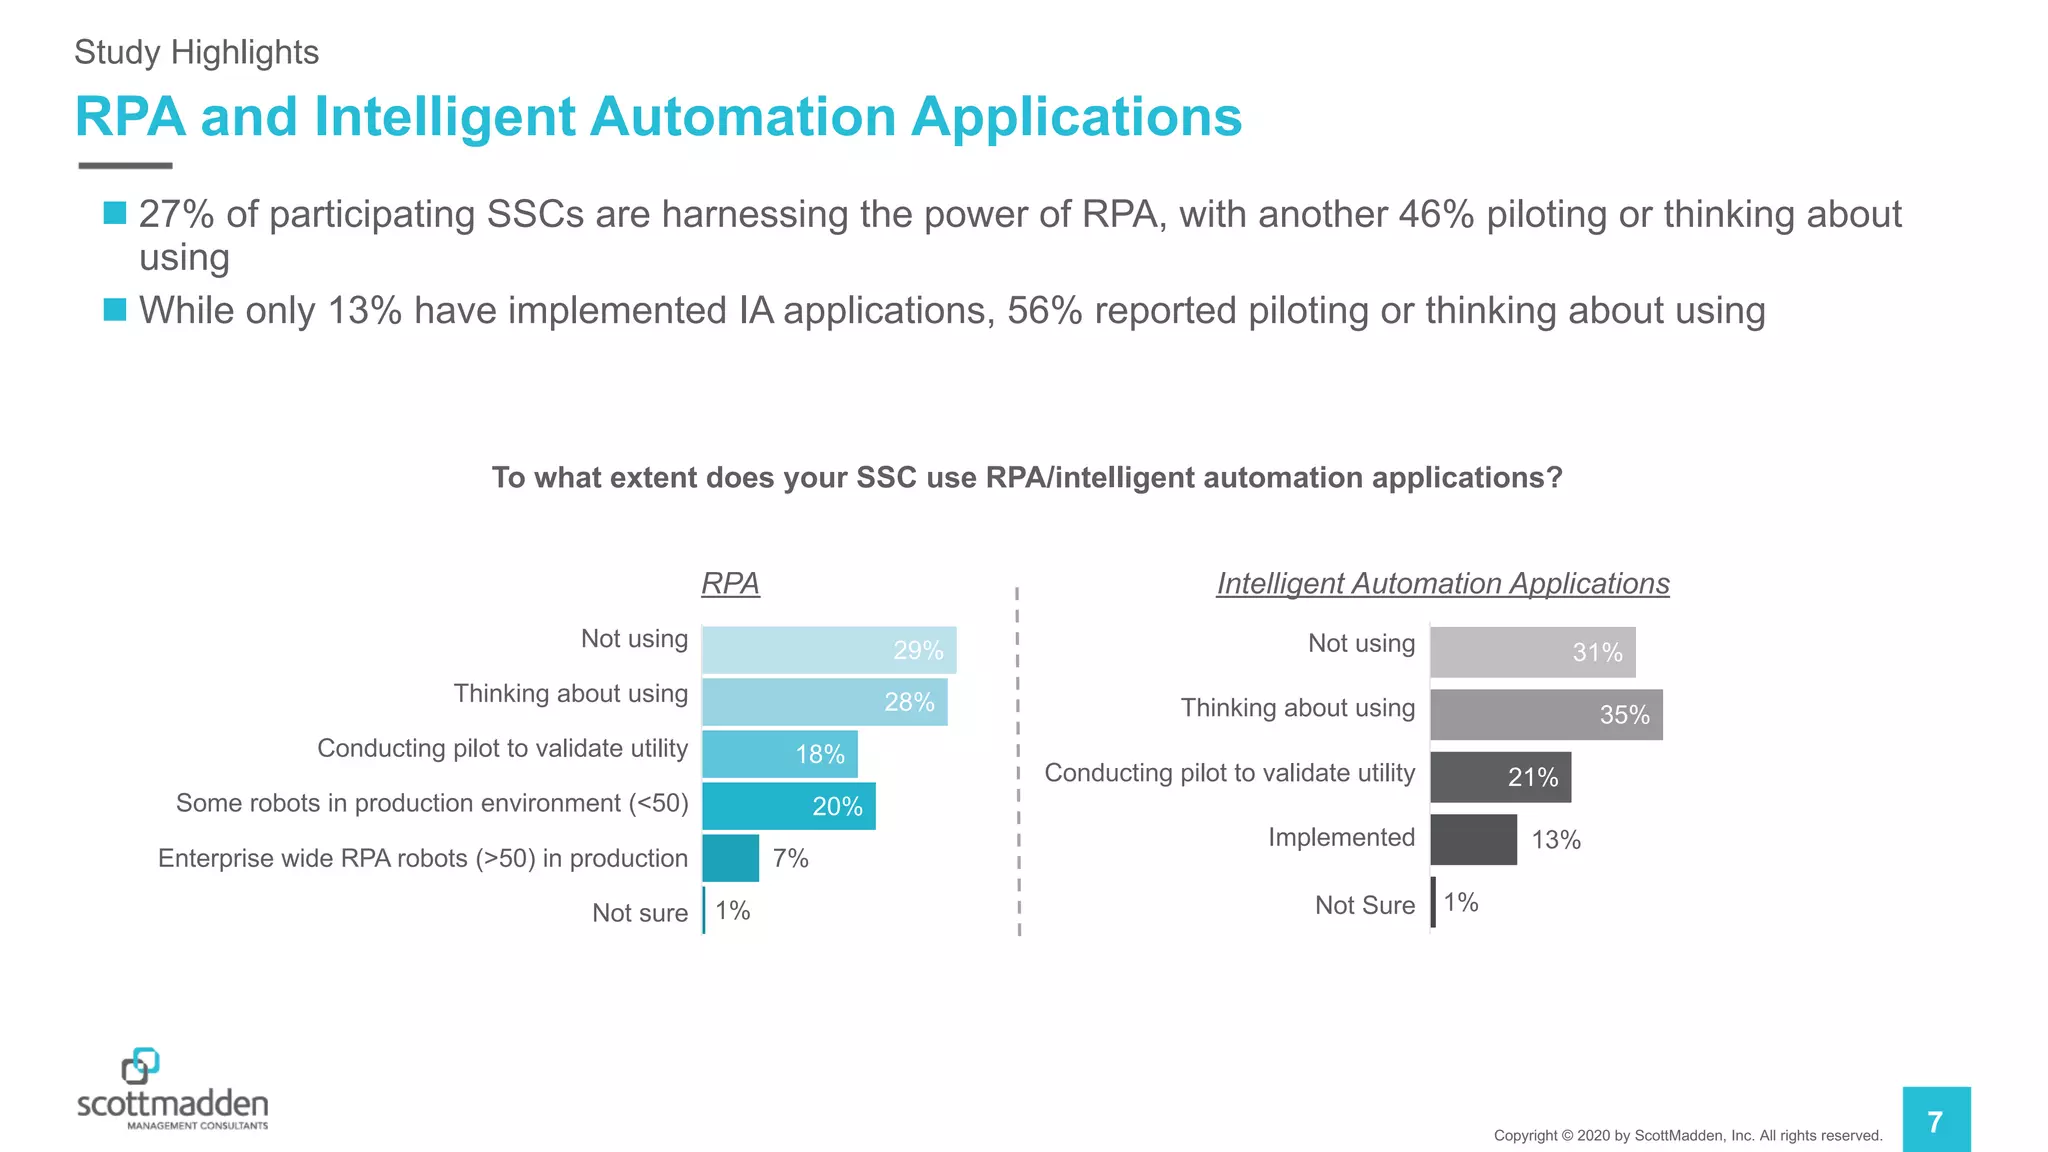
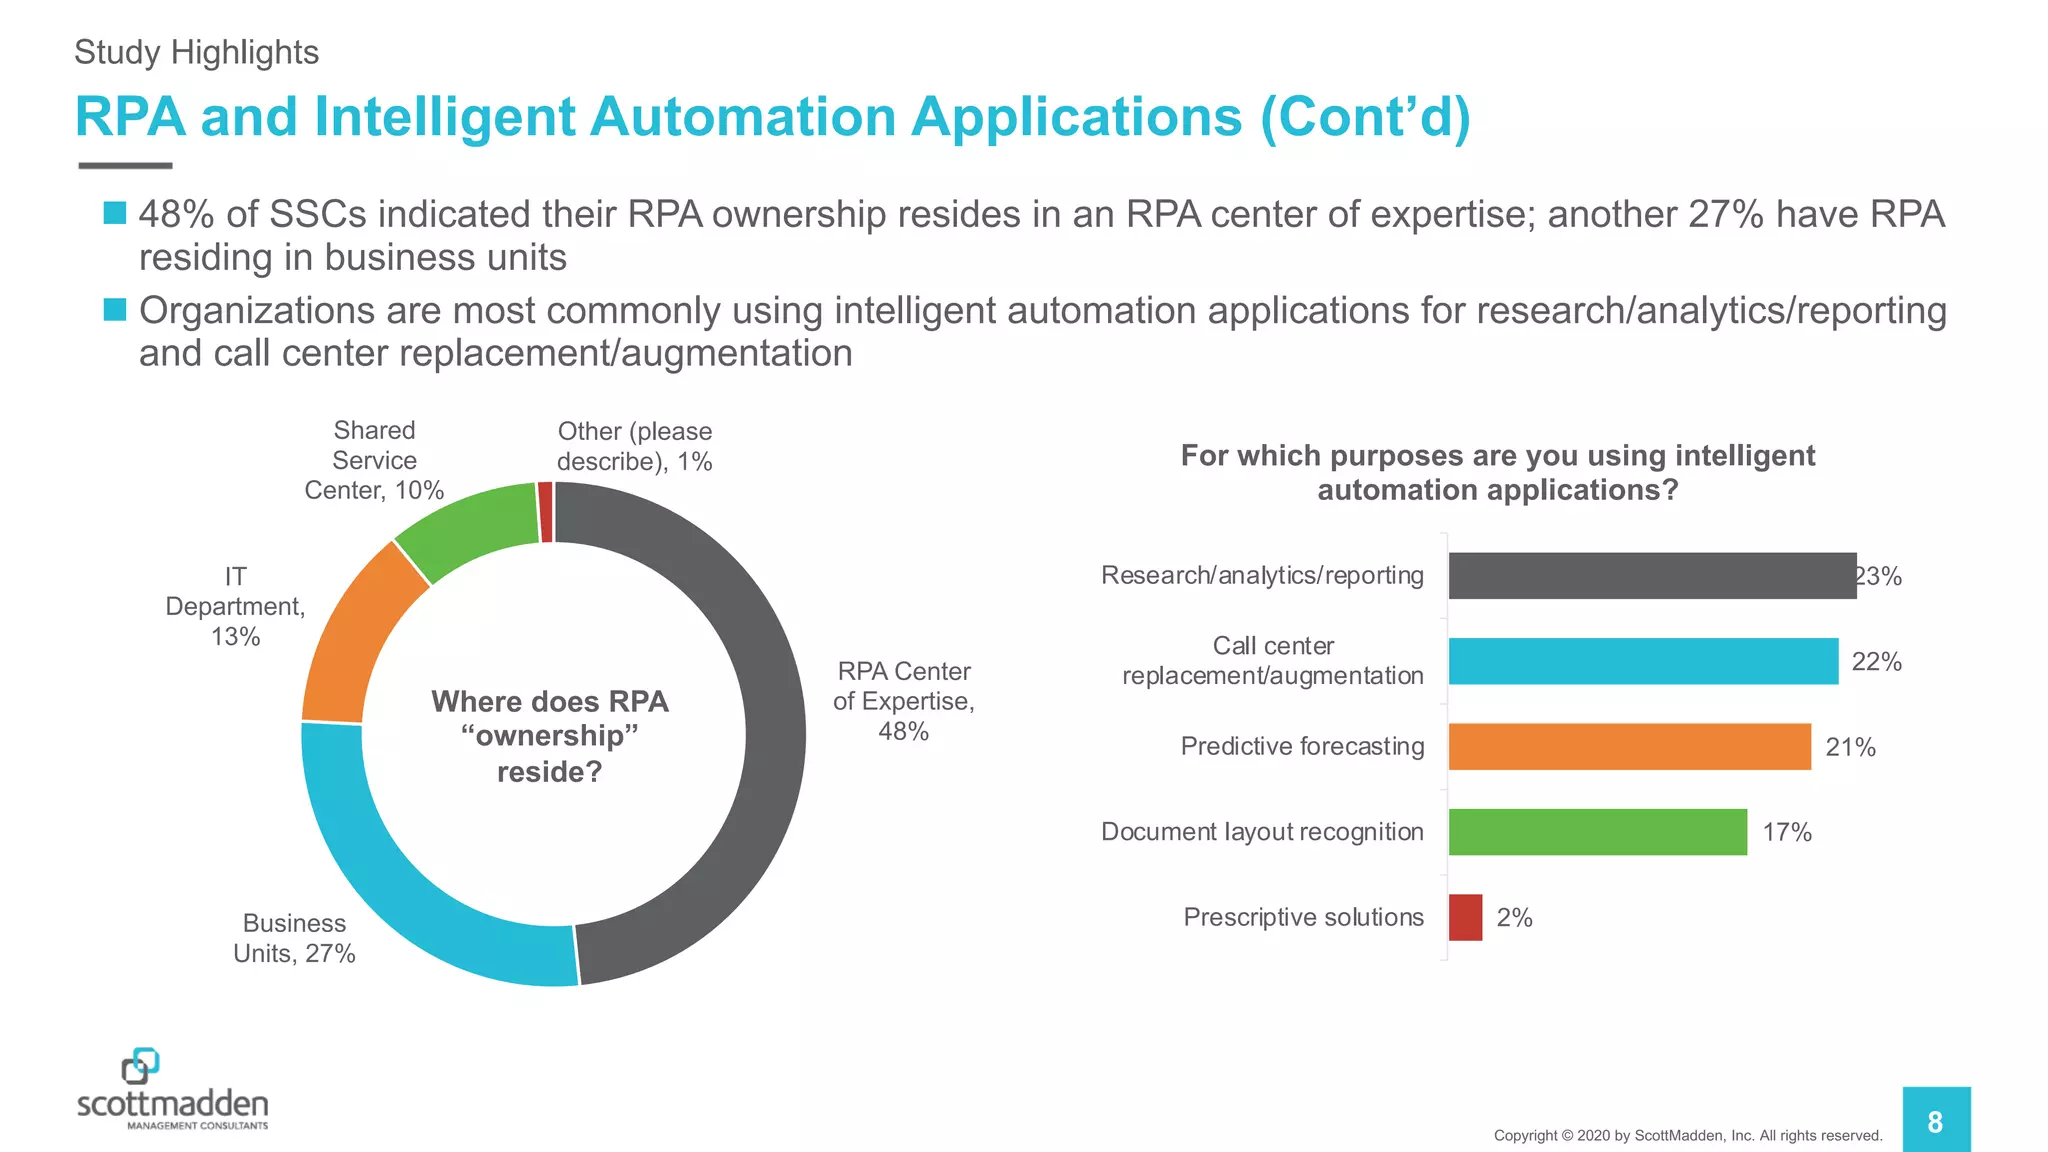
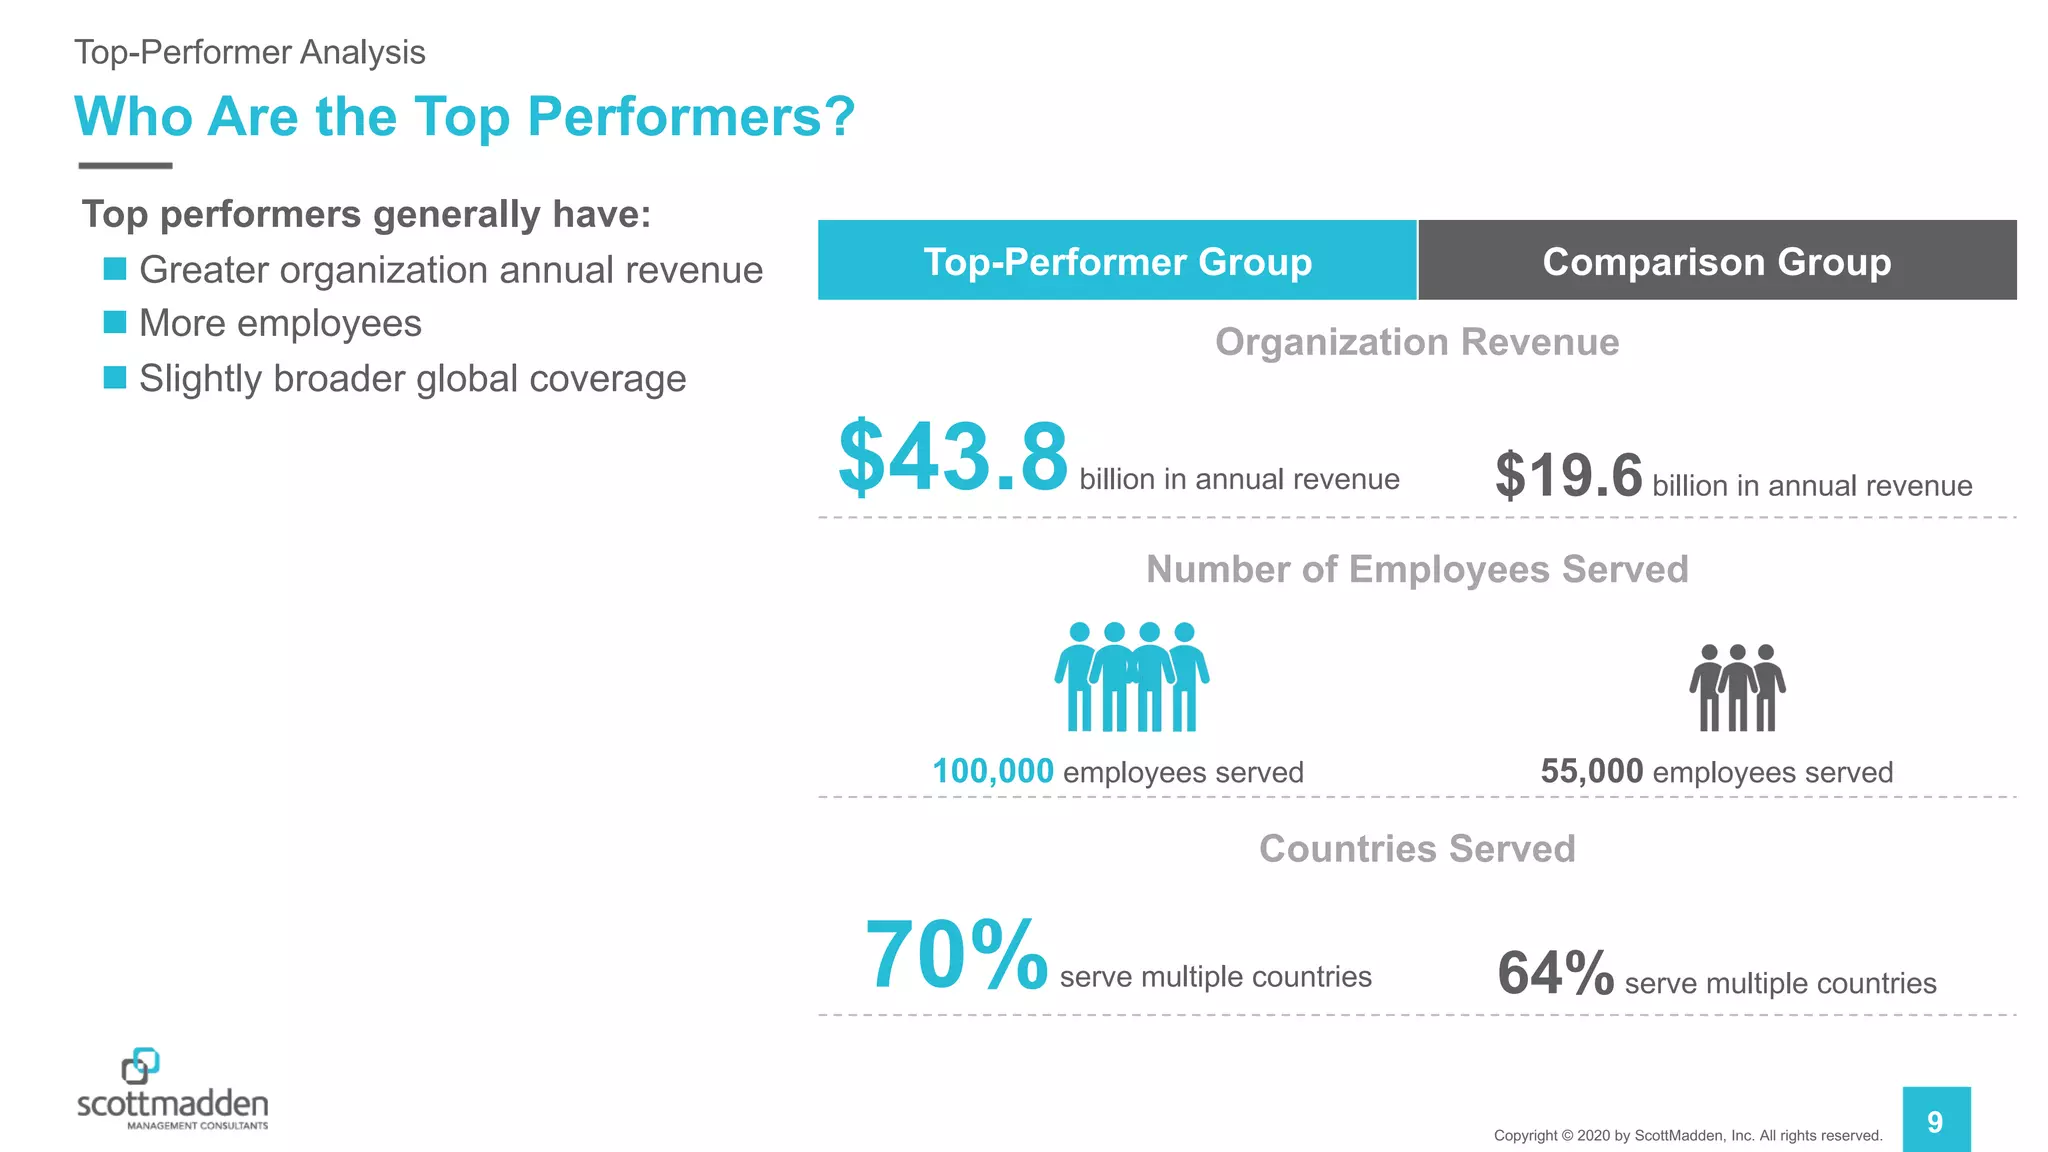
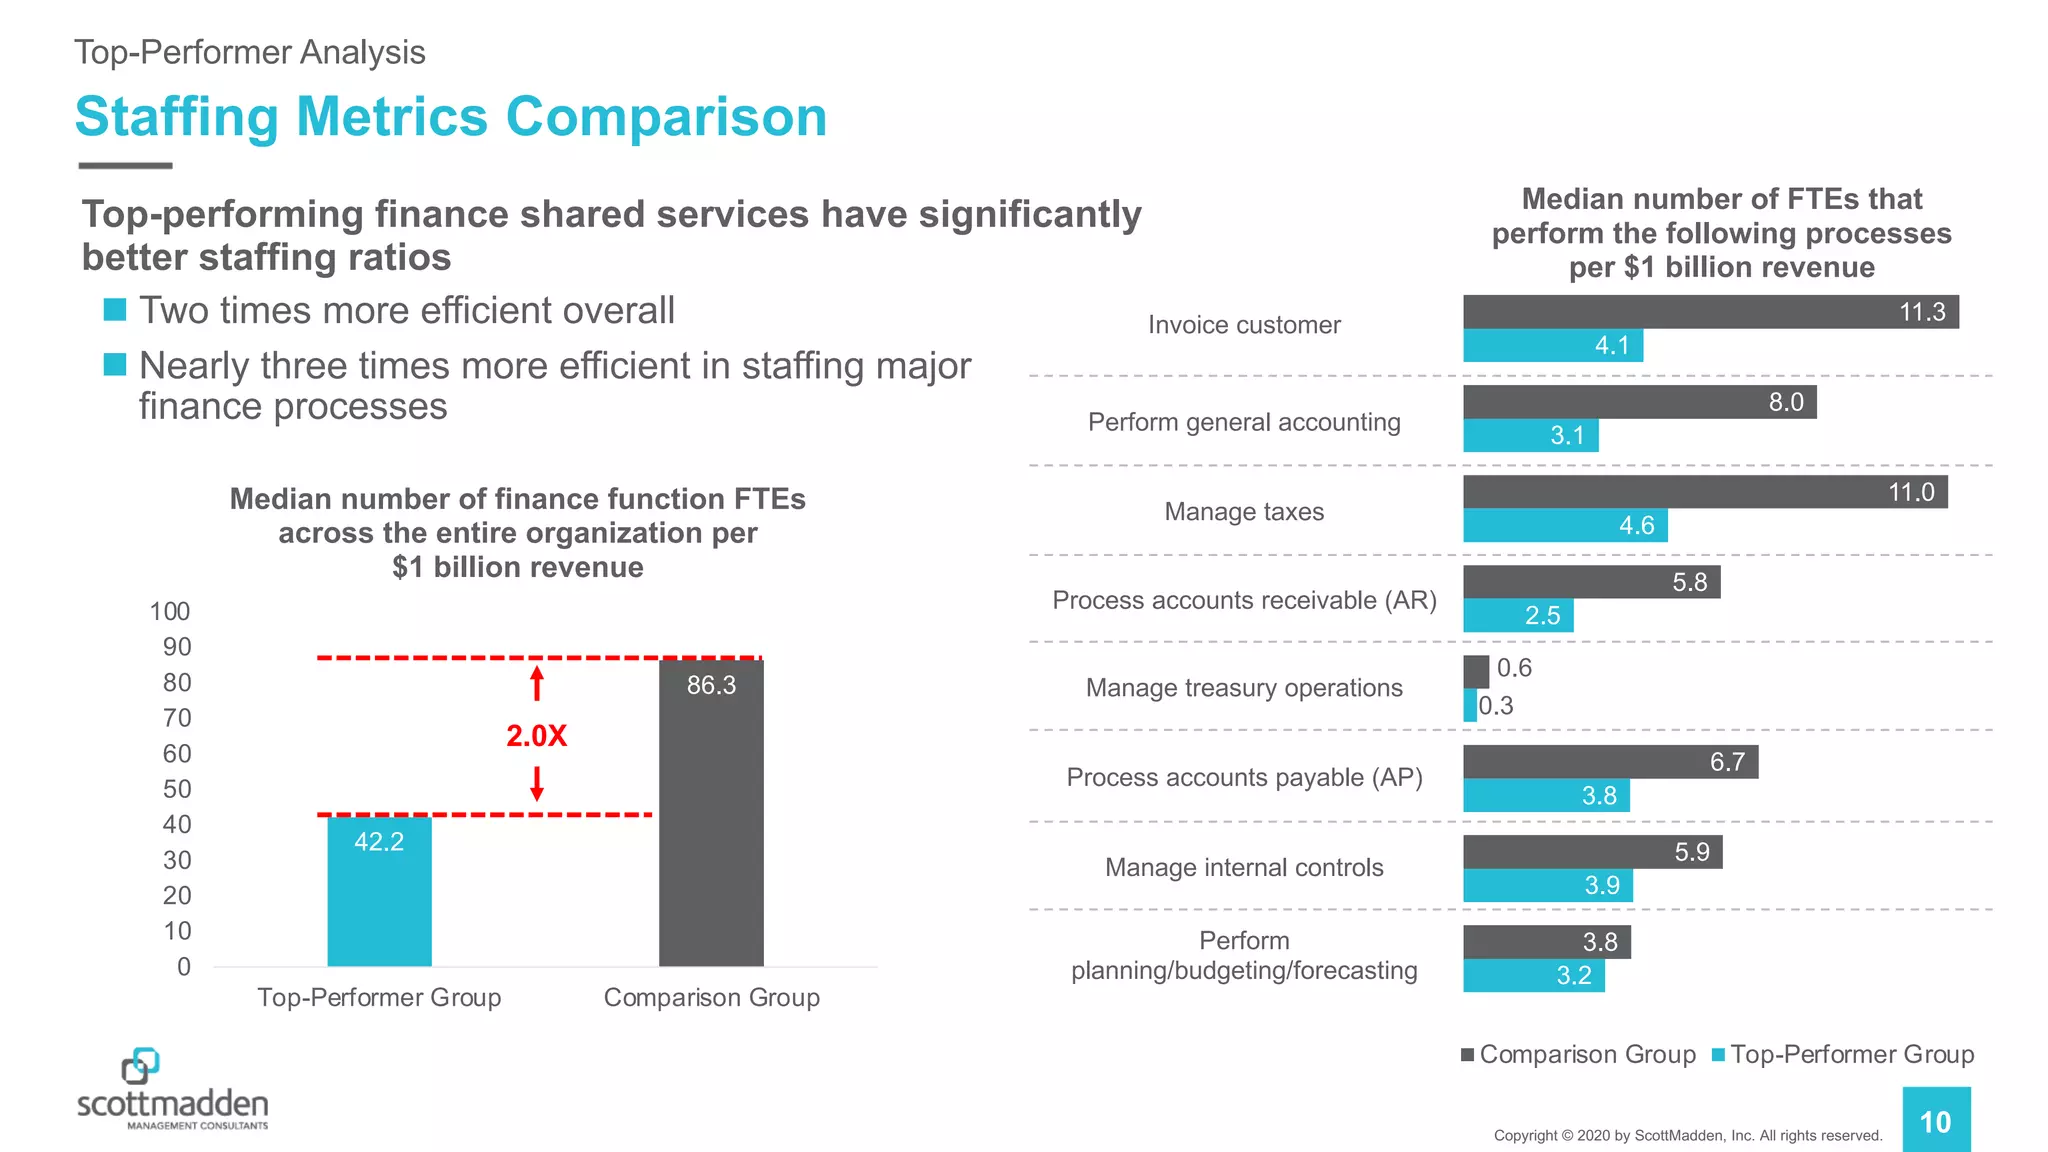
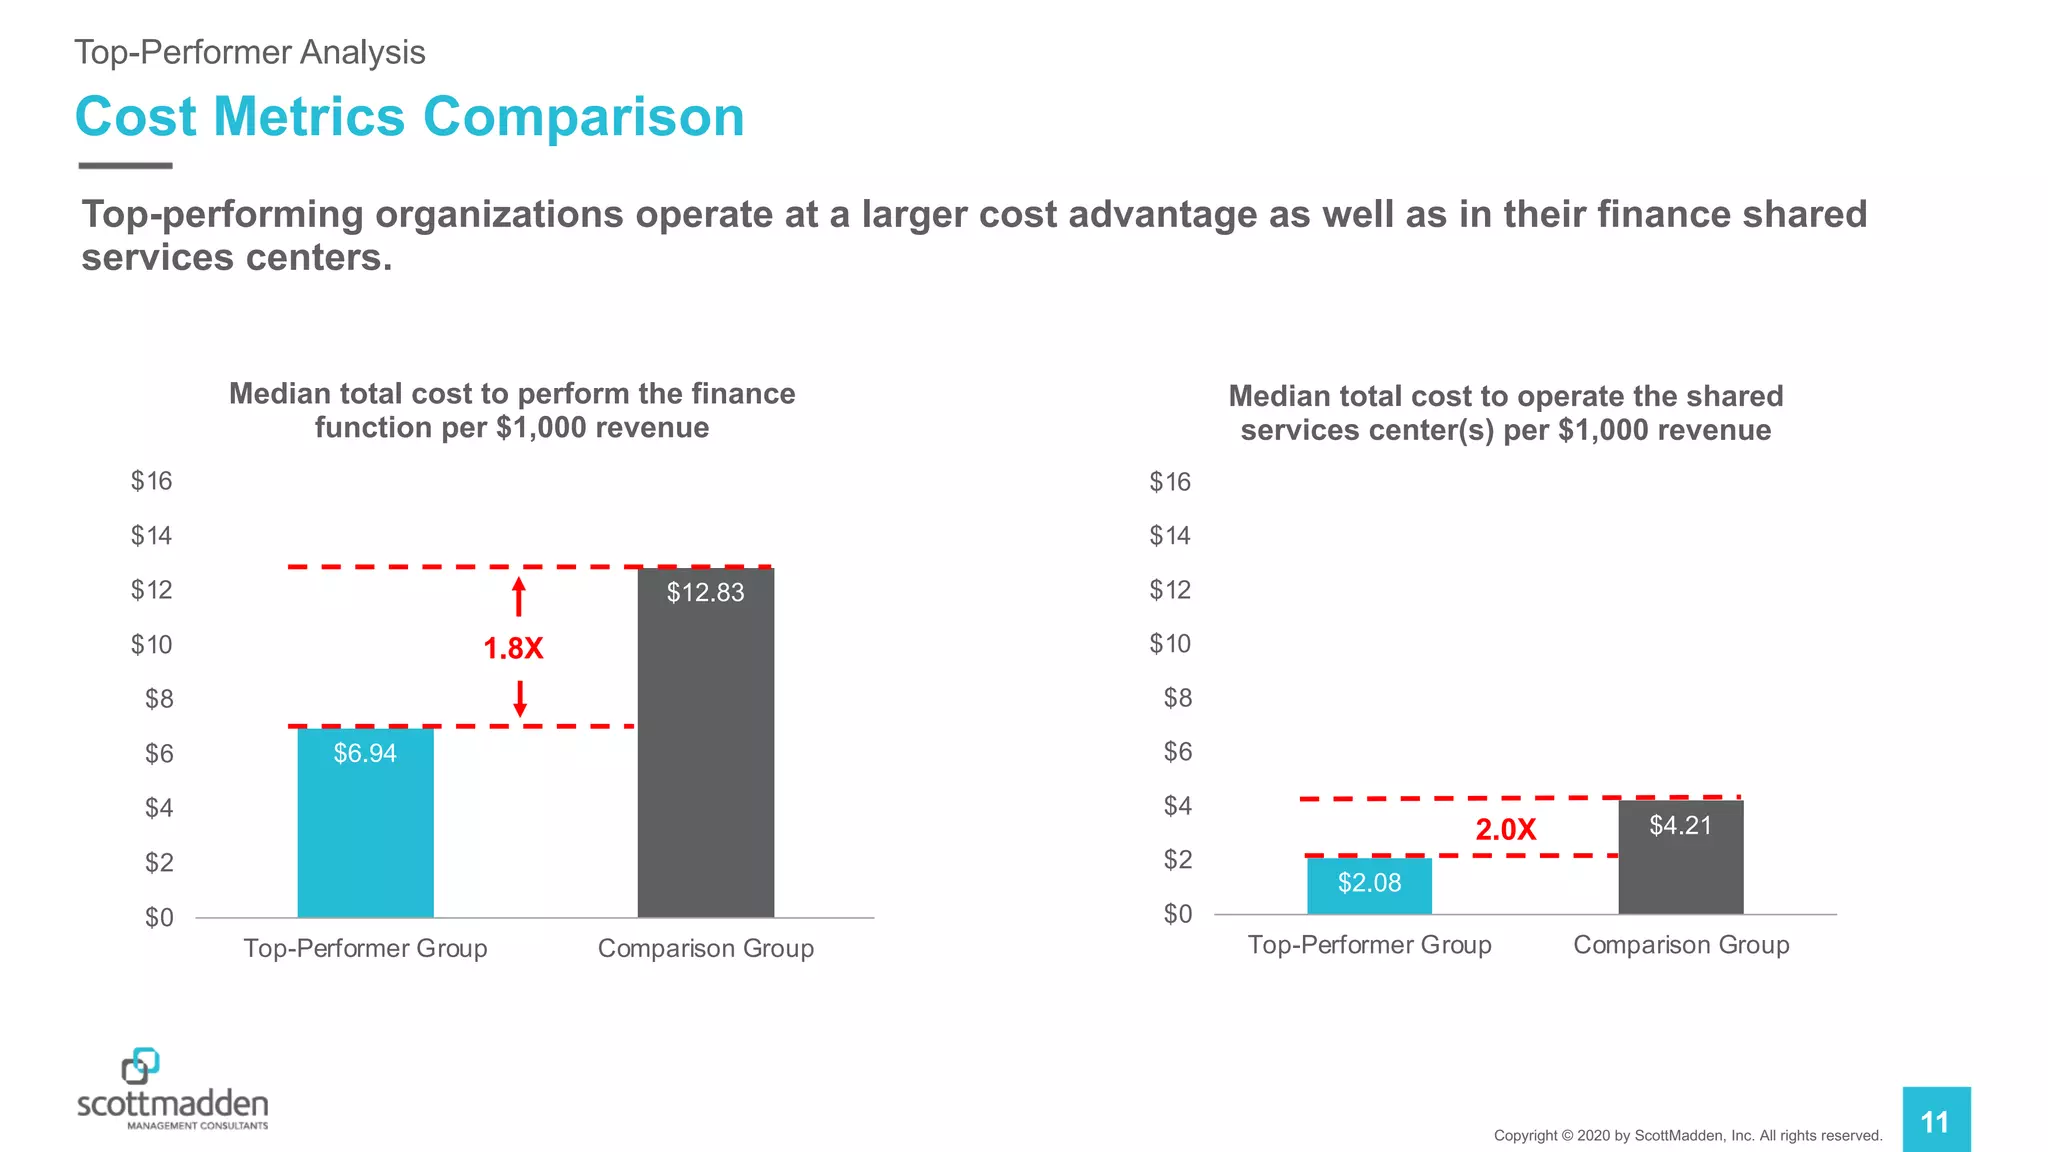
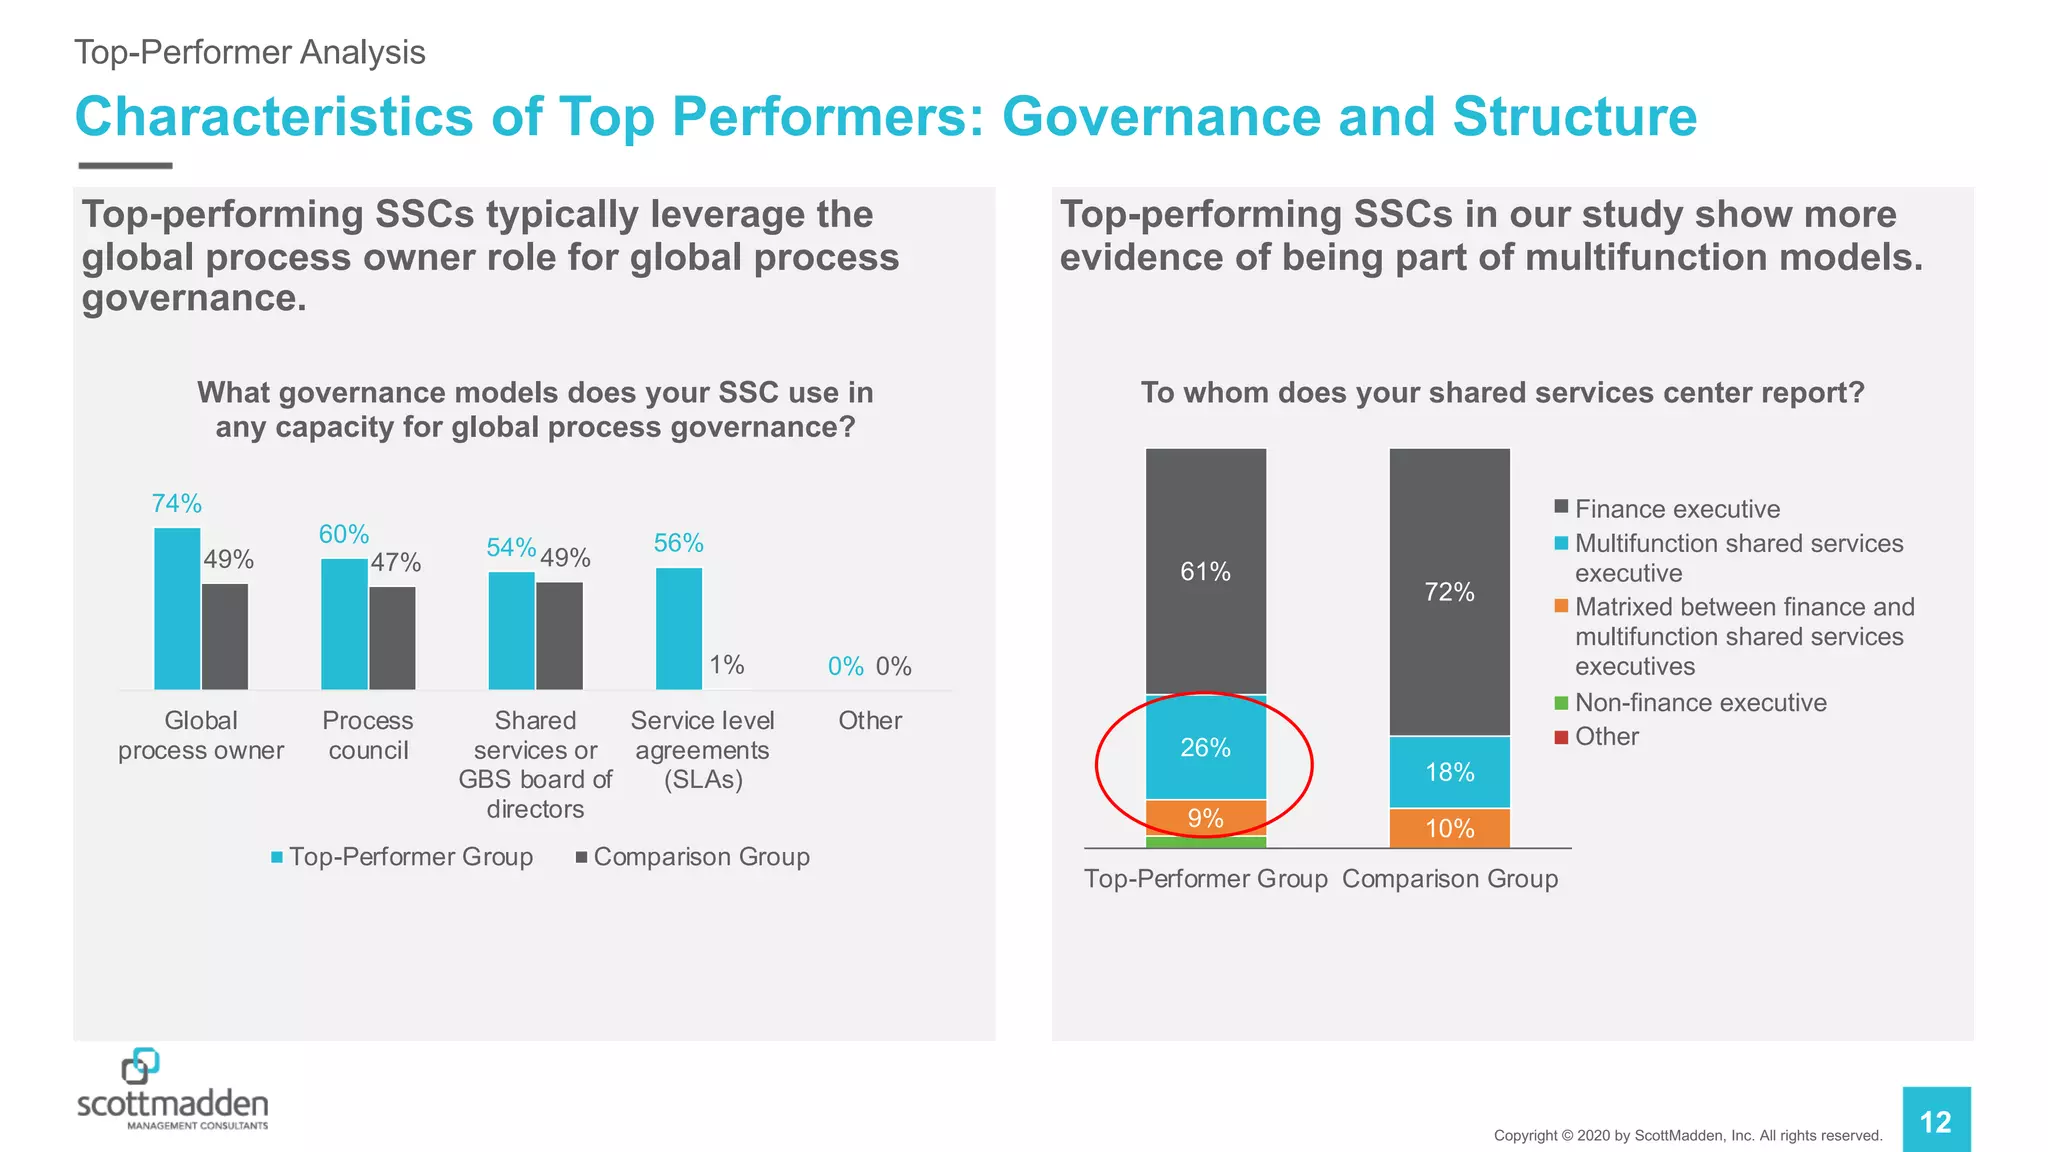
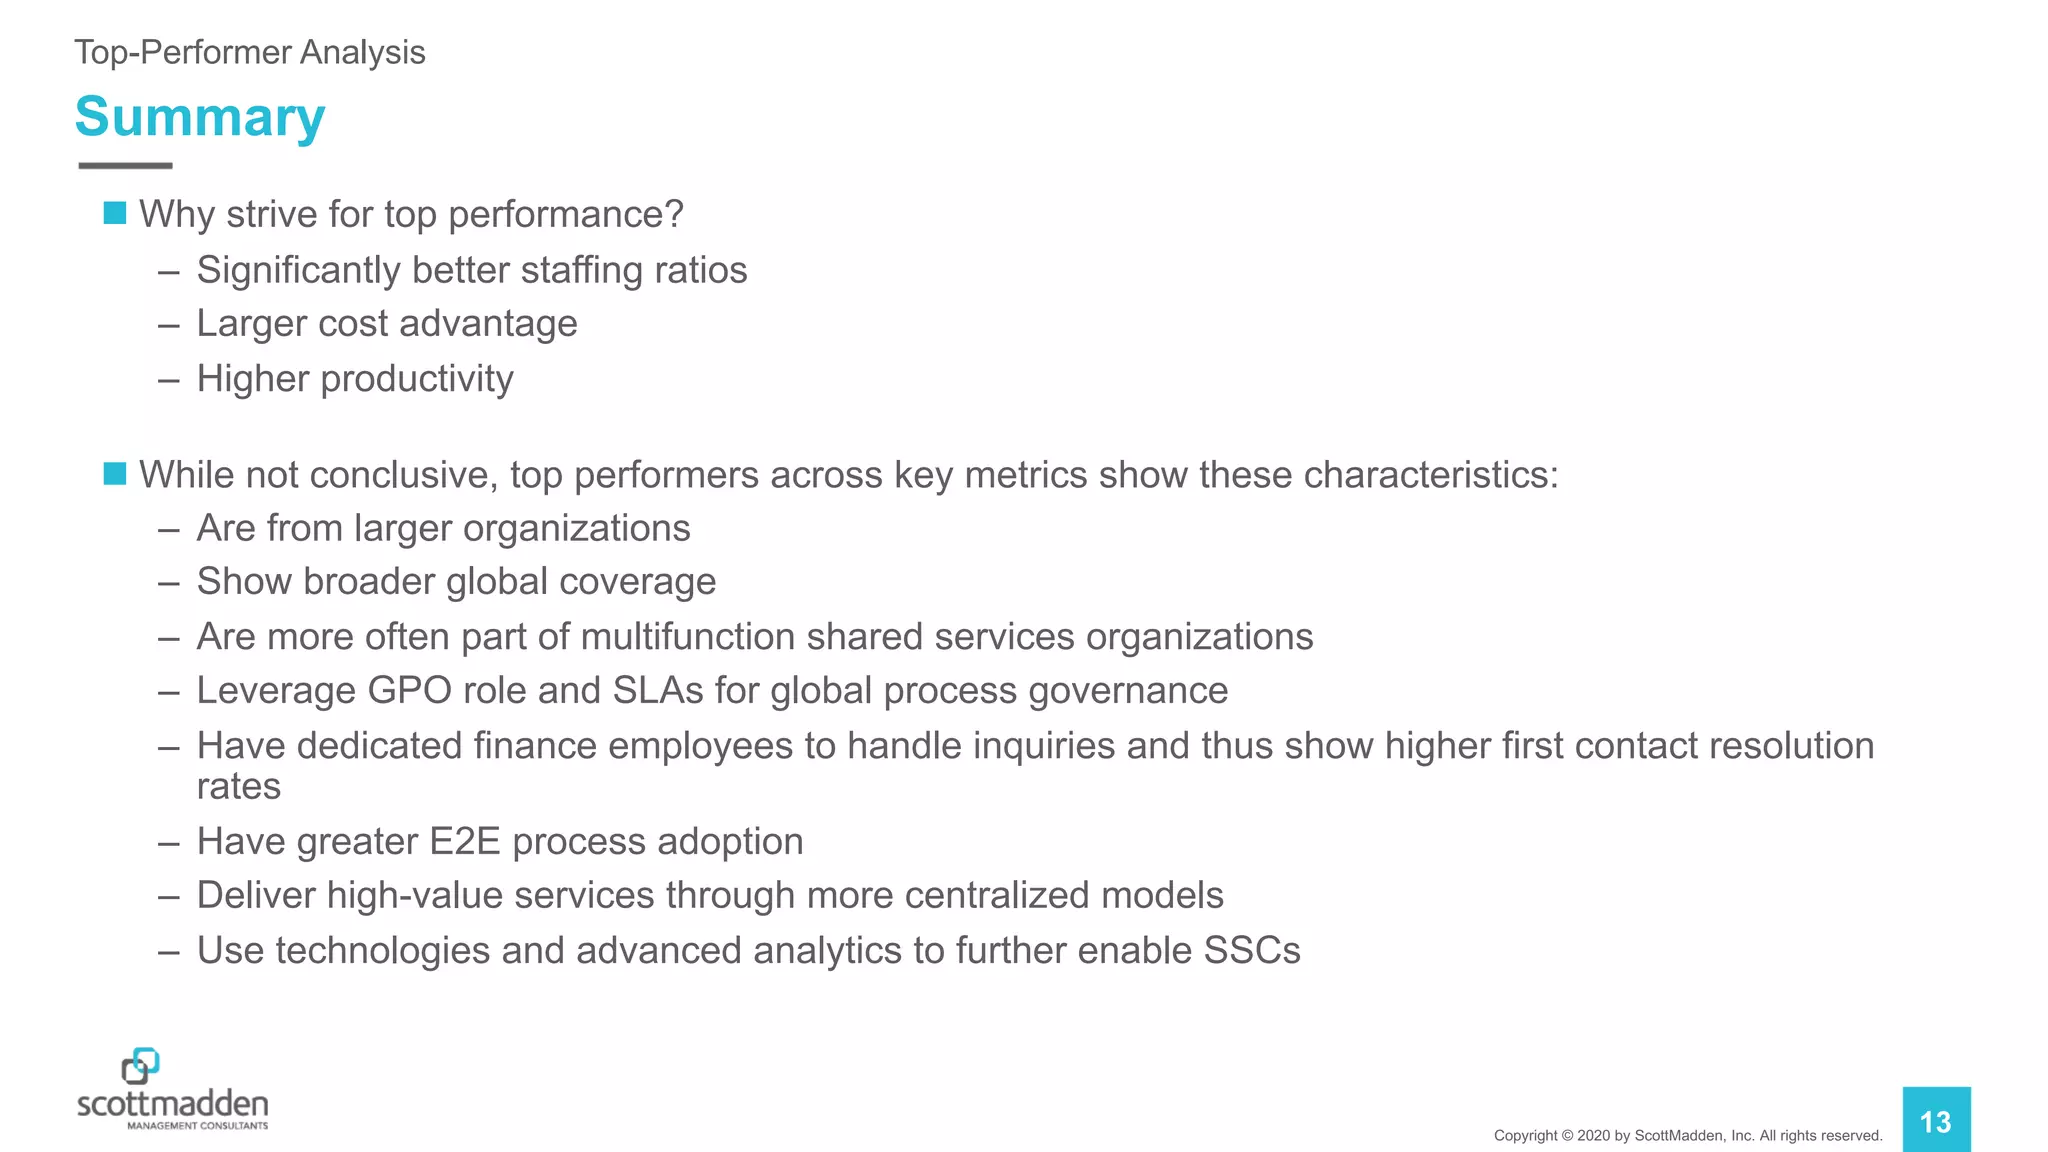

The 2020 Finance Shared Services Benchmarking Study, conducted by ScottMadden and APQC, involved 200 participants and focused on areas such as service scope, technology, staffing, and performance metrics. Key findings indicate that the majority of shared services centers utilize a global business services model, with significant participation in North America and diverse services provided across multiple countries. Top-performing organizations demonstrate better staffing ratios, larger cost advantages, and higher productivity, often leveraging advanced technologies and analytics to enhance their operations.


