Download as PDF, PPTX
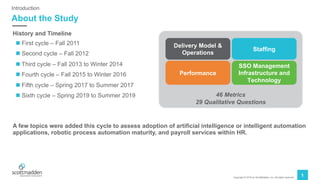
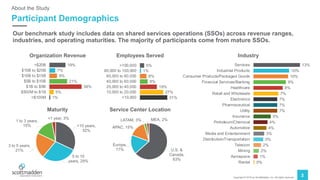
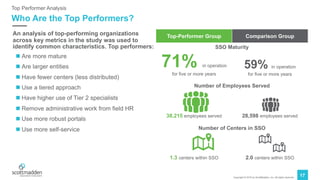

The document summarizes findings from a benchmarking study of HR shared services conducted by ScottMadden and APQC. It highlights metrics related to staffing models, service delivery, technology adoption, and intelligent automation usage. Top performers tended to be more mature organizations serving more employees across fewer centers using specialized staffing and self-service technologies. The study involved 46 metrics and 29 questions across various industries.


