Download as PDF, PPTX


![Scan chain Repartitioning
slide 12
Figure. Proposed scan partition of s1238 benchmark, (a) Original
scan chains, (b) Connections removed and repartitioned according to
the algorithm, (c) reconnection scan cells
[1] Y. Bonhomme, P. Girard, L. Guiller, C. Landrault et al., “Design of routing-constrained low power scan chains,” Design, Automation and Test in Europe
Conference and Exhibition (DATE), pp. 62-67, 2004
We perform layout synthesis so that the scan chain repartition technique
can have layout awareness](https://image.slidesharecdn.com/20151119sharif-170111053722/75/Scan-Segmentation-Approach-to-Magnify-Detection-Sensitivity-for-Tiny-Hardware-Trojan-12-2048.jpg)

![Scan chain segmentation
slide 14
[1] K. Hong, K. Cheong, K. Sung, “A New Scan Partition Scheme for Low-Power Embedded Systems,” Electronics and Telecommunications Research
Institute (ETRI) journal, vol. 30, no. 3, pp. 412-420, 2008.
The scan segmentation architecture similar to [1] with little modification.
In [1] they segment so as the scan chain rippling is restricted during the scan
shift operation where we propose in launch operation.
fixed number of length-balanced
segments
Add additional hardware for
Gated clock controller
Any segment can activate inde-
Pendently by clock gating](https://image.slidesharecdn.com/20151119sharif-170111053722/75/Scan-Segmentation-Approach-to-Magnify-Detection-Sensitivity-for-Tiny-Hardware-Trojan-14-2048.jpg)


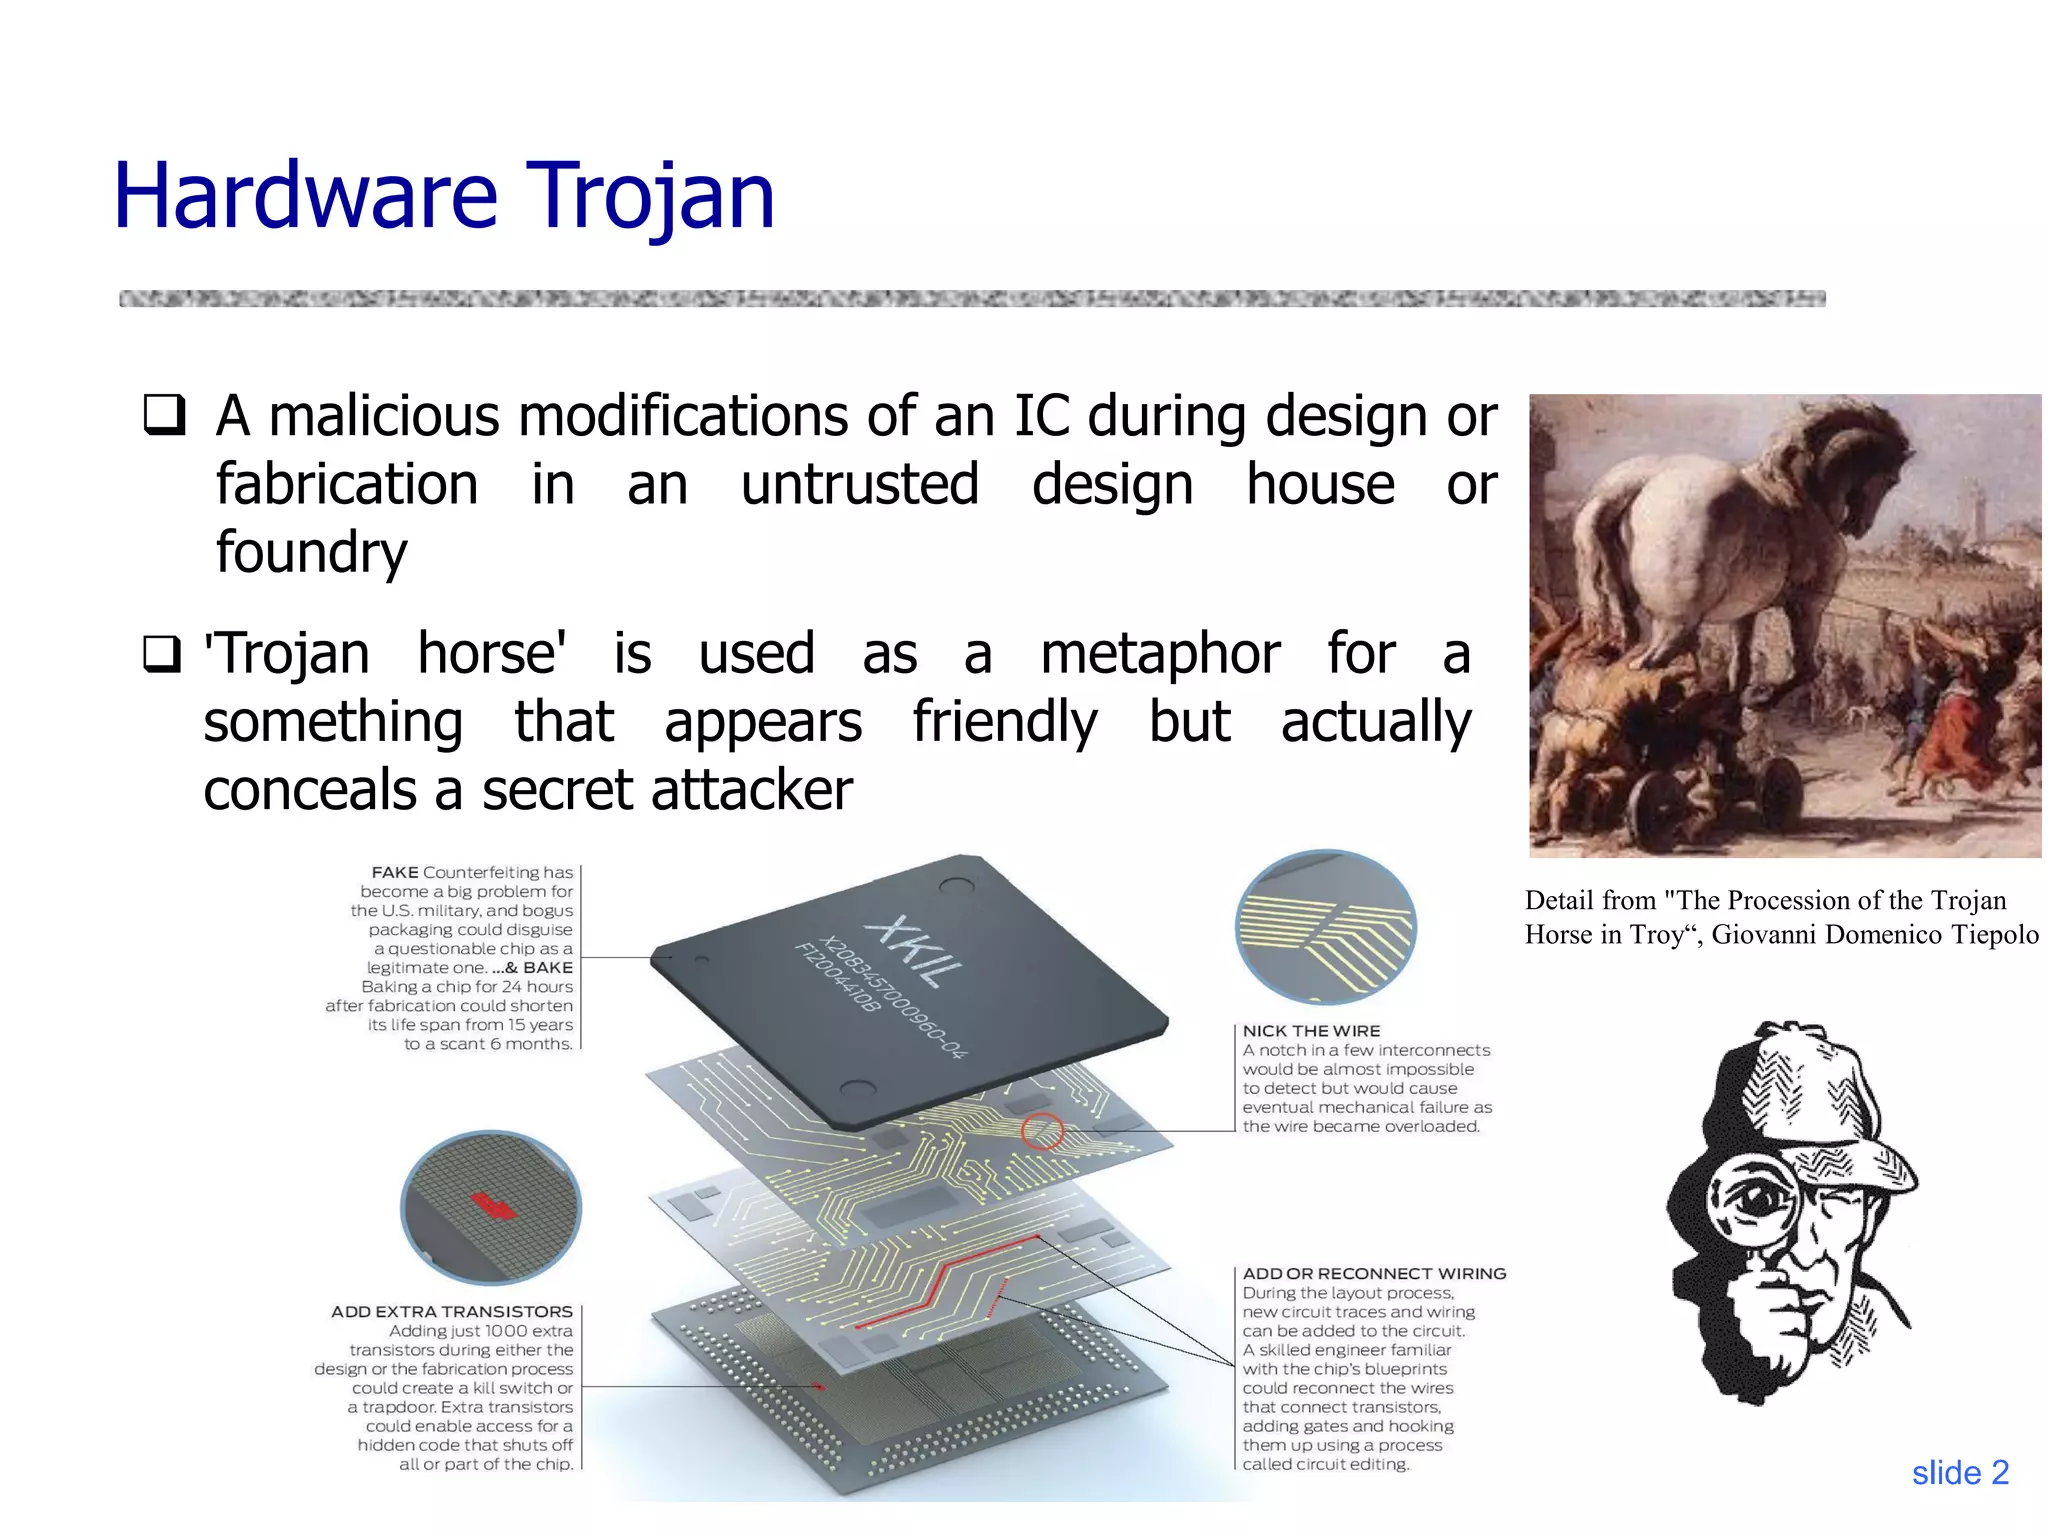
This document presents a scan segmentation approach to magnify hardware Trojan detection sensitivity for tiny Trojans in integrated circuits. The proposed technique consists of four parts: 1) scan chain repartitioning to eliminate longest chains, 2) scan chain segmentation using clock gating, 3) applying test patterns using launch-on-capture mode to individual segments, and 4) generating Trojan detection golden patterns (TDGPs) as power fingerprints. Experimental results on benchmark circuit s1238 show the proposed method can detect a small combinational Trojan occupying 0.6% of the area, while normal methods without segmentation cannot. The technique aims to improve detection sensitivity for small Trojans.