Download as PDF, PPTX
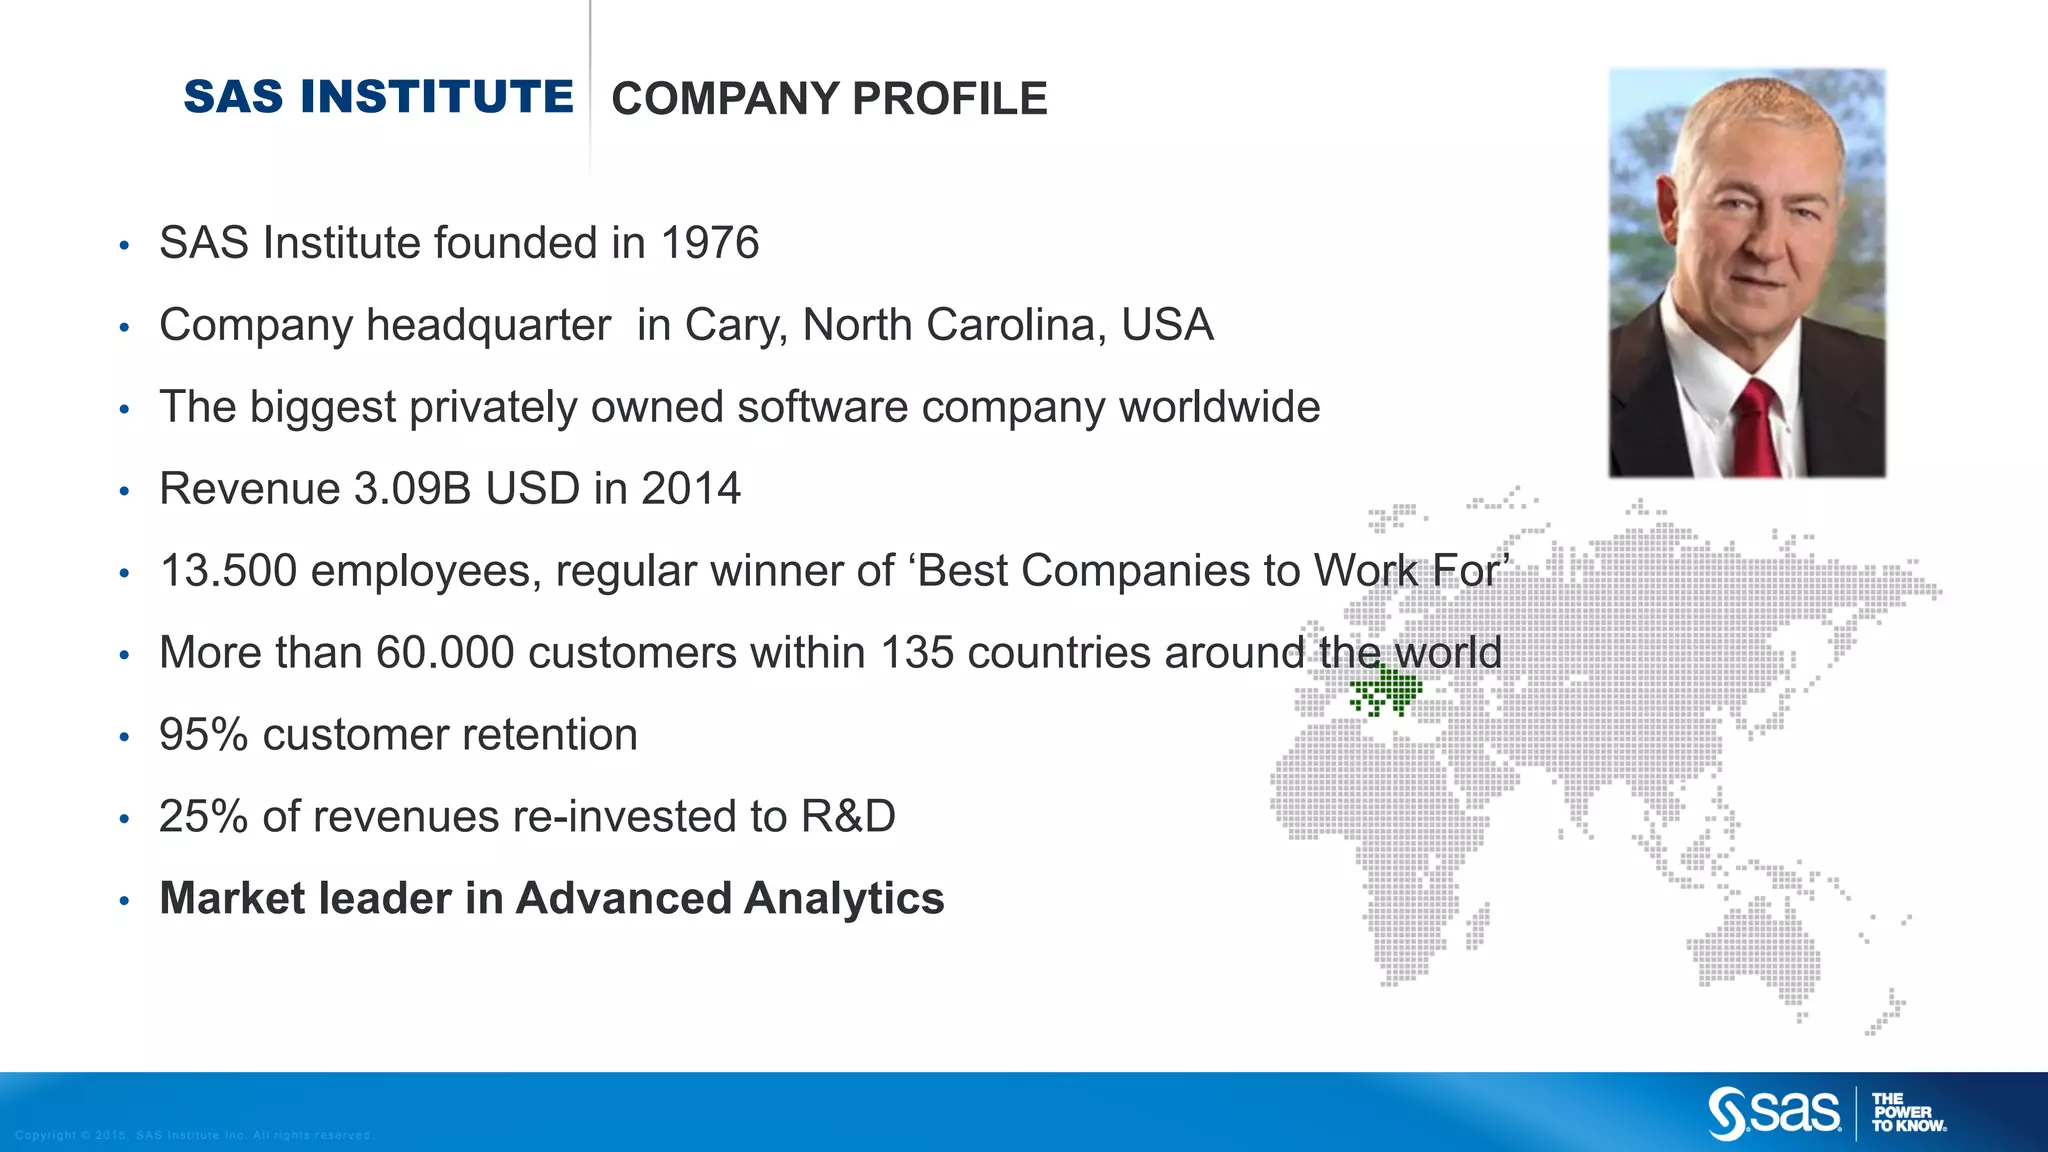
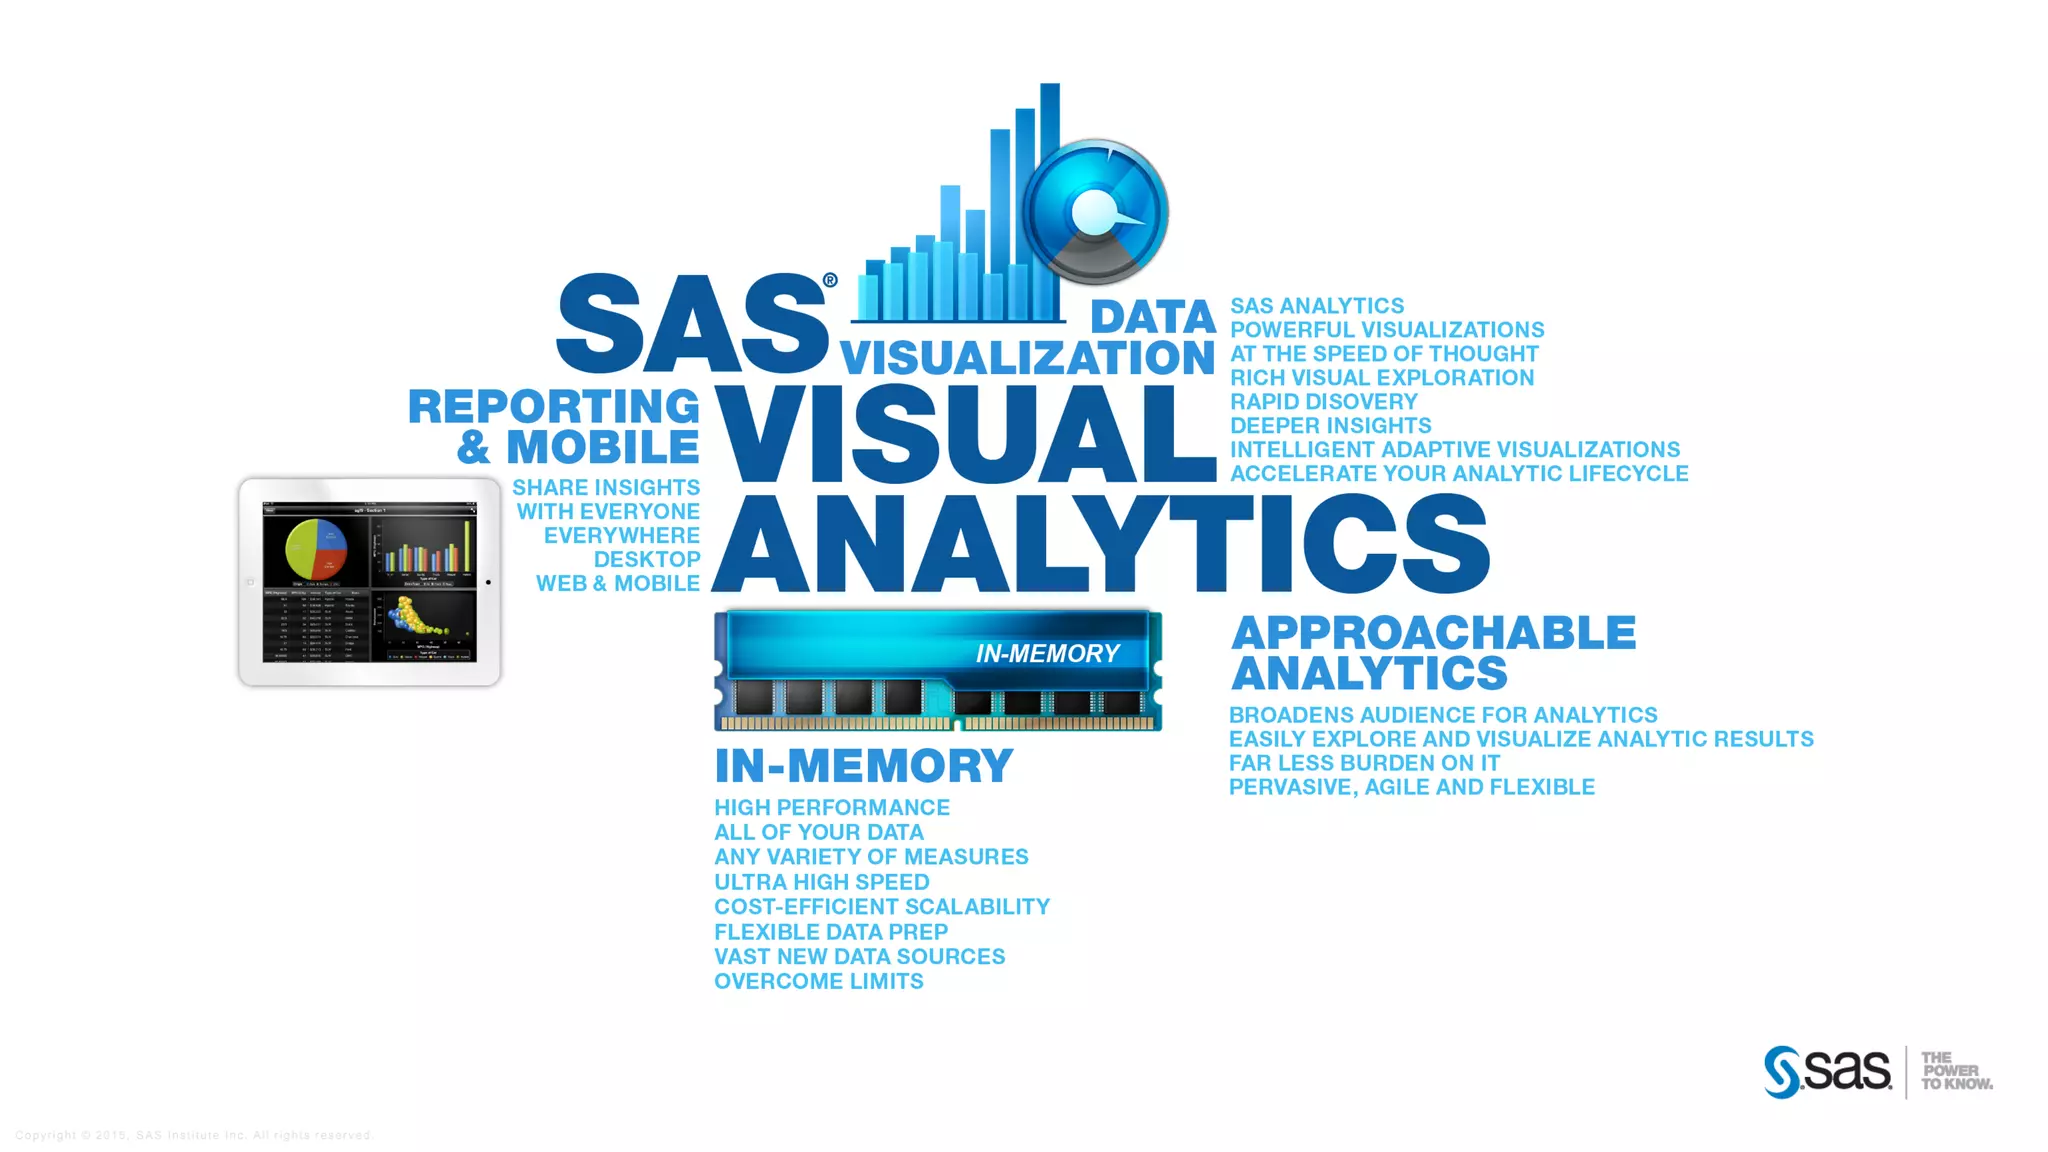
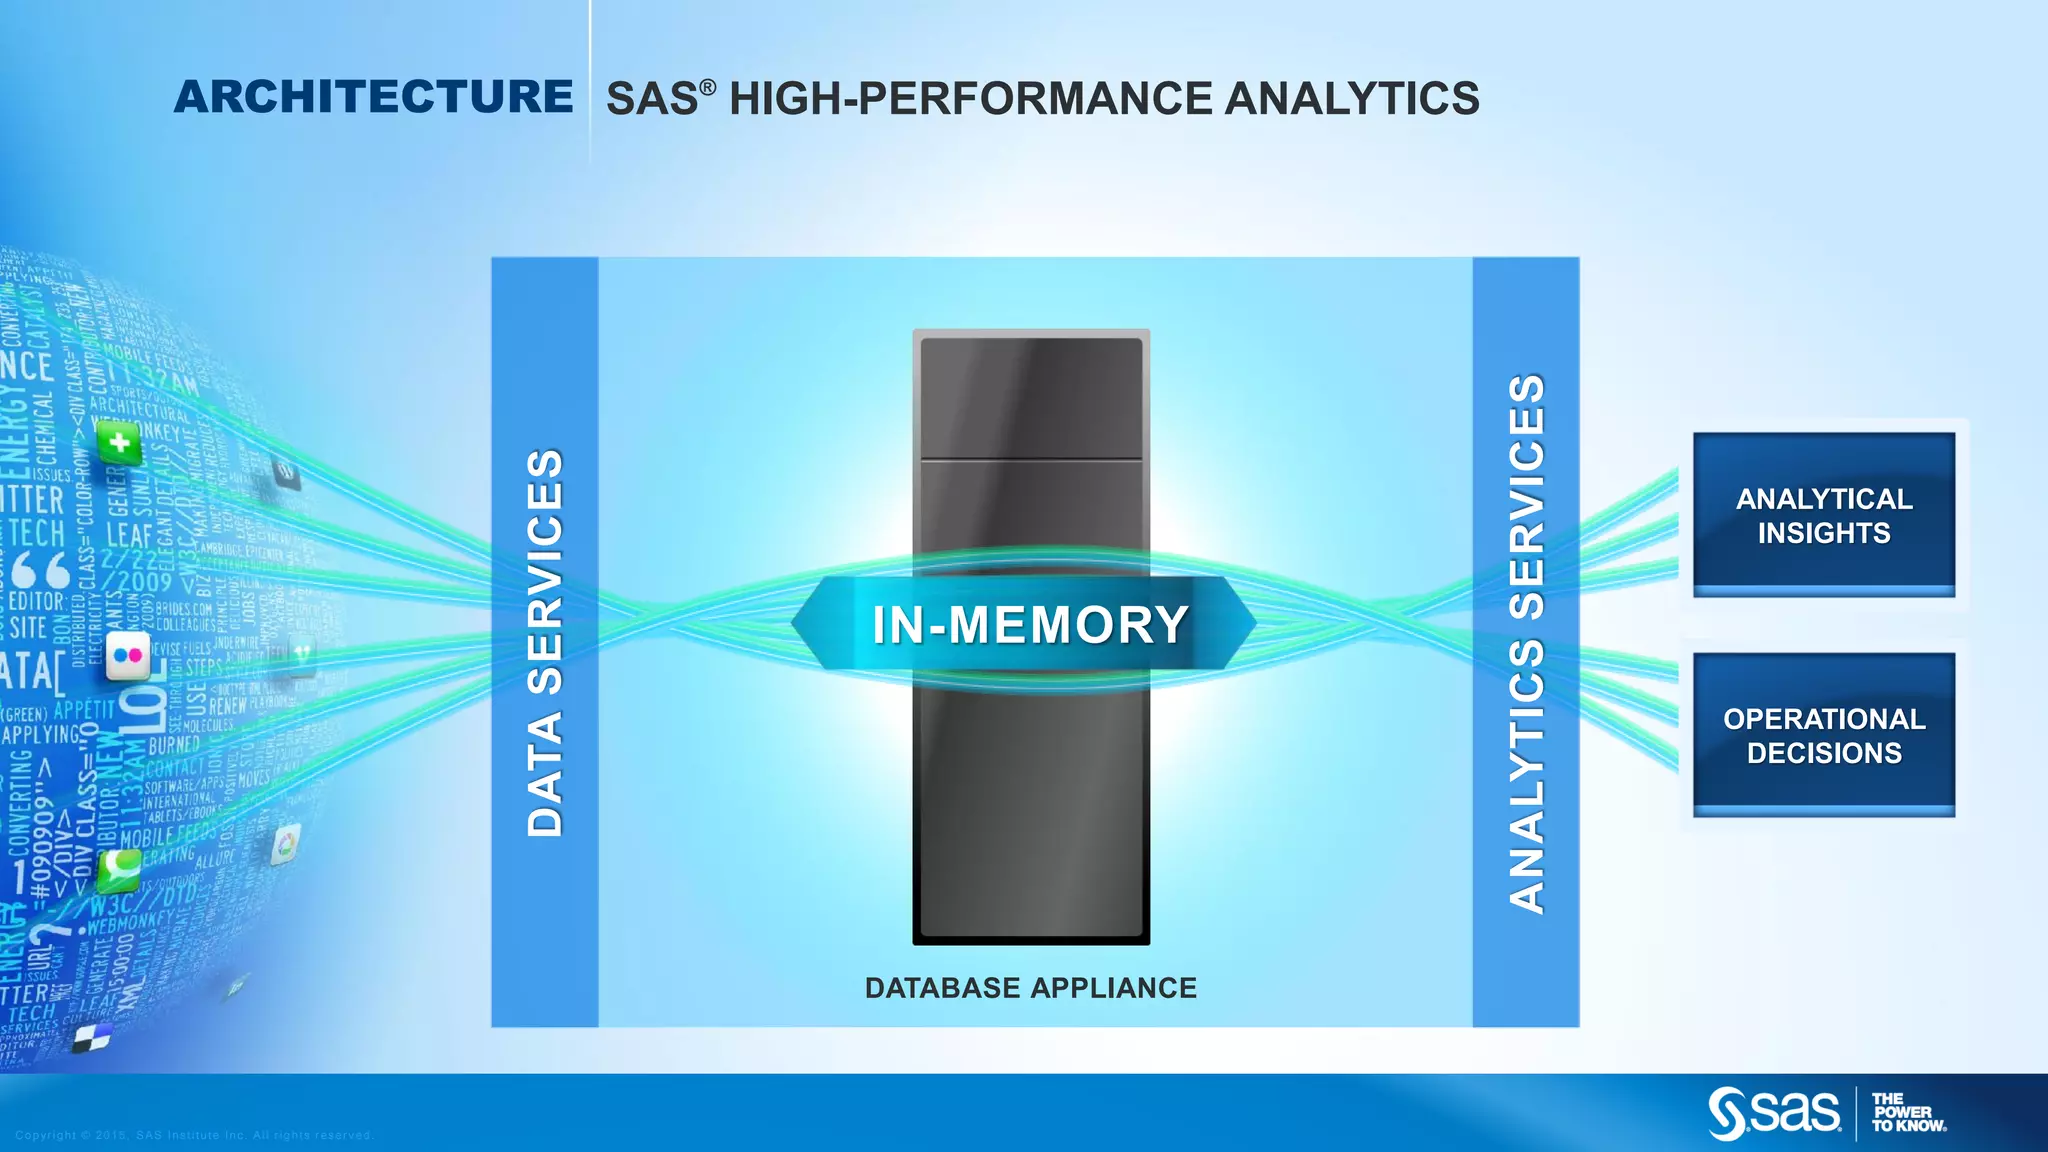
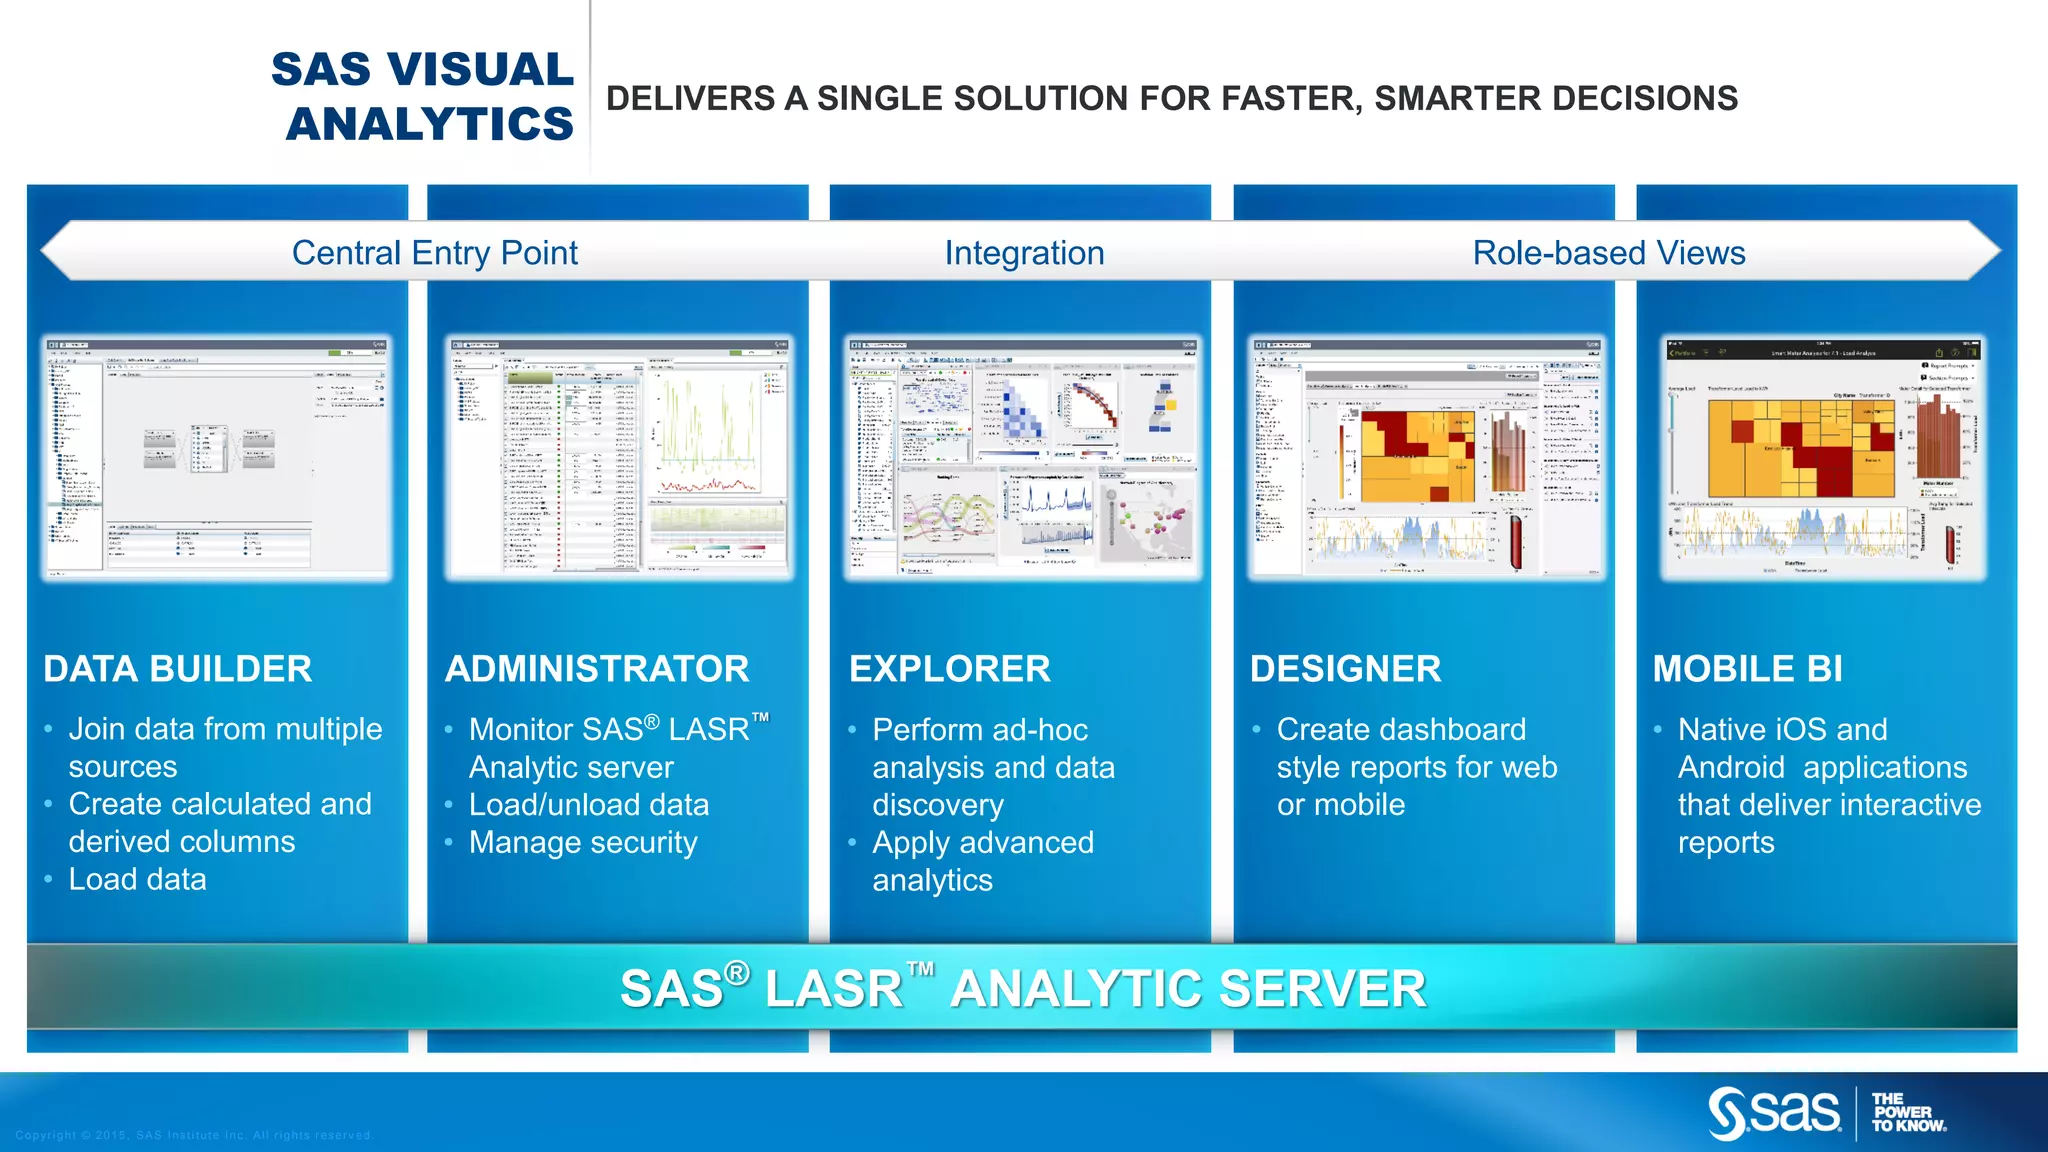
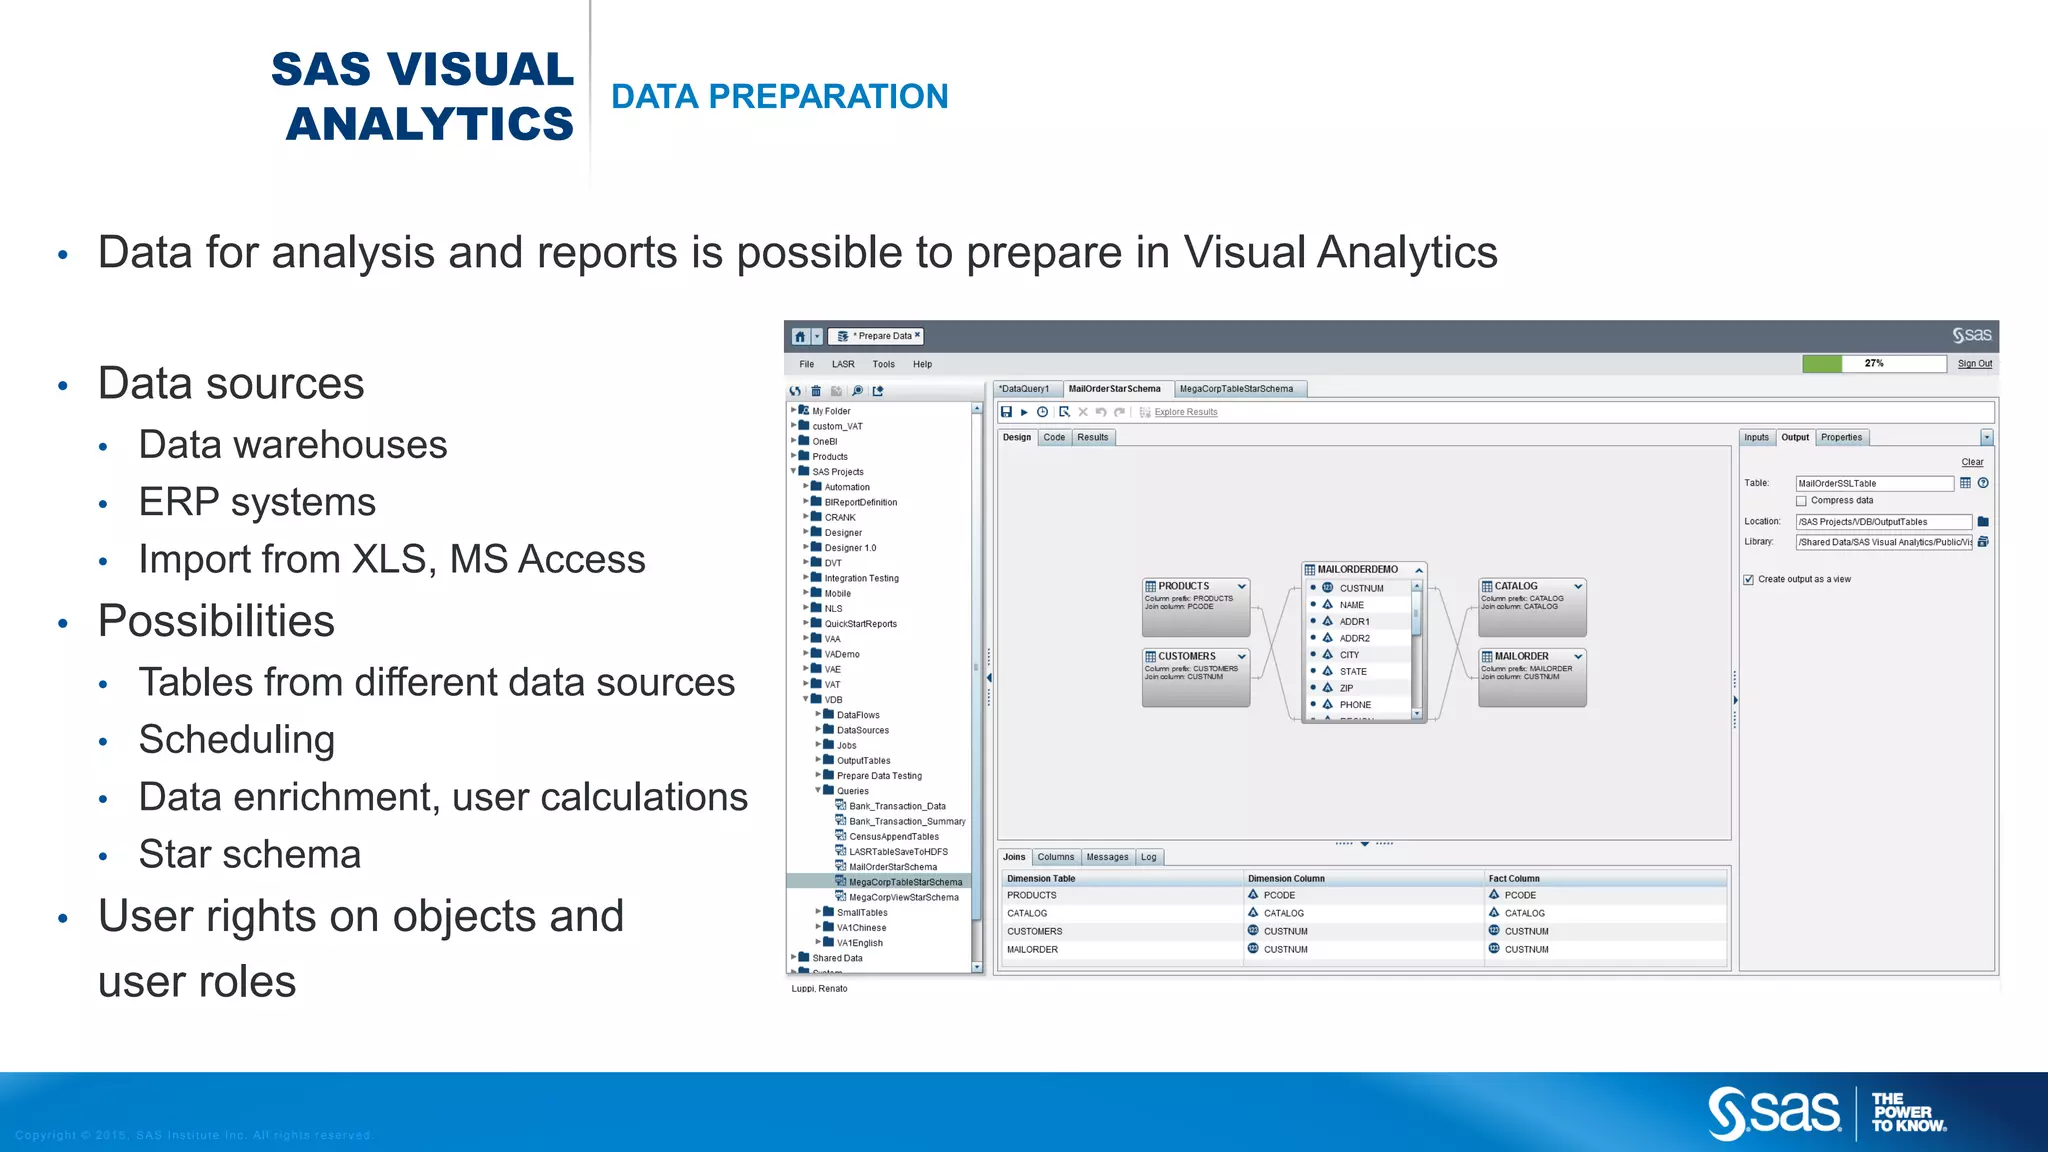
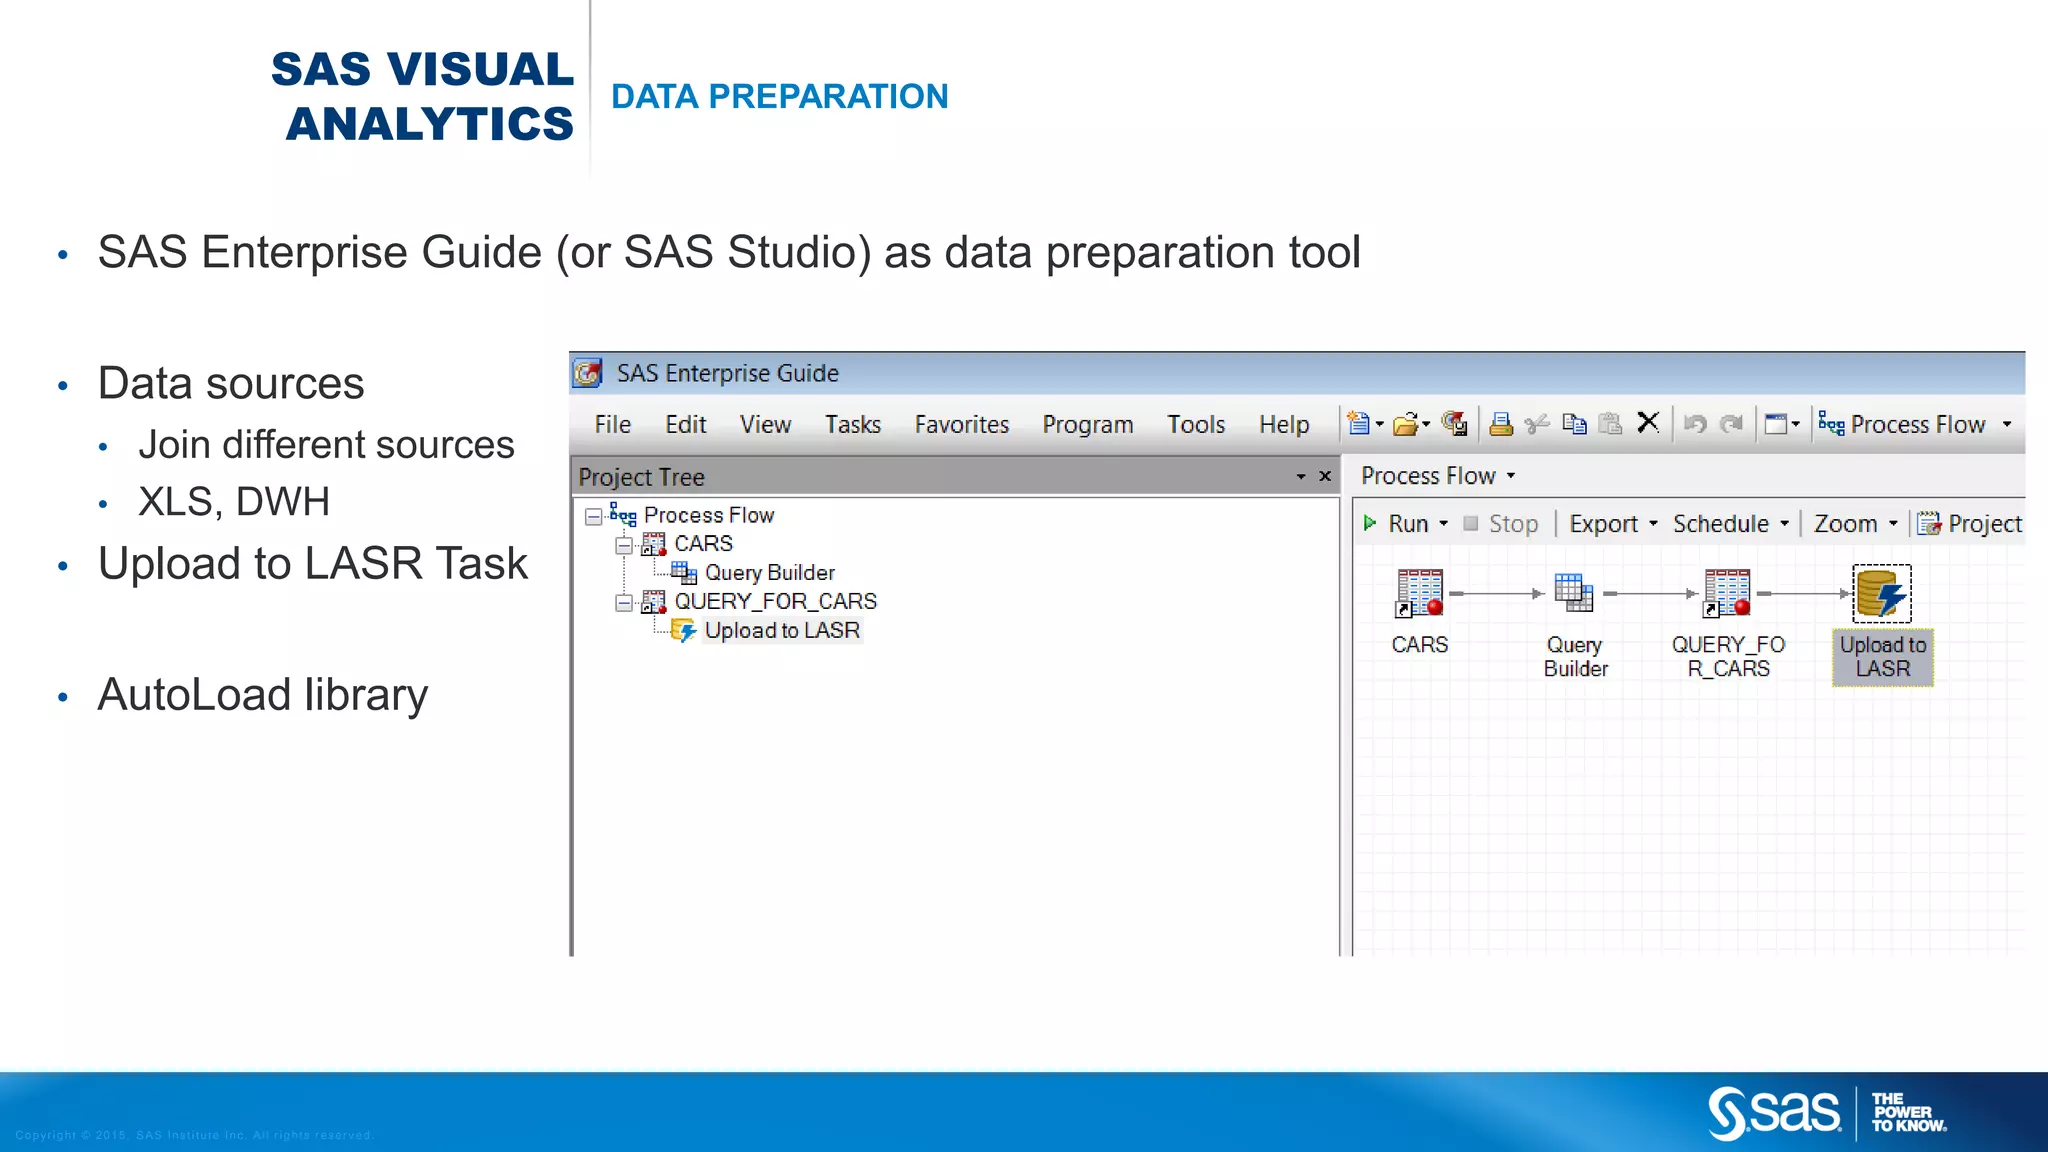
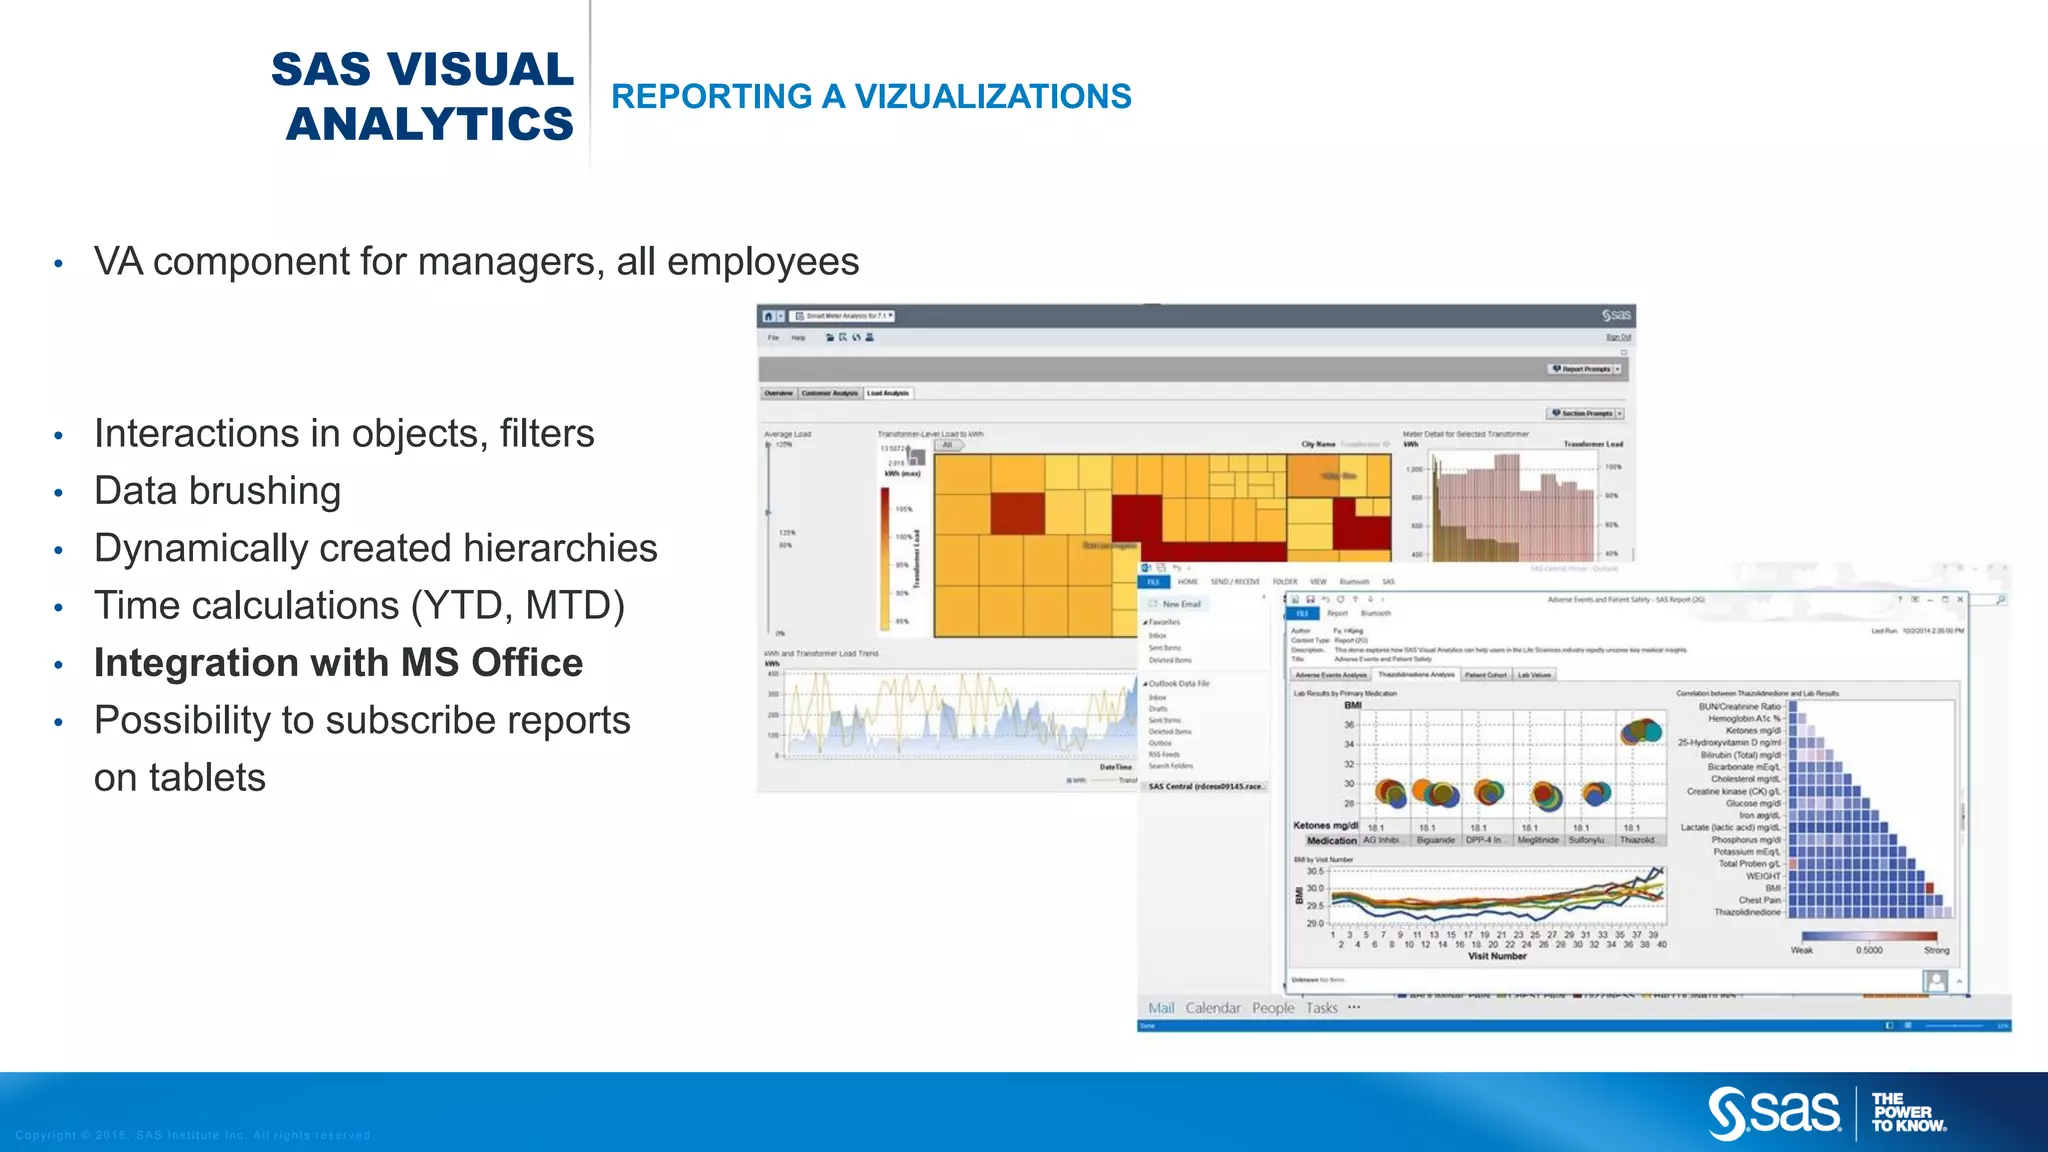

SAS Visual Analytics is a software suite from SAS Institute that provides data preparation, reporting, visualization, and analytics capabilities. SAS Institute is a privately held company founded in 1976 with headquarters in Cary, North Carolina. It has over 13,500 employees serving over 60,000 customers in 135 countries. SAS Visual Analytics integrates data from multiple sources and allows users to explore and analyze data through interactive reports on mobile devices or dashboards.


![Vibe Coding vs. Spec-Driven Development [Free Meetup]](https://cdn.slidesharecdn.com/ss_thumbnails/vibecodingvsspecdrivendevelopment-251209105622-43f455e7-thumbnail.jpg?width=640&height=640&fit=bounds)


