Downloaded 184 times

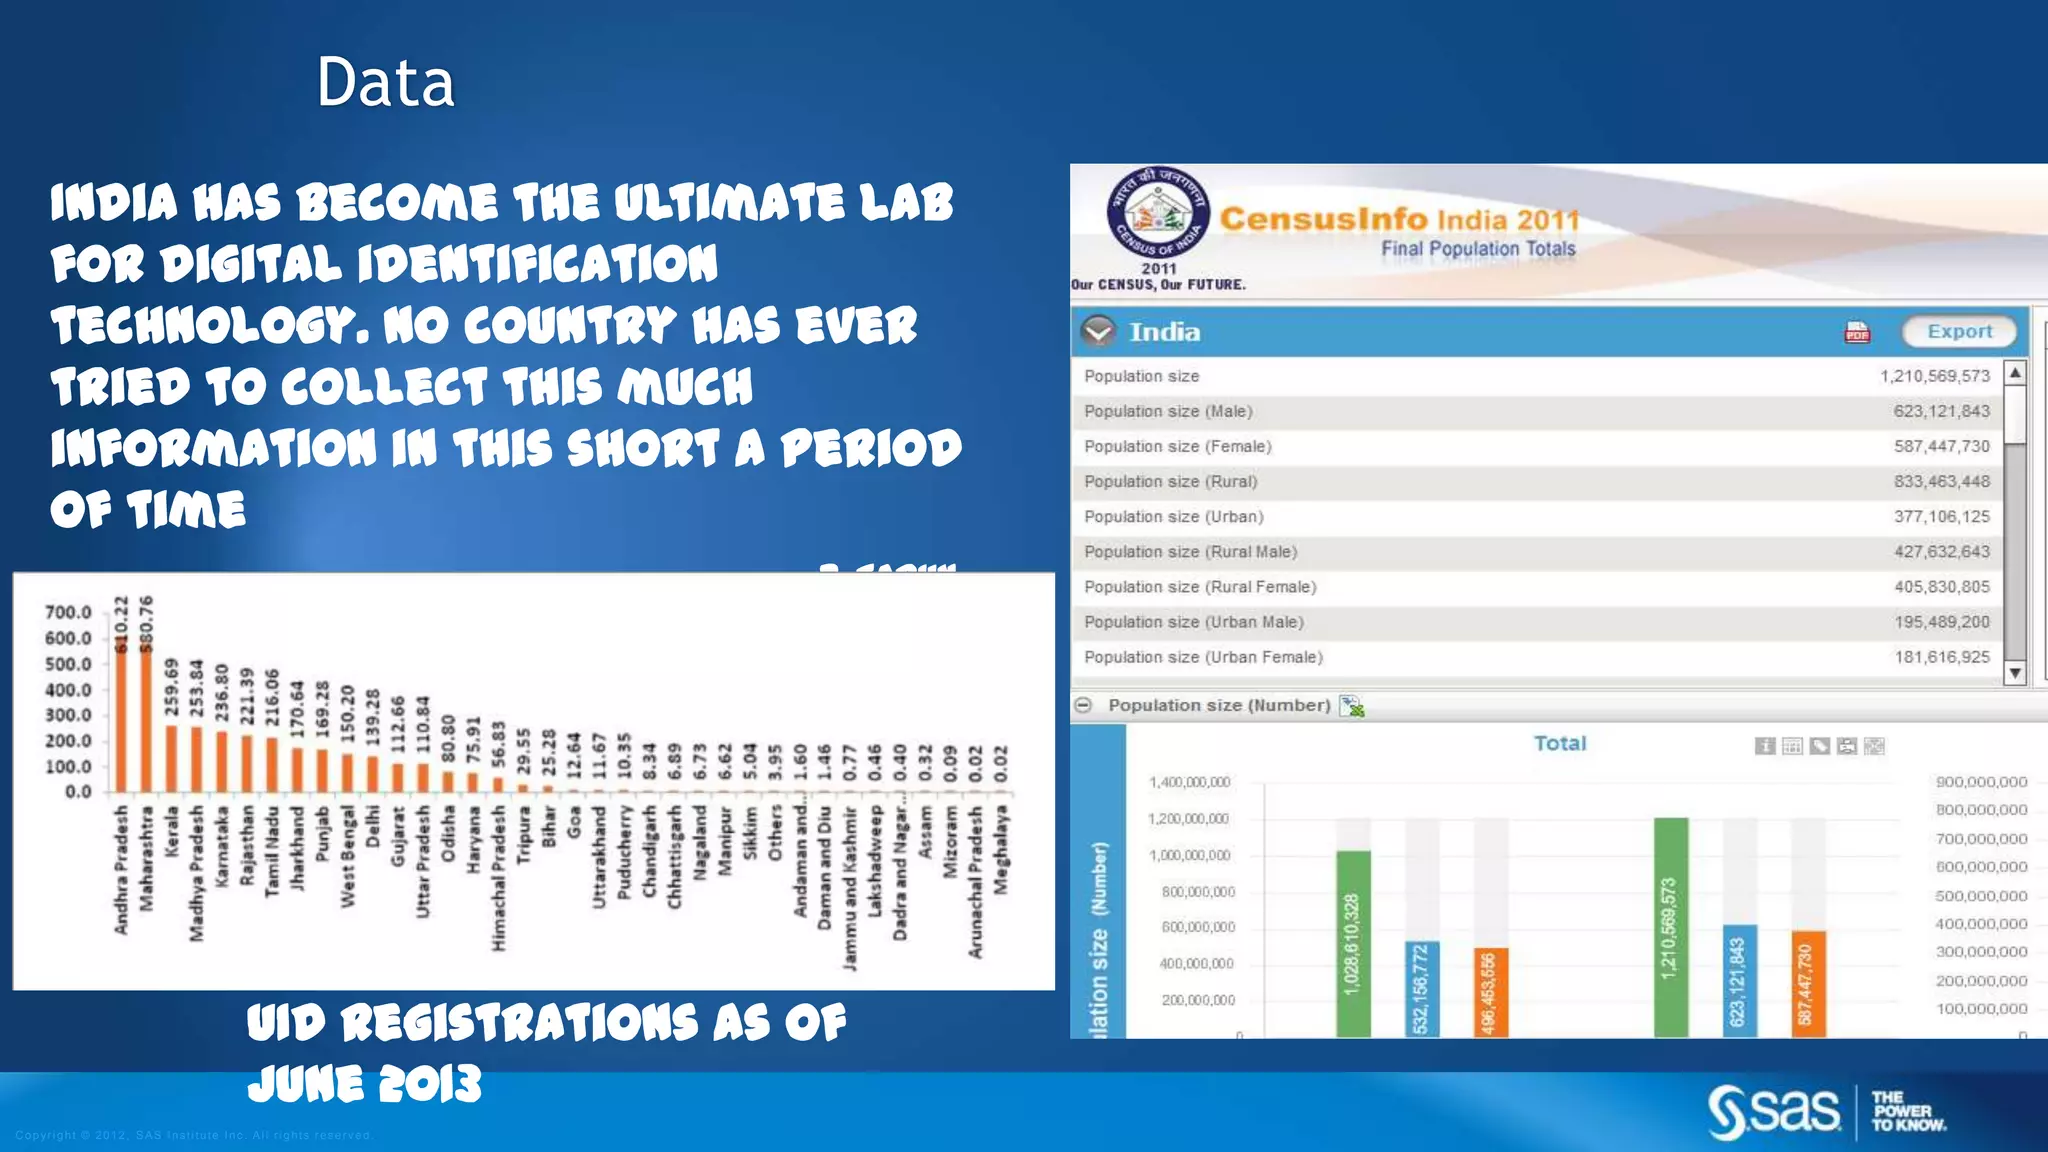
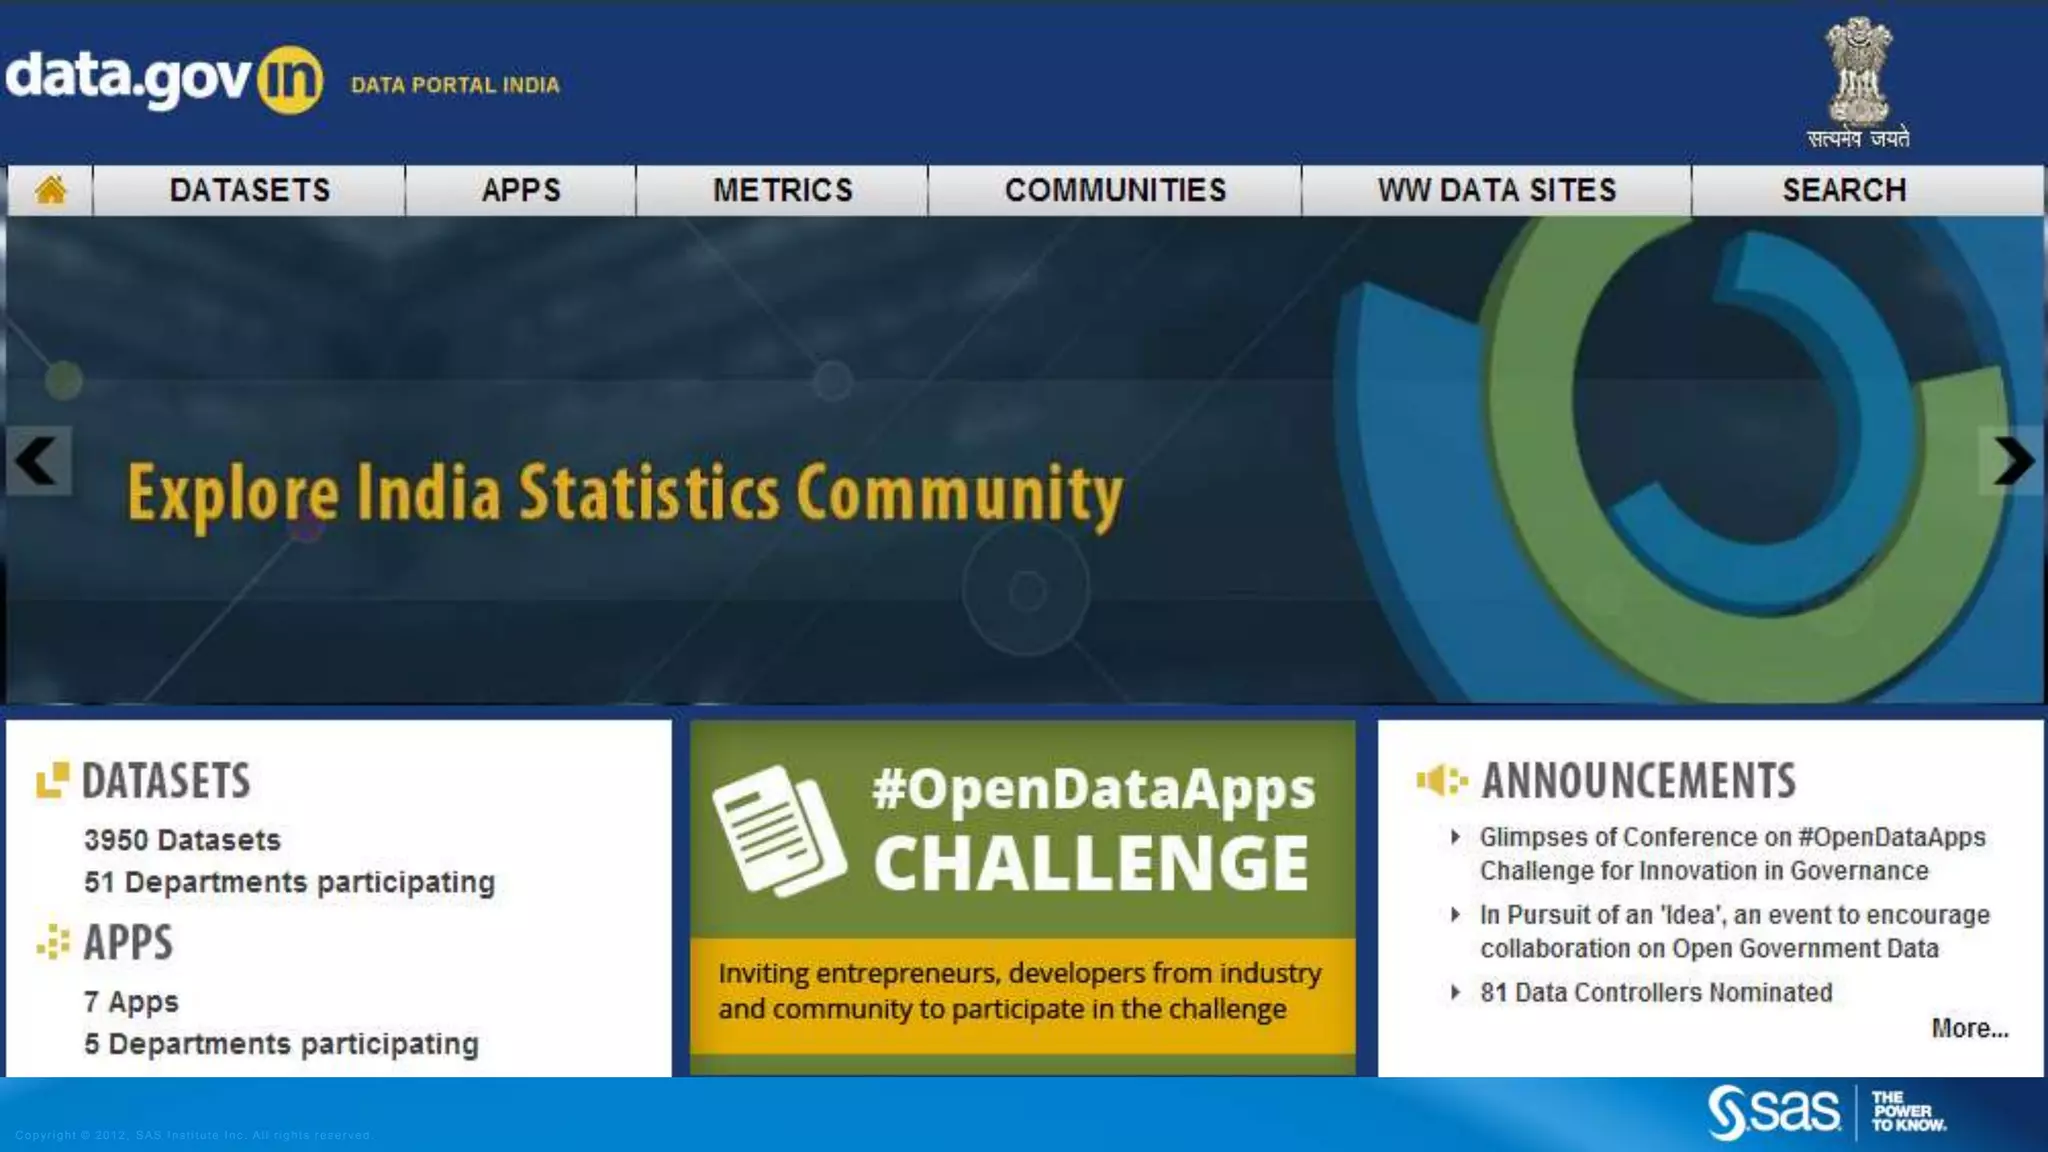

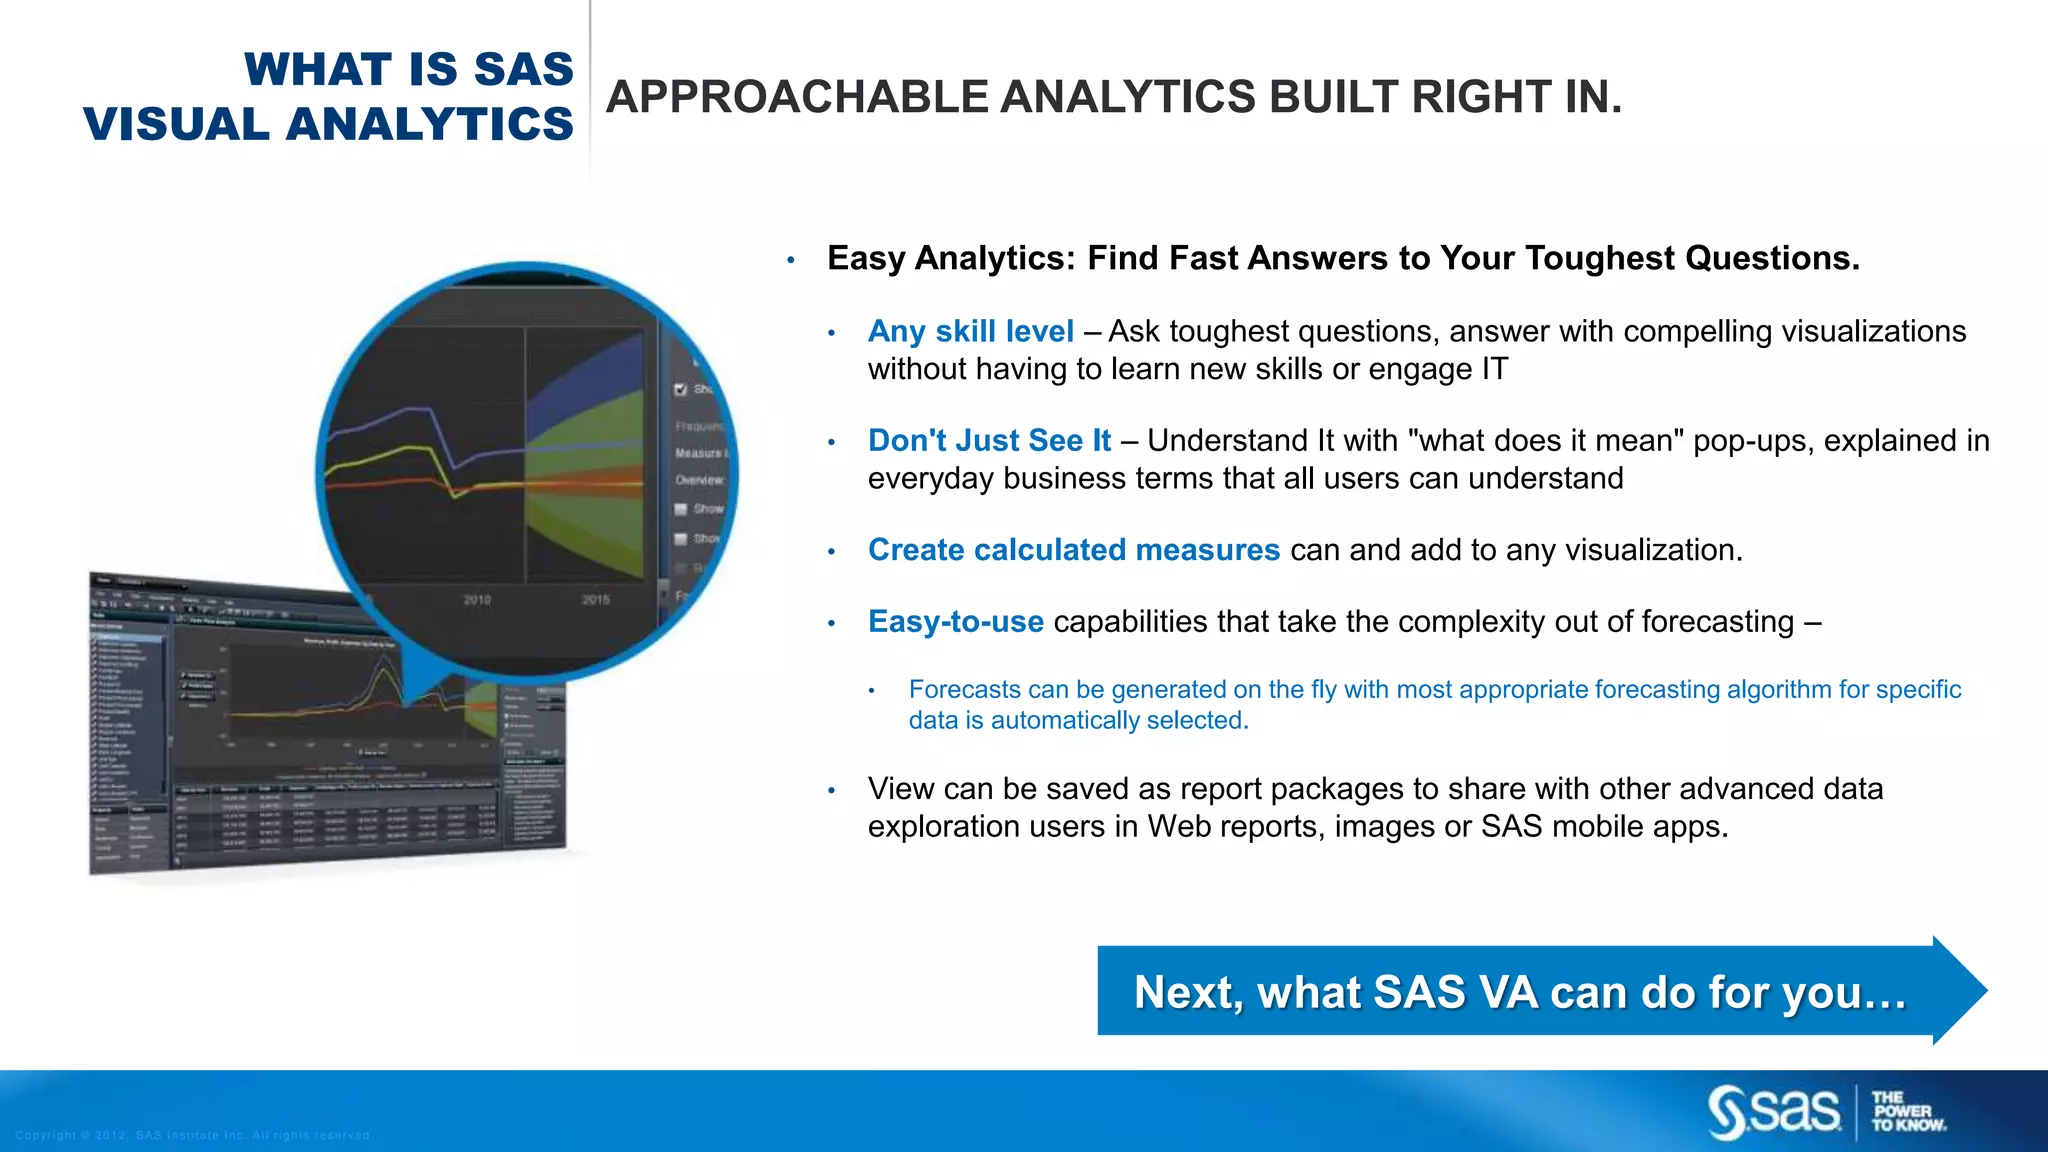
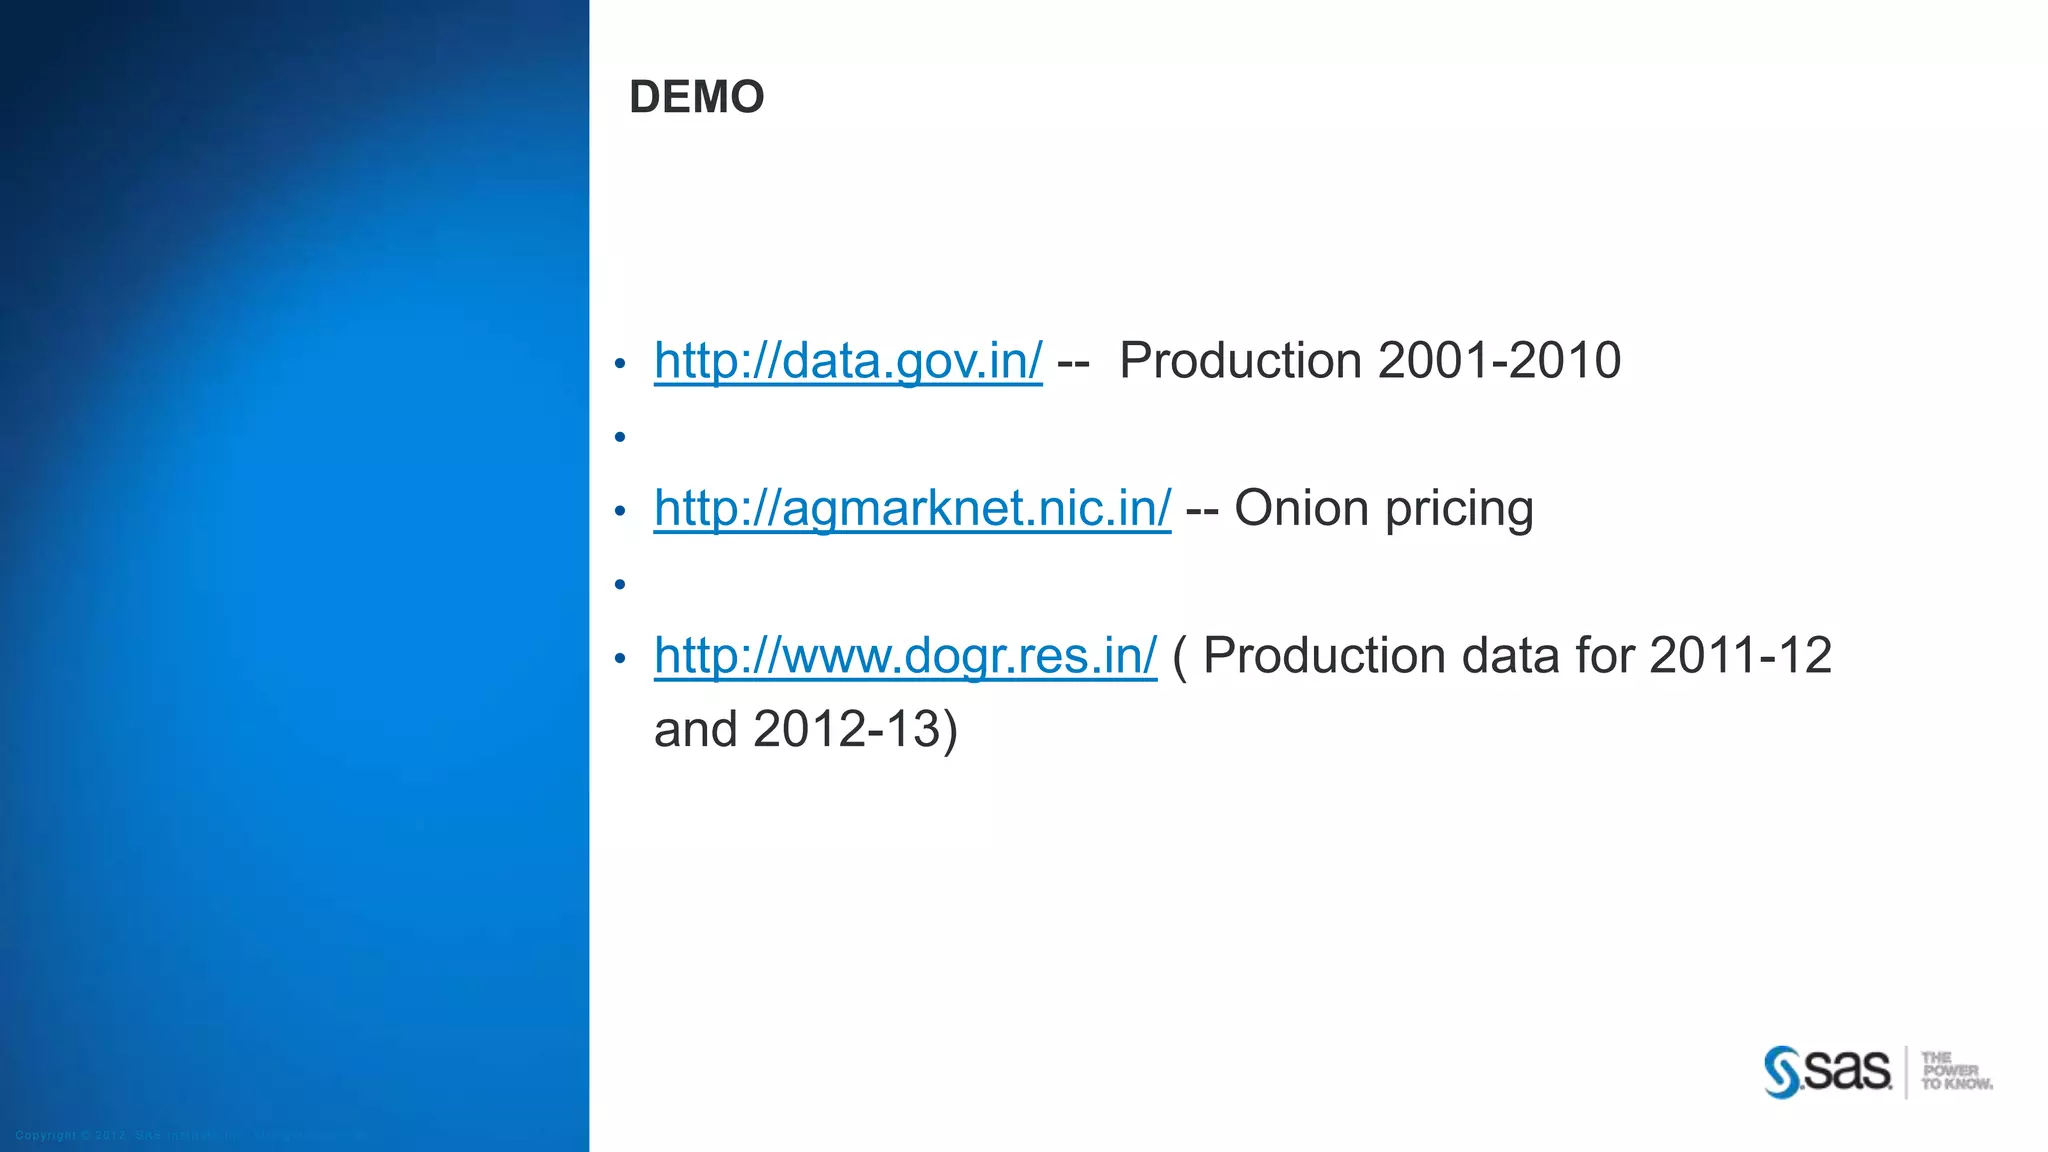

This document discusses high performance analytics and summarizes key capabilities of SAS Visual Analytics including easy analytics, visualizations for any skill level, calculated measures, automatic forecasting, and saved report packages. It also provides examples of public data sources that can be analyzed in SAS Visual Analytics including agricultural production and pricing data from India.