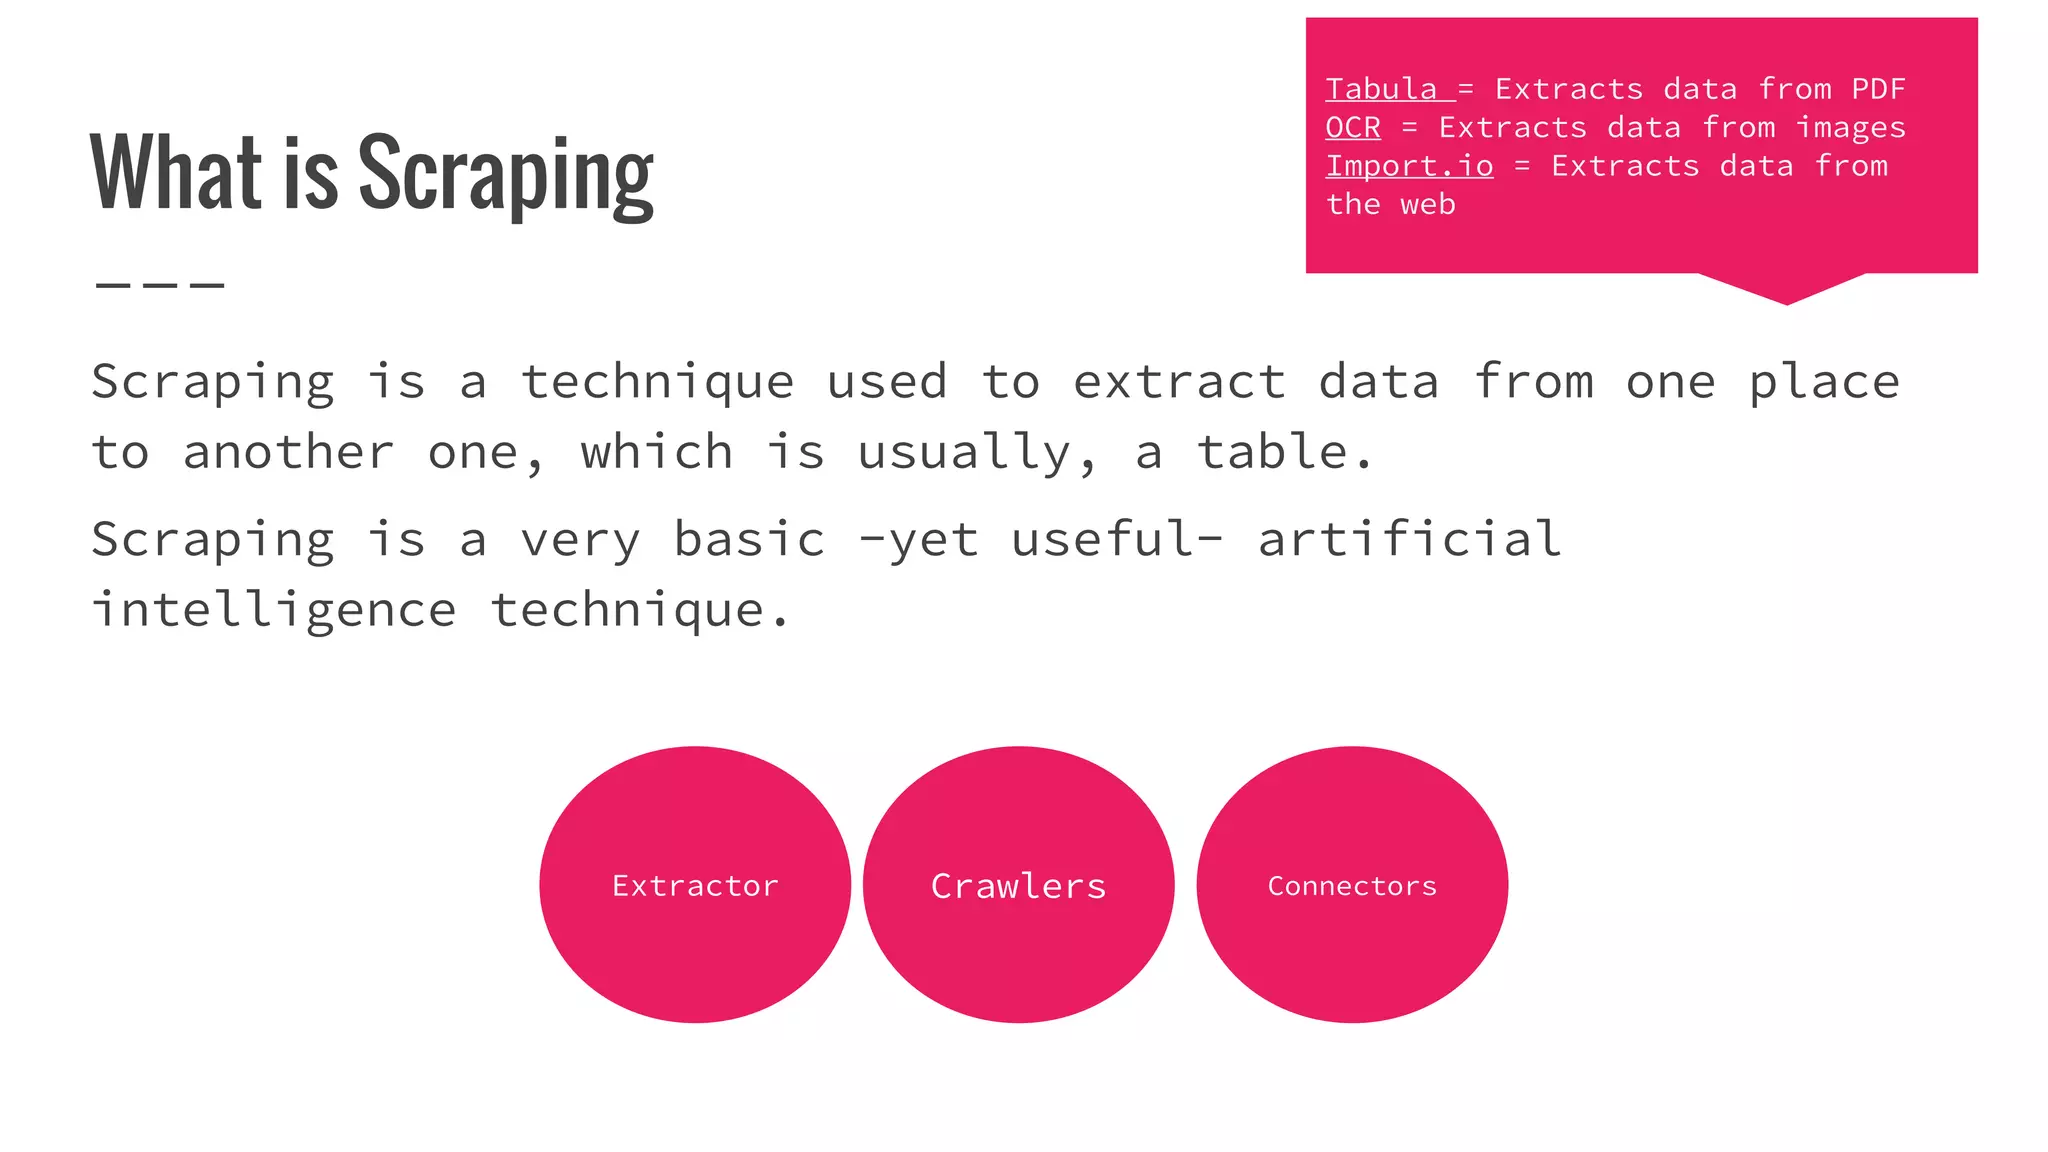
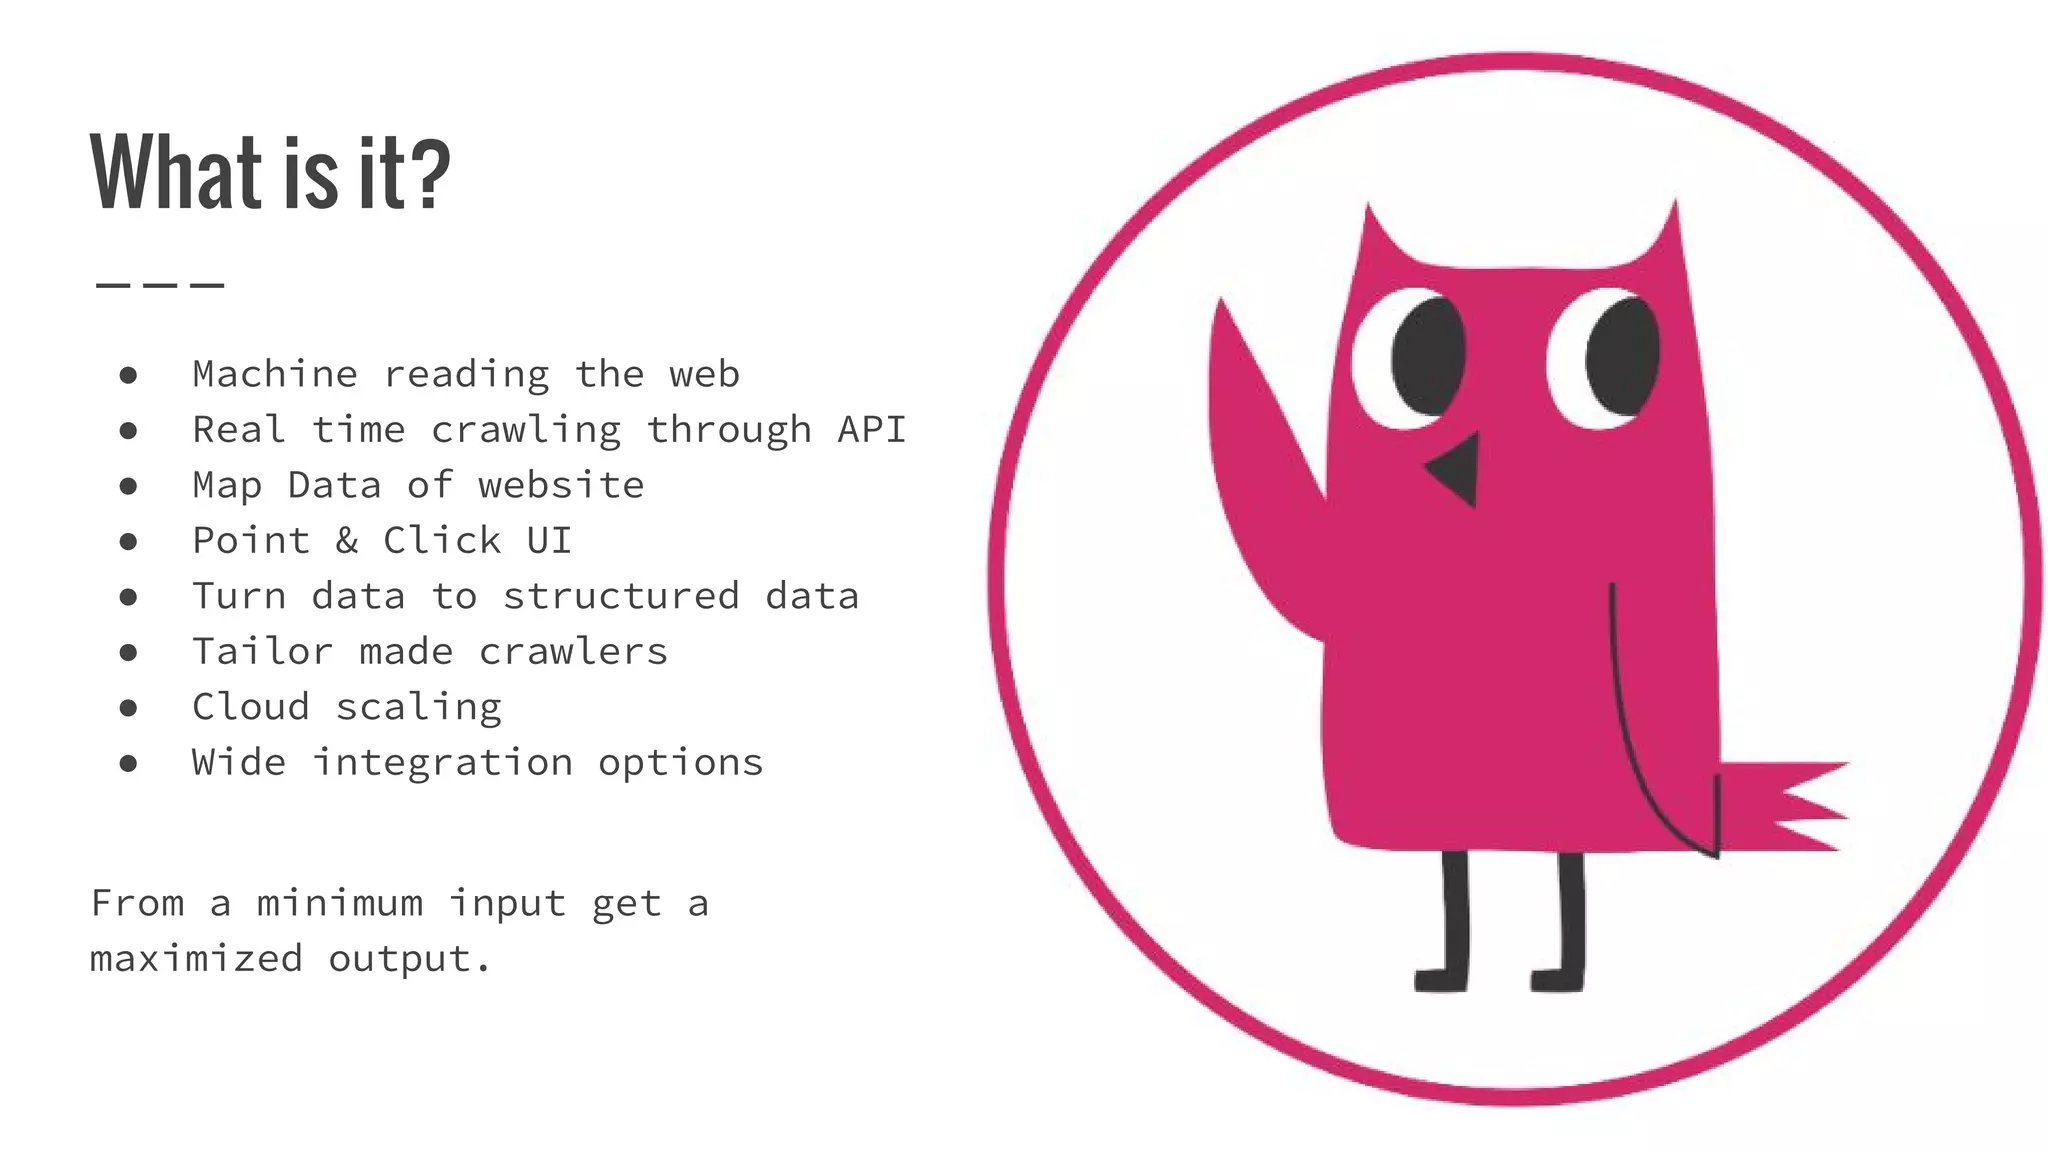
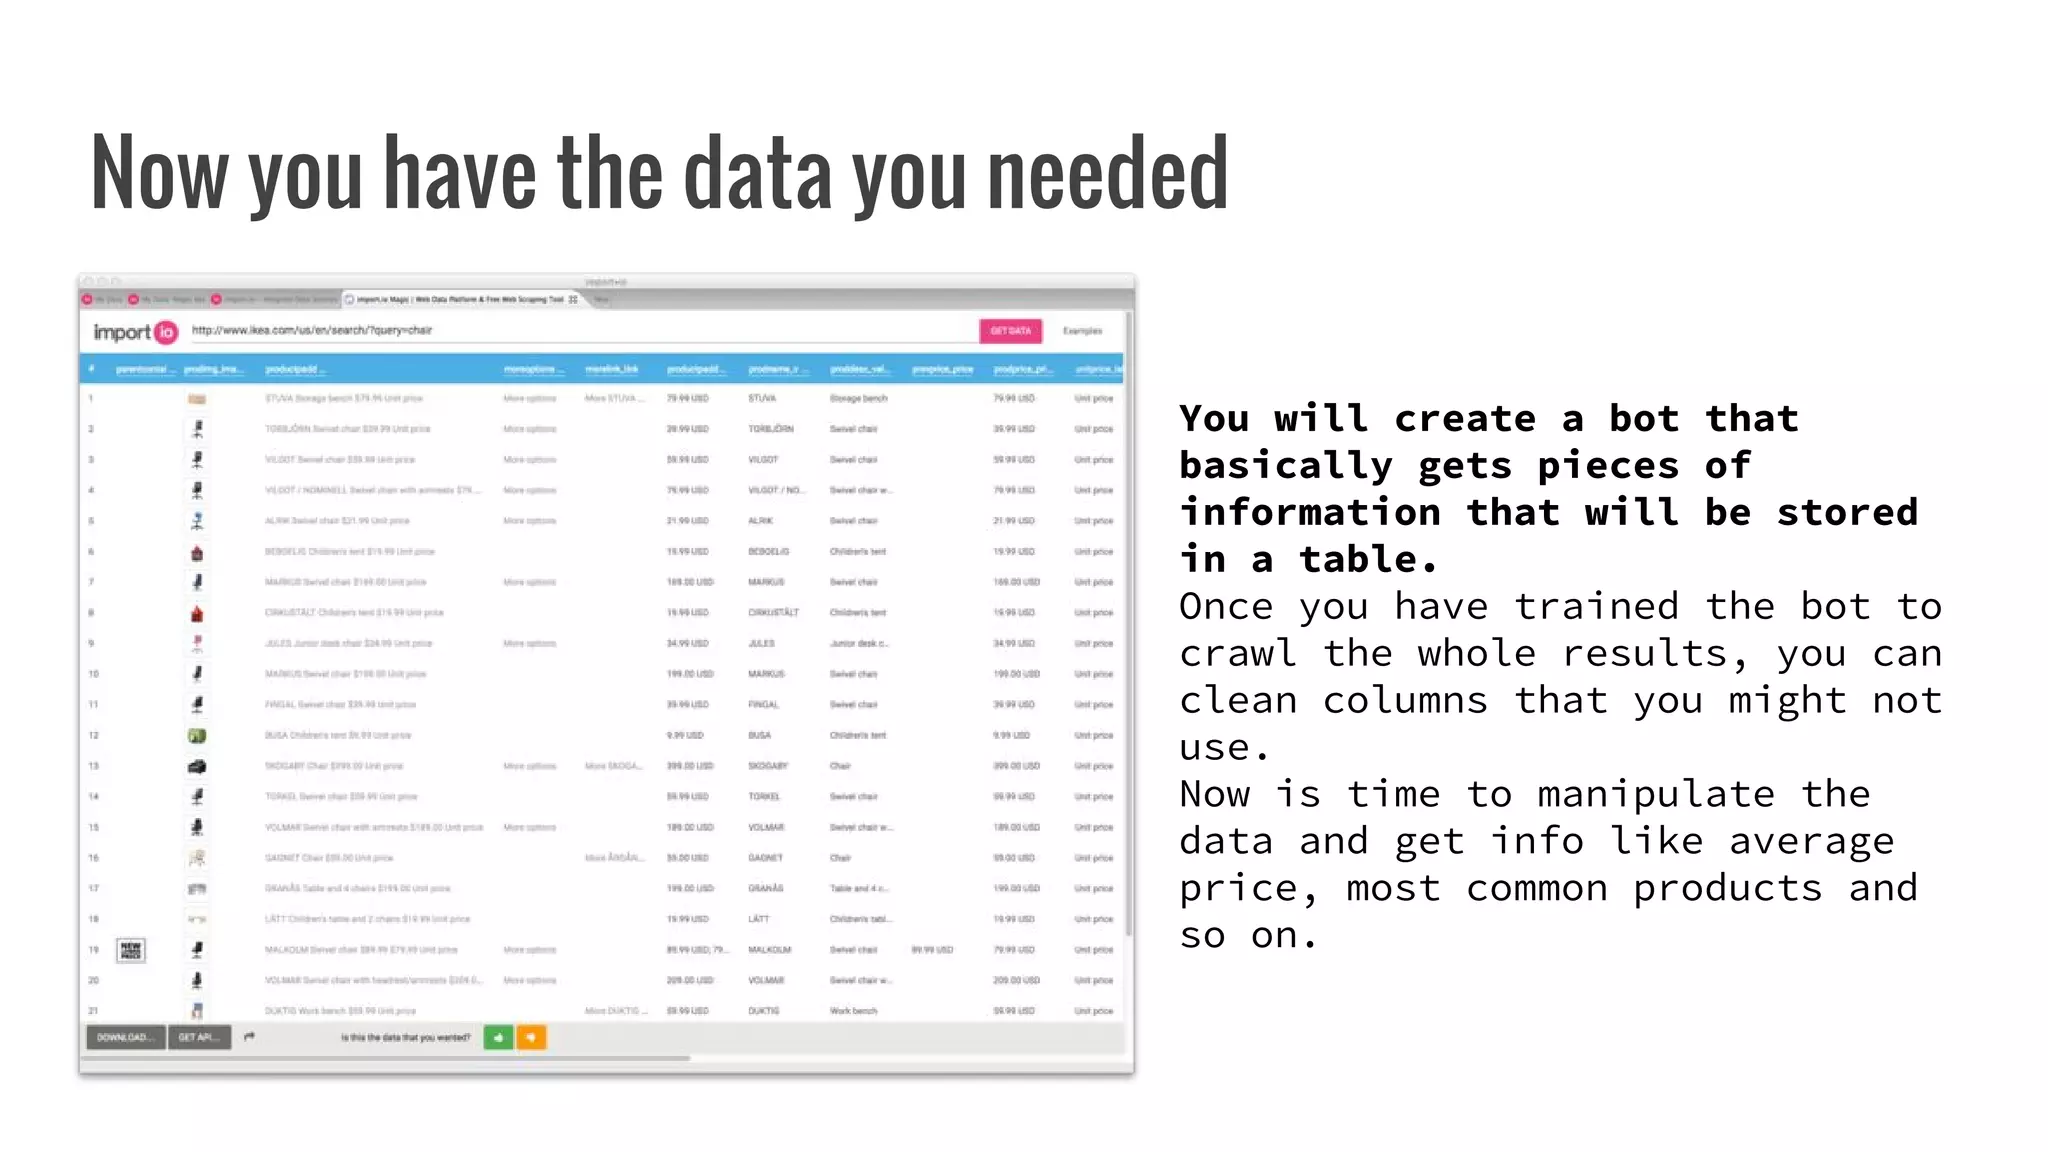
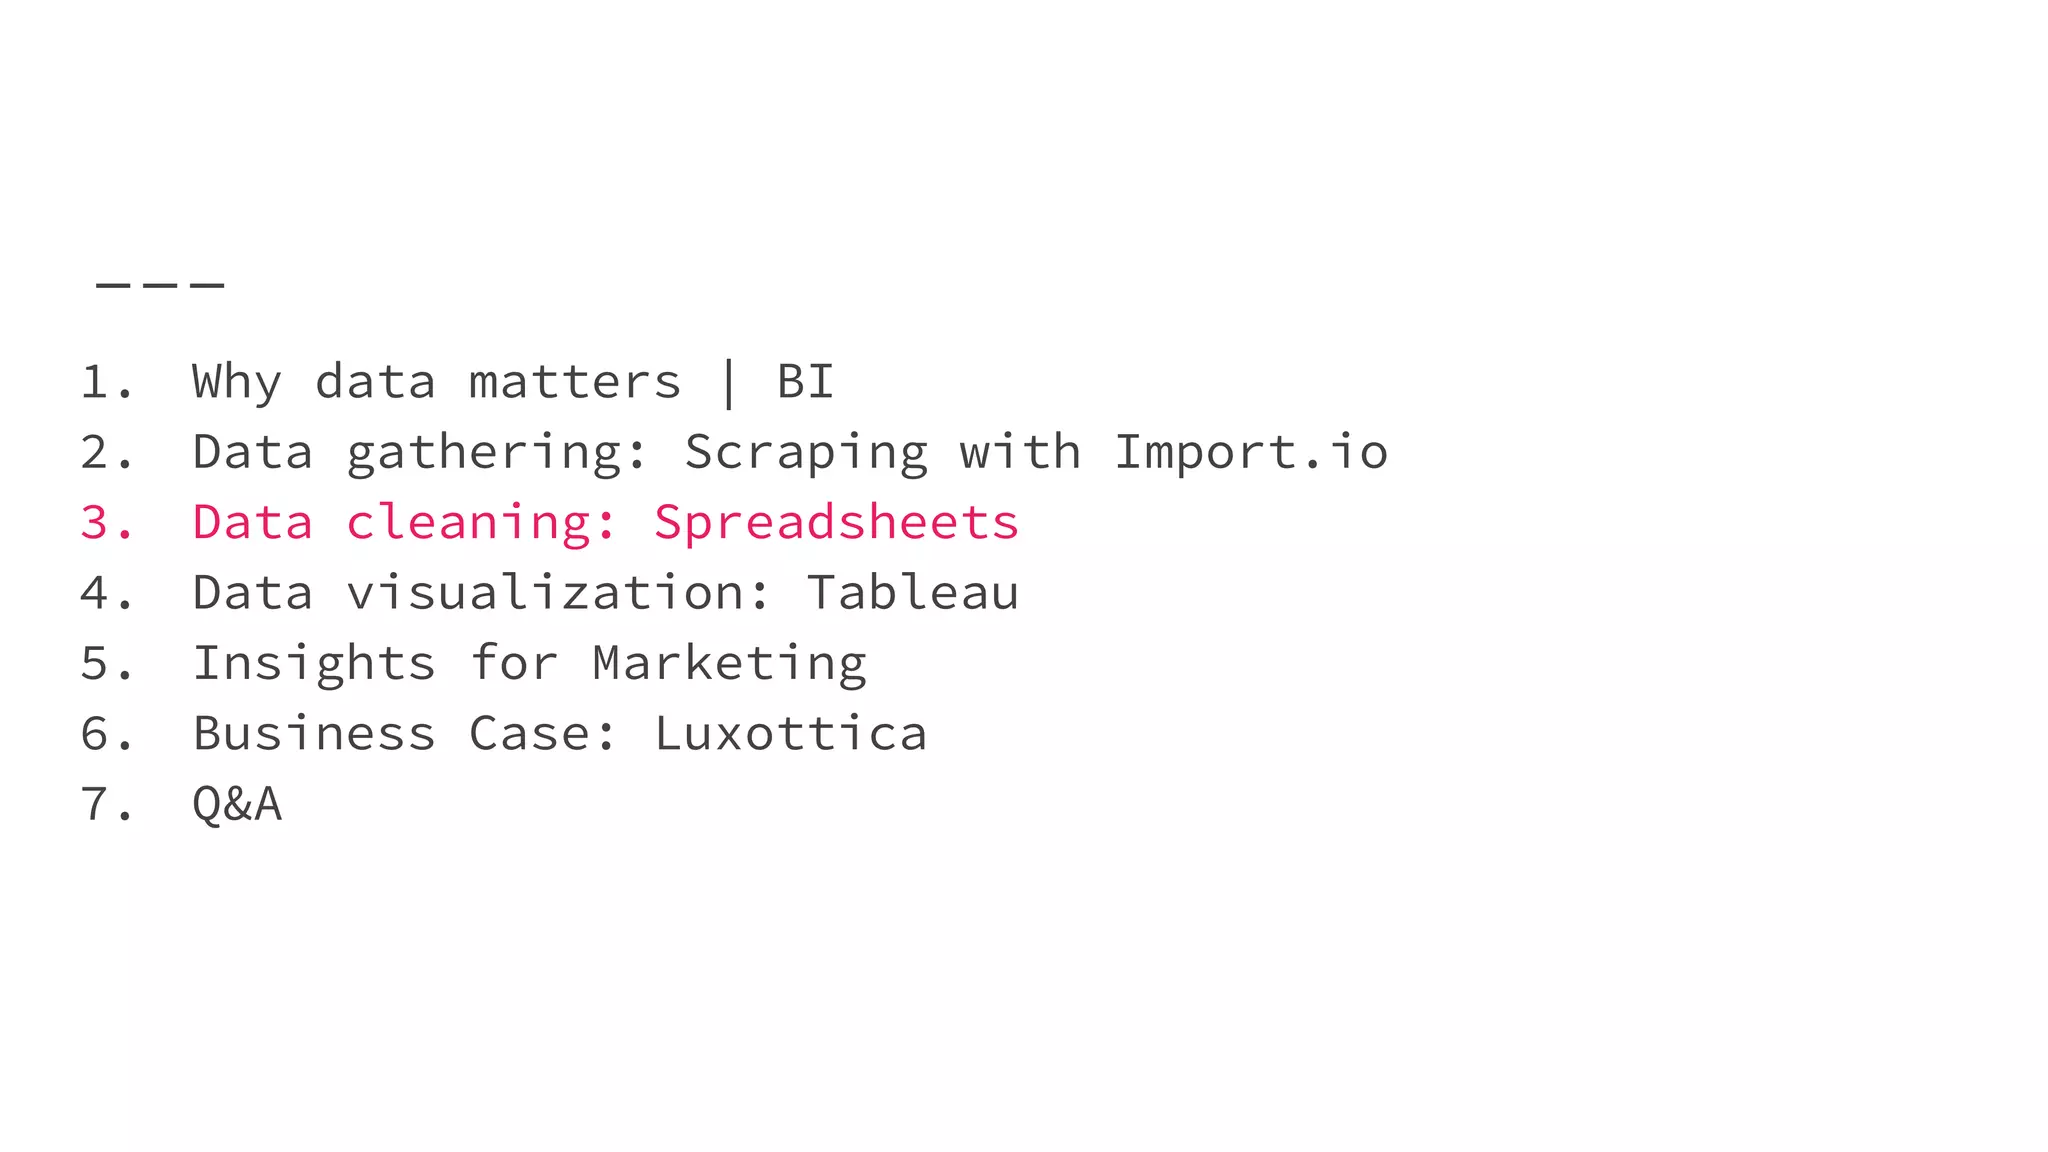
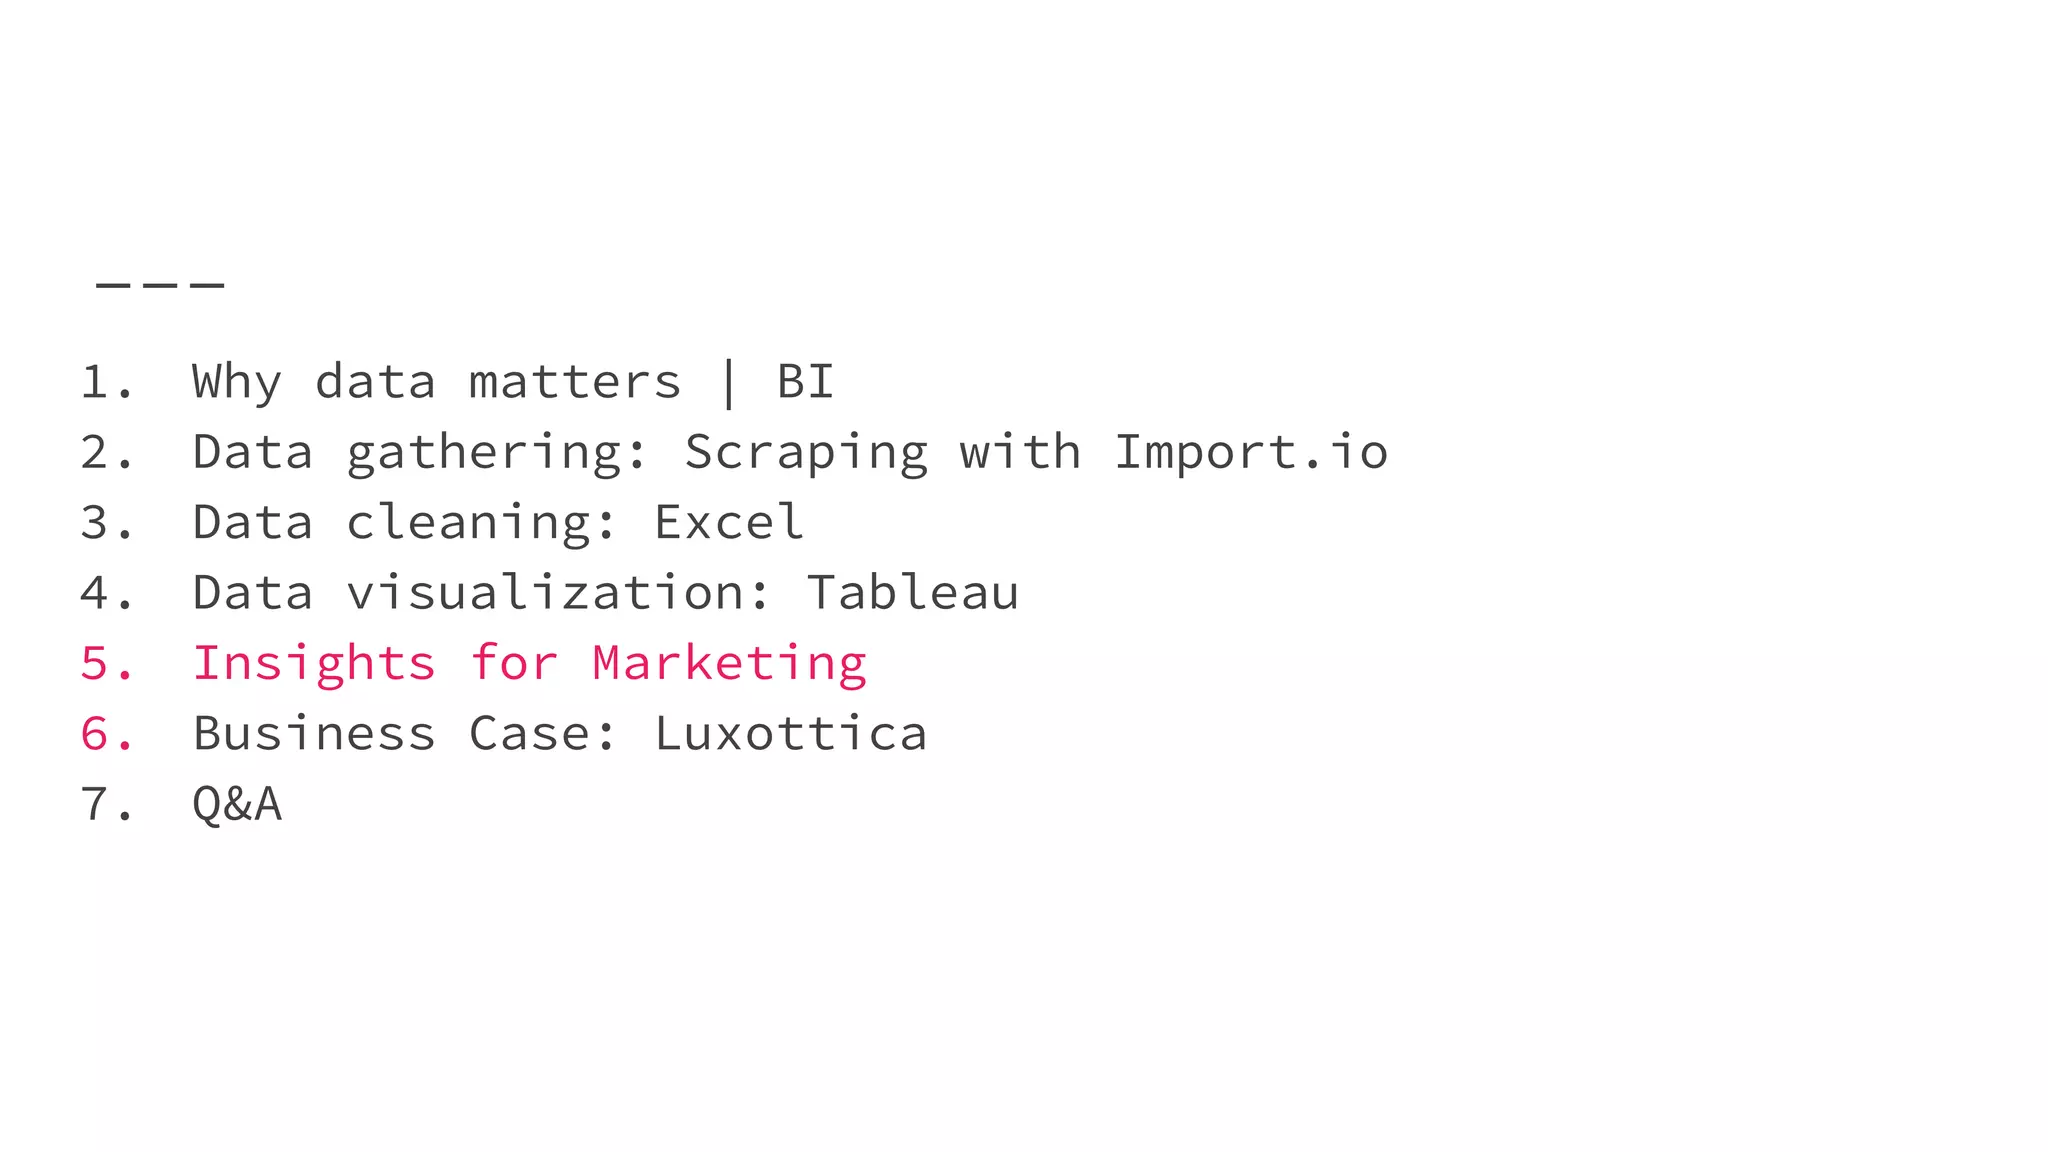
Brief deck for the 3 most important steps on data exploration.
- Web Scraping (Import.io)
- Data Cleaning (Spreadsheets)
- Data Visualization (Tableau)
Semana de las comunicaciones 2015
The Present - the History of Business IntelligencePhocas Software
Learn the history of business intelligence in this three part series. In part one, we discussed how business intelligence software used to be (the past). In part two, we discuss business intelligence as it is in the present.
IBM CDO Fall Summit 2016 Keynote: Driving innovation in the cognitive eraIBM Analytics
What does it take to drive Innovation in the Cognitive Era? Bob Picciano, Senior Vice President IBM Analytics and Inderpal Bhandari, Global Chief Data Officer, IBM gave this presentation to the CDOs and data professionals in attendance at the IBM Chief Data Officer Strategy Summit in Fall of 2016.
Learn more about the role of CDO: http://ibm.co/2cXasXy
BigData & Supply Chain: A "Small" IntroductionIvan Gruer
In the frame of the master in logistic LOG2020, a brief presentation about BigData and its impacts on Supply Chains at IUAV.
Topics and contents have been developed along the research for the MBA final dissertation at MIB School of Management.
Strata Data Conference 2019 : Scaling Visualization for Big Data in the CloudJaipaul Agonus
This deck deals with scaling visualizations for big data in the cloud.
Approaching this problem on two fronts, beginning on the engineering side of things, looking at different scaling strategies that can be used on cloud resources.
Then about strategies that we use for turning data into visualizations and the usage of proven visualization blueprints for market surveillance.
Beyond the Classroom consists of events, workshops and presentations meant to introduce Computer Science students to learning opportunities in addition to their regular classroom experiences. Beyond the Classroom events are free and open to all NHCC CSci students.
This presentation is about Big Data, how it changes the traditional data landscape, how different companies are using it, and which skills are in demand.
You probably have heard about Big Data, but ever wondered what it exactly is? And why should you care?
Mobile is playing a large part in driving this explosion in data. The data are also created by the apps and other services in the background. As people are moving towards more digital channels, tons of data are being created. This data can be used in a lot of ways for personal and professional use. Big Data and mobile apps are converging in an enterprise and interacting; transforming the whole mobile ecosystem.
BDAS-2017 | Lesson learned from the application of data science at BBVABig-Data-Summit
En esta sesión se expondrán las principales lecciones aprendidas en la aplicación de la ciencia de datos para la mejora de procesos internos y creación de nuevos productos en BBVA. En particular se incidirá en las principales barreras que pueden surgir para la creación de productos basados en datos, tanto en el aspecto técnico como organizativo, y se realizarán distintas propuestas para agilizar la llegada al mercado de estos productos.
Top 20 artificial intelligence companies to watch out in 2022Kavika Roy
Artificial intelligence is fast becoming an intrinsic part of every industry.
It’s estimated that the global AI market will grow at a rate of 40.2% CAGR (Compound Annual Growth Rate) from the year 2021 to 2028. While the top names spend on research, the smaller organizations rely on offshore AI companies to embrace artificial intelligence and machine learning technology and integrate them into their business processes.
Working with the right AI company can help streamline the business operations, optimize the resources, and increase returns by changing the way management and employees perform their day-to-day activities at work.
Here are the top 20 artificial intelligence companies to watch out for in 2022:-
https://www.datatobiz.com/blog/top-artificial-intelligence-companies/
The Past - the History of Business IntelligencePhocas Software
Learn the history of business intelligence in this three part series. In part one, we discuss how business intelligence software used to be (the past).
Graphs in Retail: Know Your Customers and Make Your Recommendations Engine LearnNeo4j
At Neo4j we believe that “Graphs Are Everywhere”. In this session, we’ll be exploring graphs within the Retail industry. We’ll discuss a range of data that are commonly available within a retail organisation, both online and “brick and mortar". We’ll illustrate some graphs which can be created by linking together different elements of that data and discuss the retail use cases those graphs can enable and transform.
We’ll specifically focus on use cases like Personalised Recommendations (with a live demo), Supply Chain Management, Logistics, and Customer 360. We'll also look at some relevant graph algorithms and talk about opportunities for integration with Artificial Intelligence/Machine Learning technologies, which can be used along with Neo4j to generate new value using retail data.
Walmart, Wobi, and others already deploy Neo4j for use cases like price comparison or real-time contextual and learning recommendation engines. Read about their use cases!
Smart Data Webinar: Transforming Industries with Artificial Intelligence (AI)...DATAVERSITY
The state of the art and practice for AI and Machine Learning (ML) has matured rapidly in the past few years, making it an ideal time to take a look at what works and what doesn’t.
In this webinar, we will present an overview of AI-infused applications in two industries:
Manufacturing
Retail
Participants will learn to look for characteristics of business processes and of data that make them well - or ill - suited to AI-augmentation or automation.
Abstract della presentazione di Fabio Rizzotto, IT Research & Consulting Director di IDC Italia, tenuta all’IDC Big Data Conference II, a Bologna il 19 novembre 2013
Building a Data Platform Strata SF 2019mark madsen
Building a data lake involves more than installing Hadoop or putting data into AWS. The goal in most organizations is to build multi-use data infrastructure that is not subject to past constraints. This tutorial covers design assumptions, design principles, and how to approach the architecture and planning for multi-use data infrastructure in IT.
[This is a new, changed version of the presentations of the same title from last year's Strata]
Looking at what is driving Big Data. Market projections to 2017 plus what is are customer and infrastructure priorities. What drove BD in 2013 and what were barriers. Introduction to Business Analytics, Types, Building Analytics approach and ten steps to build your analytics platform within your company plus key takeaways.
Dcaf transformation & kg adoption 2022 -alan morrisonAlan Morrison
A keynote presentation on knowledge graph adoption trends and how to do digital transformation differently.
Delivered at the Enterprise Data Transformation & Knowledge Graph Adoption
A Semantic Arts DCAF Event
February 28, 2022
The Rensselaer Institute for Data Exploration and Applications is addressing new modes of data exploration and integration to enhance the work of campus researchers (and beyond). This talk outlines the "data exploration" technologies being explored
Self Service Buisness Intelligence - Tech TalkBrandix i3
Microsoft MVP, Gogula Ariyalingam covers how self service BI could be used to mine insights from day to day life data sets. A very practical, step by step guide on mining insights with self service BI tools.
SAS Visual Analytics is a high-performance, in-memory solution for
exploring massive amounts of data very quickly. It enables you to spot
patterns, identify opportunities for further analysis and convey visual
results via Web reports or a mobile platform such as iPad® or Androidbased
tablets.This presentation is a very brief overview of the many features and
capabilities of SAS Visual Analytics. It is meant to get you started
quickly, with a relatively modest data set example (only 1.4 million
rows).Insight Toy Company is an organization that produces and sells toys to
resellers (“vendors”). The data is made up of 34 years of Sales information,
covering 128 cities across the world.
For each row of data (transaction) we have:
Information on the items sold (product brand, line, make, style, SKU)
The sale value (“order total”) and various related costs (distribution, marketing, product)
Information on the sales representative (rating, sales target, actual to date, etc.)
Geographic information (on the vendors as well as the selling facility)
Information on the vendors (rating, satisfaction, distance to nearest facility)
Text Notes taken at the moment of the order taking, based on conversation with the vendor.
Global Business Intelligence (BI) software vendor, Yellowfin, and Actian Corporation, pioneers of the record-breaking analytical database Vectorwise, will host a series of Big Data and BI Best Practices Webinars.
These are the slides from that presentation.
The Big Data & BI Best Practices Webinars and associated slides examine the phenomenal growth in business data and outline strategies for effectively, efficiently and quickly harnessing and exploring ‘Big Data’ for competitive advantage.
Data visualization is a complex set of processes which is like an umbrella that covers both information and scientific visualization simultaneously. We can’t ignore the benefits of data visualization for its accurate quantities, as it is easily comparable. It also lends valuable suggestion pertaining to the usage of its technique and tools. Scientifically its effectiveness lies in our brain's ability to maintain a proper balance between perception and cognition through visualization.
An overview of some methods and principles for big data visualization. The presentation quickly hits on the topic of dashboards and some cyber security uses. The topic of a big data lake is also briefly discussed in the context of a cyber security big data setup.
Data visualizations make huge amounts of data more accessible and understandable. Data visualization, or "data viz," is becoming largely important as the amount of data generated is increasing and big data tools are helping to create meaning behind all of that data.
This SlideShare presentation takes you through more details around data visualization and includes examples of some great data visualization pieces.
These slides are from recent talks by Andy Kirk of visualisingdata.com. The subject refers to the many different mindsets or roles that are required to be fulfilled for the effective design of data visualisation.
The 3 Key Barriers Keeping Companies from Deploying Data Products Dataiku
Getting from raw data to deploying data-driven solutions requires technology, data, and people. All of which exist. So why aren’t we seeing more truly data-driven companies: what's missing and why? During Strata Hadoop World Singapore 2015, Pauline Brown, Director of Marketing at Dataiku, explains how lack of collaboration is what is keeping companies from building and deploying data products effectively. Learn more about Dataiku and Data Science Studio: www.dataiku.com
Enabling a Bimodal IT Framework for Advanced Analytics with Data VirtualizationDenodo
Watch: https://bit.ly/2FLc5I2
Being able to maintain a well managed and curated Data Warehouse, along with keeping up with all of the demands of a very sophisticated consumer group can be a challenge. The new user wants access to data, they want to experiment, fail fast and if they do find usable insights/algorithms they want them productionized. This puts pressure on an IT organization and pushes them closer to a Bimodal operation where the regular IT processes that are highly curated, well defined and managed contrast sharply with the demands of the more sophisticated user.
In the recently published TDWI Best Practices Report ,“Data Management for Advanced Analytics”, Philip Russom, DM for Advanced Analytics some of these newer requirements for the more sophisticated user are discussed in some length. How can IT support traditional demands around traditional BI and Reporting, whilst enabling the business with more demand for data and Advanced Analytics in mind?
Attend and learn:
- How data virtualization enables this Bi-Modal approach to Data Management.
- How data virtualization enables compelling use cases for data management and advanced analytics
- How we can achieve this important balance with process and technology.
Why Everything You Know About bigdata Is A LieSunil Ranka
As a big data technologist, you can bet that you have heard it all: every crazy claim, myth, and outright lie about what big data is and what it isn't that you can imagine, and probably a few that you can't.If your company has a big data initiative or is considering one, you should be aware of these false statements and the reasons why they are wrong.
[DSC Europe 22] The Making of a Data Organization - Denys HolovatyiDataScienceConferenc1
Data teams often struggle to deliver value. KPIs, data pipelines, or ML driven predictions aren't inherently useful - unless the data team enables the business to use them. Having worked on 37 data projects over the past 5 years, with total client revenue clocking at about $350B, I started noticing simple success factors - and summarized those in the Operating Model Canvas & the Value Delivery Process. With those, I branched out into what I call data organization consulting and help clients build their data teams for success, the one you see not only on paper but also in your P&L. In this talk, I'll share some insight with you.
This report is an outcome of research on topic 'Business Intelligence', which is a hot topic now. This research report is prepared for the partial fulfillment of the requirements for 'Current Developments Module' of B.Sc.Computing degree.
It demonstrates details of the Business Intelligence in today's world and explains BI architecture. It also provides detailed analysis on its use in the current business environment.
http://www.actian.com/
Actian’s strategy is to enable companies to develop Action Apps. Action Apps are lightweight
consumer-style applications that automate business actions triggered by real-time changes in data.
Action Apps will unleash the next level of business innovation and competitive advantage currently locked in the endless streams of data flowing through organizations and the industry. Action Apps are easy to build, require no training and provide value far beyond traditional business intelligence applications. Action Apps will be developed, managed
and shared on the world’s first Cloud Action PlatformTM from Actian.
It is Time For Action Apps
Over the past decade, most innovation in software has been in the consumer market.
Think about the way you use technology in your personal life today. We all enjoy small, light-weight, big-value apps on the smartphones and tablets we love. These consumer
apps help us do practical things like pay bills, book flights and taxis, and do fun things
like connect and share with friends. It’s never been more effective and fun.
Compare this to the experiences we have at work, where we are forced to use monolithic, hard-to-use, and harder-to-manage enterprise software. Actian’s mission is to enable users, developers, and Enterprise IT organizations to embrace and build consumer style apps to unleash a new level of enterprise productivity.
Whether it’s monitoring a particular company’s stock prices, keeping tabs on your competition’s
sales data, or watching your prospects’ credit ratings rise and fall, every Action App
is customized to meet the information needs of your particular job or workflow.
Action Apps are designed to constantly scan and probe a wide variety of disparate data sources, from highly structured corporate CRM and ERP systems to software-as-a-service offerings like salesforce.com, and even unpredicted unstructured twitter feeds, LinkedIn updates and Facebook posts. When the Action Apps data probes uncover important
information, they fire triggers which signal the appropriate business user and either
communicate, or cause an action to be taken as a result.
How much time do you spend mashing up web analytics data vs. looking for data insights? Your Analytics Site automates the data extraction form multiple marketing channels, including WebTrends, Google Analytics, Twitter, YouTube, Slideshare and Flickr with more be added. Each dashboard is customized to satisfy each clients specific business needs. What you get, one cohesive, actionable and visually interactive reporting mechanism for your all your analytics.
2015 is knocking on the door and will be an exciting and surprising year for the BI industry. However, not everything will be a surprise for Panorama as we are always on top of the latest trends influencing the Business Intelligence community.
• What will the future hold for the industry?
• What are our BI experts thoughts, predictions and internal assessments on what new directions the Business Intelligence community will see in the coming year?
• Countdown of the most important trends in the industry
A New Analytics Paradigm in the Age of Big Data: How Behavioral Analytics Will Help You Understand Your Customers and Grow Your Business Regardless of Data Sizes
How to be a Successful Data PM by Zillow Product LeadersProduct School
Main Takeaways:
-Data Product Managers treat data as a product
-Data & AI Fluency is an important core skills
-Be a great storyteller
-Understand Data Product Lifecycle
-Data Product Success Metrics
Accelerate Self-Service Analytics with Data Virtualization and VisualizationDenodo
Watch full webinar here: https://bit.ly/3fpitC3
Enterprise organizations are shifting to self-service analytics as business users need real-time access to holistic and consistent views of data regardless of its location, source or type for arriving at critical decisions.
Data Virtualization and Data Visualization work together through a universal semantic layer. Learn how they enable self-service data discovery and improve performance of your reports and dashboards.
In this session, you will learn:
- Challenges faced by business users
- How data virtualization enables self-service analytics
- Use case and lessons from customer success
- Overview of the highlight features in Tableau
We worked for 6 months with Luxottica improving the logistics and operation for the distribution center in Europe.
Among all the MBA class 2014, we were the best OCU project, awarded by MIP Politecnico di Milano and The Luxottica Group
Somos 7 billones en la tierra.
¿Cómo enfrentaremos el desafío que encierran nuevos puestos de trabajo, abrigo, educación y recursos limitados?
Las ideas y creatividad tienen la respuesta.
06-04-2024 - NYC Tech Week - Discussion on Vector Databases, Unstructured Data and AI
Round table discussion of vector databases, unstructured data, ai, big data, real-time, robots and Milvus.
A lively discussion with NJ Gen AI Meetup Lead, Prasad and Procure.FYI's Co-Found
Learn SQL from basic queries to Advance queriesmanishkhaire30
Dive into the world of data analysis with our comprehensive guide on mastering SQL! This presentation offers a practical approach to learning SQL, focusing on real-world applications and hands-on practice. Whether you're a beginner or looking to sharpen your skills, this guide provides the tools you need to extract, analyze, and interpret data effectively.
Key Highlights:
Foundations of SQL: Understand the basics of SQL, including data retrieval, filtering, and aggregation.
Advanced Queries: Learn to craft complex queries to uncover deep insights from your data.
Data Trends and Patterns: Discover how to identify and interpret trends and patterns in your datasets.
Practical Examples: Follow step-by-step examples to apply SQL techniques in real-world scenarios.
Actionable Insights: Gain the skills to derive actionable insights that drive informed decision-making.
Join us on this journey to enhance your data analysis capabilities and unlock the full potential of SQL. Perfect for data enthusiasts, analysts, and anyone eager to harness the power of data!
#DataAnalysis #SQL #LearningSQL #DataInsights #DataScience #Analytics
Chatty Kathy - UNC Bootcamp Final Project Presentation - Final Version - 5.23...John Andrews
SlideShare Description for "Chatty Kathy - UNC Bootcamp Final Project Presentation"
Title: Chatty Kathy: Enhancing Physical Activity Among Older Adults
Description:
Discover how Chatty Kathy, an innovative project developed at the UNC Bootcamp, aims to tackle the challenge of low physical activity among older adults. Our AI-driven solution uses peer interaction to boost and sustain exercise levels, significantly improving health outcomes. This presentation covers our problem statement, the rationale behind Chatty Kathy, synthetic data and persona creation, model performance metrics, a visual demonstration of the project, and potential future developments. Join us for an insightful Q&A session to explore the potential of this groundbreaking project.
Project Team: Jay Requarth, Jana Avery, John Andrews, Dr. Dick Davis II, Nee Buntoum, Nam Yeongjin & Mat Nicholas
Techniques to optimize the pagerank algorithm usually fall in two categories. One is to try reducing the work per iteration, and the other is to try reducing the number of iterations. These goals are often at odds with one another. Skipping computation on vertices which have already converged has the potential to save iteration time. Skipping in-identical vertices, with the same in-links, helps reduce duplicate computations and thus could help reduce iteration time. Road networks often have chains which can be short-circuited before pagerank computation to improve performance. Final ranks of chain nodes can be easily calculated. This could reduce both the iteration time, and the number of iterations. If a graph has no dangling nodes, pagerank of each strongly connected component can be computed in topological order. This could help reduce the iteration time, no. of iterations, and also enable multi-iteration concurrency in pagerank computation. The combination of all of the above methods is the STICD algorithm. [sticd] For dynamic graphs, unchanged components whose ranks are unaffected can be skipped altogether.
Global Situational Awareness of A.I. and where its headedvikram sood
You can see the future first in San Francisco.
Over the past year, the talk of the town has shifted from $10 billion compute clusters to $100 billion clusters to trillion-dollar clusters. Every six months another zero is added to the boardroom plans. Behind the scenes, there’s a fierce scramble to secure every power contract still available for the rest of the decade, every voltage transformer that can possibly be procured. American big business is gearing up to pour trillions of dollars into a long-unseen mobilization of American industrial might. By the end of the decade, American electricity production will have grown tens of percent; from the shale fields of Pennsylvania to the solar farms of Nevada, hundreds of millions of GPUs will hum.
The AGI race has begun. We are building machines that can think and reason. By 2025/26, these machines will outpace college graduates. By the end of the decade, they will be smarter than you or I; we will have superintelligence, in the true sense of the word. Along the way, national security forces not seen in half a century will be un-leashed, and before long, The Project will be on. If we’re lucky, we’ll be in an all-out race with the CCP; if we’re unlucky, an all-out war.
Everyone is now talking about AI, but few have the faintest glimmer of what is about to hit them. Nvidia analysts still think 2024 might be close to the peak. Mainstream pundits are stuck on the wilful blindness of “it’s just predicting the next word”. They see only hype and business-as-usual; at most they entertain another internet-scale technological change.
Before long, the world will wake up. But right now, there are perhaps a few hundred people, most of them in San Francisco and the AI labs, that have situational awareness. Through whatever peculiar forces of fate, I have found myself amongst them. A few years ago, these people were derided as crazy—but they trusted the trendlines, which allowed them to correctly predict the AI advances of the past few years. Whether these people are also right about the next few years remains to be seen. But these are very smart people—the smartest people I have ever met—and they are the ones building this technology. Perhaps they will be an odd footnote in history, or perhaps they will go down in history like Szilard and Oppenheimer and Teller. If they are seeing the future even close to correctly, we are in for a wild ride.
Let me tell you what we see.
Adjusting OpenMP PageRank : SHORT REPORT / NOTESSubhajit Sahu
For massive graphs that fit in RAM, but not in GPU memory, it is possible to take
advantage of a shared memory system with multiple CPUs, each with multiple cores, to
accelerate pagerank computation. If the NUMA architecture of the system is properly taken
into account with good vertex partitioning, the speedup can be significant. To take steps in
this direction, experiments are conducted to implement pagerank in OpenMP using two
different approaches, uniform and hybrid. The uniform approach runs all primitives required
for pagerank in OpenMP mode (with multiple threads). On the other hand, the hybrid
approach runs certain primitives in sequential mode (i.e., sumAt, multiply).
Adjusting primitives for graph : SHORT REPORT / NOTESSubhajit Sahu
Graph algorithms, like PageRank Compressed Sparse Row (CSR) is an adjacency-list based graph representation that is
Multiply with different modes (map)
1. Performance of sequential execution based vs OpenMP based vector multiply.
2. Comparing various launch configs for CUDA based vector multiply.
Sum with different storage types (reduce)
1. Performance of vector element sum using float vs bfloat16 as the storage type.
Sum with different modes (reduce)
1. Performance of sequential execution based vs OpenMP based vector element sum.
2. Performance of memcpy vs in-place based CUDA based vector element sum.
3. Comparing various launch configs for CUDA based vector element sum (memcpy).
4. Comparing various launch configs for CUDA based vector element sum (in-place).
Sum with in-place strategies of CUDA mode (reduce)
1. Comparing various launch configs for CUDA based vector element sum (in-place).
Enhanced Enterprise Intelligence with your personal AI Data Copilot.pdfGetInData
Recently we have observed the rise of open-source Large Language Models (LLMs) that are community-driven or developed by the AI market leaders, such as Meta (Llama3), Databricks (DBRX) and Snowflake (Arctic). On the other hand, there is a growth in interest in specialized, carefully fine-tuned yet relatively small models that can efficiently assist programmers in day-to-day tasks. Finally, Retrieval-Augmented Generation (RAG) architectures have gained a lot of traction as the preferred approach for LLMs context and prompt augmentation for building conversational SQL data copilots, code copilots and chatbots.
In this presentation, we will show how we built upon these three concepts a robust Data Copilot that can help to democratize access to company data assets and boost performance of everyone working with data platforms.
Why do we need yet another (open-source ) Copilot?
How can we build one?
Architecture and evaluation
3. Agenda
1. Why data matters | BI
2. Data gathering: Scraping with Import.io
3. Data cleaning: Spreadsheets
4. Data visualization: Tableau
5. Insights for Marketing
6. Business Case: Luxottica
7. Q&A
4. 1. Why data matters | BI
2. Data gathering: Scraping with Import.io
3. Data cleaning: Spreadsheets
4. Data visualization: Tableau
5. Insights for Marketing
6. Business Case: Luxottica
7. Q&A
5. Why Data matters | BI
Today we have several sources generating tons of data per
second. Businesses need to anticipate the consumer in order
to remain competitive.
SQL = Sequence or structured
NOSQL = Unstructured data.
The goal of BI is to make the right information available to
the right people in the right time.
Big Data is nothing else but gathering tons of structured
and unstructured data, filtering it, cleaning it,
visualizing it and last but not least, getting insights from
it.
6.
7. How and where do I start?
By Exploring the Data I don’t actually know where this will
take me. I just collect data from several sources and start
to explore it
The 2 most common scenarios to
start working with dat
By Answering a Question I know I have one question to ask.
This will lead my research and let me get rid of data that
is useless for this stage.
8. The Steps
1. Web Scraping (gather data)
2. Clean
3. Visualize and Analyze
9. 1. Why data matters | BI
2. Data gathering: Scraping with Import.io
3. Data cleaning: Spreadsheets
4. Data visualization: Tableau
5. Insights for Marketing
6. Business Case: Luxottica
7. Q&A
11. What is Scraping
Scraping is a technique used to extract data from one place
to another one, which is usually, a table.
Tabula = Extracts data from PDF
OCR = Extracts data from images
Import.io = Extracts data from
the web
Extractor Crawlers Connectors
Scraping is a very basic -yet useful- artificial
intelligence technique.
12. What is it?
● Machine reading the web
● Real time crawling through API
● Map Data of website
● Point & Click UI
● Turn data to structured data
● Tailor made crawlers
● Cloud scaling
● Wide integration options
From a minimum input get a
maximized output.
13. How does it work
Answer Question: What is the average € of
a Nike sneaker on eBay Italy?
1. Open Import.io
2. Create a new Connector
3. Go to ebay.it
4. Click “I’m there” button
5. Click the red button which will
record our click trail (now Import.
io will start recording your clicks)
6. Click stop button
7. Now you tell import.io what matters
to you and what is it (image, text,
link etc).
Pieces of information
14. Now you have the data you needed
You will create a bot that
basically gets pieces of
information that will be stored
in a table.
Once you have trained the bot to
crawl the whole results, you can
clean columns that you might not
use.
Now is time to manipulate the
data and get info like average
price, most common products and
so on.
15. 1. Why data matters | BI
2. Data gathering: Scraping with Import.io
3. Data cleaning: Spreadsheets
4. Data visualization: Tableau
5. Insights for Marketing
6. Business Case: Luxottica
7. Q&A
17. Store and clean
Once you have gathered the data, you might want to hide or
erase columns. Fill the n/a spaces or do some pivot table
maneuver. Whatever the case, Spreadsheet is a great way to
go.
Pivot Table: summarize big info
HLookup and Vlookup: target
specific info store in columns
and rows.
18. 1. Why data matters | BI
2. Data gathering: Scraping with Import.io
3. Data cleaning: Spreadsheets
4. Data visualization: Tableau
5. Insights for Marketing
6. Business Case: Luxottica
7. Q&A
20. What is it for?
Tableau is the ultimate desktop and cloud solution for
visualizing data coming from several sources.
Remember: privacy is an illusion
It works perfectly merging info from several sources:
Survey data, Social media, SEM and Analytics visualized in
one dashboard.
Perfect for reporting and meeting the needs of several
clients.
21. Why is it useful?
1. Tailor made dashboards
2. Several layers (and sources) of
information
3. Set clear goals and KPI’s
4. Easy to export
5. Works for several industries
and roles
23. 1. Why data matters | BI
2. Data gathering: Scraping with Import.io
3. Data cleaning: Excel
4. Data visualization: Tableau
5. Insights for Marketing
6. Business Case: Luxottica
7. Q&A
24. How we can harness the power of the web
When we start working with data we stop “believing” and
start thinking. All the data available can help us to create
consumer profiles, specific interests, potential issues with
our product or even new ways to connect with them.
1. Forecast (where the puck is going)
2. The Rise of the Robots (automation)
3. Cross selling and tailor made dashboards per client
4. Insights like you’ve never seen before