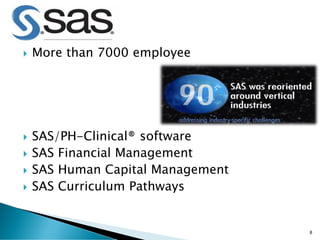
Statistical Analysis System
ASLI YAZAGAN
IS533 HW3
ASLI YAZAGAN
20 OCT 2012
Would you rather be REACTIVE in
your decision-making making
adjustment after the fact?
Would you rather be PROACTIVE in
your decision making adjusting
your strategy based on a look of
the future allowing you decides
your problems and capitalize the
opportunities long before the
computation ?
2
Anticipate Business Opportunities
Empower Action and Drive Impact
FINANCIAL
DATA
PERFORMAN
CE DATA
CUSTOMER
DATA
Fact-based decisions for undeniable bottom line impact
3
 History
 Business Model
 DSS-BI related product:
◦ SAS Enterprise BI Server
 Capabilities
 Limitations
 A success Story
4
 SAS began as a project sponsored by NIH to
analyze agricultural data in 1966.
 NC State and 7 other universities teamed to
develop the software.
 Jim Goodnight (CEO) and Jim Barr were the
project leaders.
 In 1972, SAS was licensed to
◦ Banks
◦ Pharmaceuticals
◦ Insurers
◦ Universities
5
 In 1976, SAS was incorporated with 4 people.
 Base SAS was about 300.000 lines of code
written on punch cards.
 In 1978, 21 employees and 600 customer.
 In 1979, first overseas software license to
Databank of New Zealand.
 Primary focus: Meet customer needs
6
 SAS one of the fastest-growing companies in
America
 Another branch in UK.
 SAS was moving toward the frontier of
decision support.
 The company was in a unique position to give
customers the ability
◦ Make sense out of mountains of data
◦ Make decisions based on those discoveries
◦ Bringing them the competitive advantage
7
 More than 7000 employee
 SAS/PH-Clinical® software
 SAS Financial Management
 SAS Human Capital Management
 SAS Curriculum Pathways
8
 Web-enabled capabilities
 Joining Web 2.0
9
SAS provides software to 96 of the TOP 100
Companies on Fortune Global 500
and to 90% of all 500.
10
 Subscription Plan Business Model
11
◦ Stimulate their mind
 Learning and being challenged motivate workers more than
money
 Updating tools
◦ Eliminate distractions
 Conducting annual surveys
 Medical Facilities
 Daycare, basketball court, swimming pool, exercise room,
dry cleaning, haircut…
 Flexible work hours
◦ Training
 industry-technology related conferences
 Write papers
 R&D expos to share their work with non-technical stuff
12
◦ “We are all on the same team, seeking the
same goal of providing superior product”
◦ Open door policy
◦ ‘Go get it, go get it’
13
◦ Customer tells you why and how to get better
◦ Hear customers’ voice loud, clear and
unfiltered.
◦ Db for customer feedbacks, suggestions and
comments
14
 “Creative capital is generated every time SAS’
employees and customers interact.”
◦ SAS prints the names of its software developers in
product manuals so customers can call them
directly.
Employee
loyalty is
high
Customer
royalty is
high
Company
saves
money
Well-funded
R&D
Better
products
and 
customer
15
 Integrates the power of SAS Analytics and SAS
Data Management to provide insights that
power better decisions.
◦ Provides the information needed to drive faster,
better decisions.
◦ Increases data consistency, enables data-driven
decisions and streamlines administration.
◦ Enables vendor consolidation and standardization
with a comprehensive BI solution
16
 1. Portal and Customized Dashboard
 2. Businees Visualization
 3. Web and Desktop Reporting
 4. Mobile Analytics
 5. Microsoft Office Integration
 6. Query and Analysis
 7. OLAP
 8. Flexible deployment options
 9. Guided Analysis and Development
 10. Application Development
 11. Business Metadata Management
17
A SUCCESS STORY
Implementing SAS Enterprise BI Server
at
US Department of House
and
Urban Development (HUD)
HUD
 The mission of HUD’s Office of Policy
Development and Research (PDR) is to provide
impartial analysis, advice, and policy
recommendations to the HUD Secretary, other
HUD executives.
 PDR staff must analyze large, complicated, and
disparate datasets and provide the information
requested in a user-friendly format.
 For many years, they used Microsoft® Access®
and Microsoft® Excel® to extract and analyze
data for trend identification, performance
monitoring, and evaluation. 19
REQUIREMENTS
1. Accessibility: accessible to over 100 users who
were geographically separated, and using
different database technology
2. Data Security
3. Password Integration: seamless integration
with the Department’s LAN password
authentication.
4. DB Integration: the server had to seamlessly
integrate with Department’s databases.
5. Client-Serves Data Transfer: all users could
move data between the server and their
desktop PC.
6. Cost
20
IMPLEMENTATION ISSUES
 Getting the authorization:
 The three-way price negotiation between HUD, IT services,
and SAS was a complicated four-month, back-and-forth
process. The SAS BI system administrator has a direct
line of communication with the HUD’s administrator.
They speak to each other whenever a problem is detected or
any changes are made to the databases.
 Inability of SAS BI to integrate with HUD’s existing
Geographic Information System (GIS) database :
 to solve the problem, HUD had to buy a software and SAS
changed the system based on HUD’s proposed changes.
Successfully met all six requirements.
21
 The paper presents various ways of measuring the popularity
or market share of BMDP, JMP, Minitab, R, R-PLUS, Revolution
R, S-PLUS, SAS, SPSS, Stata, Statistica, and Systat.
22
23
24
Appendix
Screenshots for SAS ENTERPRISE BI
SERVER
Features
1. Portal and Customized Dashboard
Users to create and customize their own dashboards
26
2. Business Visualization
• Enable information producers to dynamically explore data, investigate patterns
and uncover hidden facts.
27
3. Web and Desktop Reporting
28
4. Mobile Analytics
29
5. Microsoft Office Integration
30
6. Query and Analysis
31
7. OLAP
• Multidimensional database is designed to handle large volumes of business
intelligence data
32

Sas Presentation

  • 1.
    Statistical Analysis System ASLIYAZAGAN IS533 HW3 ASLI YAZAGAN 20 OCT 2012
  • 2.
    Would you ratherbe REACTIVE in your decision-making making adjustment after the fact? Would you rather be PROACTIVE in your decision making adjusting your strategy based on a look of the future allowing you decides your problems and capitalize the opportunities long before the computation ? 2
  • 3.
    Anticipate Business Opportunities EmpowerAction and Drive Impact FINANCIAL DATA PERFORMAN CE DATA CUSTOMER DATA Fact-based decisions for undeniable bottom line impact 3
  • 4.
     History  BusinessModel  DSS-BI related product: ◦ SAS Enterprise BI Server  Capabilities  Limitations  A success Story 4
  • 5.
     SAS beganas a project sponsored by NIH to analyze agricultural data in 1966.  NC State and 7 other universities teamed to develop the software.  Jim Goodnight (CEO) and Jim Barr were the project leaders.  In 1972, SAS was licensed to ◦ Banks ◦ Pharmaceuticals ◦ Insurers ◦ Universities 5
  • 6.
     In 1976,SAS was incorporated with 4 people.  Base SAS was about 300.000 lines of code written on punch cards.  In 1978, 21 employees and 600 customer.  In 1979, first overseas software license to Databank of New Zealand.  Primary focus: Meet customer needs 6
  • 7.
     SAS oneof the fastest-growing companies in America  Another branch in UK.  SAS was moving toward the frontier of decision support.  The company was in a unique position to give customers the ability ◦ Make sense out of mountains of data ◦ Make decisions based on those discoveries ◦ Bringing them the competitive advantage 7
  • 8.
     More than7000 employee  SAS/PH-Clinical® software  SAS Financial Management  SAS Human Capital Management  SAS Curriculum Pathways 8
  • 9.
  • 10.
    SAS provides softwareto 96 of the TOP 100 Companies on Fortune Global 500 and to 90% of all 500. 10
  • 11.
     Subscription PlanBusiness Model 11
  • 12.
    ◦ Stimulate theirmind  Learning and being challenged motivate workers more than money  Updating tools ◦ Eliminate distractions  Conducting annual surveys  Medical Facilities  Daycare, basketball court, swimming pool, exercise room, dry cleaning, haircut…  Flexible work hours ◦ Training  industry-technology related conferences  Write papers  R&D expos to share their work with non-technical stuff 12
  • 13.
    ◦ “We areall on the same team, seeking the same goal of providing superior product” ◦ Open door policy ◦ ‘Go get it, go get it’ 13
  • 14.
    ◦ Customer tellsyou why and how to get better ◦ Hear customers’ voice loud, clear and unfiltered. ◦ Db for customer feedbacks, suggestions and comments 14
  • 15.
     “Creative capitalis generated every time SAS’ employees and customers interact.” ◦ SAS prints the names of its software developers in product manuals so customers can call them directly. Employee loyalty is high Customer royalty is high Company saves money Well-funded R&D Better products and  customer 15
  • 16.
     Integrates thepower of SAS Analytics and SAS Data Management to provide insights that power better decisions. ◦ Provides the information needed to drive faster, better decisions. ◦ Increases data consistency, enables data-driven decisions and streamlines administration. ◦ Enables vendor consolidation and standardization with a comprehensive BI solution 16
  • 17.
     1. Portaland Customized Dashboard  2. Businees Visualization  3. Web and Desktop Reporting  4. Mobile Analytics  5. Microsoft Office Integration  6. Query and Analysis  7. OLAP  8. Flexible deployment options  9. Guided Analysis and Development  10. Application Development  11. Business Metadata Management 17
  • 18.
    A SUCCESS STORY ImplementingSAS Enterprise BI Server at US Department of House and Urban Development (HUD)
  • 19.
    HUD  The missionof HUD’s Office of Policy Development and Research (PDR) is to provide impartial analysis, advice, and policy recommendations to the HUD Secretary, other HUD executives.  PDR staff must analyze large, complicated, and disparate datasets and provide the information requested in a user-friendly format.  For many years, they used Microsoft® Access® and Microsoft® Excel® to extract and analyze data for trend identification, performance monitoring, and evaluation. 19
  • 20.
    REQUIREMENTS 1. Accessibility: accessibleto over 100 users who were geographically separated, and using different database technology 2. Data Security 3. Password Integration: seamless integration with the Department’s LAN password authentication. 4. DB Integration: the server had to seamlessly integrate with Department’s databases. 5. Client-Serves Data Transfer: all users could move data between the server and their desktop PC. 6. Cost 20
  • 21.
    IMPLEMENTATION ISSUES  Gettingthe authorization:  The three-way price negotiation between HUD, IT services, and SAS was a complicated four-month, back-and-forth process. The SAS BI system administrator has a direct line of communication with the HUD’s administrator. They speak to each other whenever a problem is detected or any changes are made to the databases.  Inability of SAS BI to integrate with HUD’s existing Geographic Information System (GIS) database :  to solve the problem, HUD had to buy a software and SAS changed the system based on HUD’s proposed changes. Successfully met all six requirements. 21
  • 22.
     The paperpresents various ways of measuring the popularity or market share of BMDP, JMP, Minitab, R, R-PLUS, Revolution R, S-PLUS, SAS, SPSS, Stata, Statistica, and Systat. 22
  • 23.
  • 24.
  • 25.
    Appendix Screenshots for SASENTERPRISE BI SERVER
  • 26.
    Features 1. Portal andCustomized Dashboard Users to create and customize their own dashboards 26
  • 27.
    2. Business Visualization •Enable information producers to dynamically explore data, investigate patterns and uncover hidden facts. 27
  • 28.
    3. Web andDesktop Reporting 28
  • 29.
  • 30.
    5. Microsoft OfficeIntegration 30
  • 31.
    6. Query andAnalysis 31
  • 32.
    7. OLAP • Multidimensionaldatabase is designed to handle large volumes of business intelligence data 32