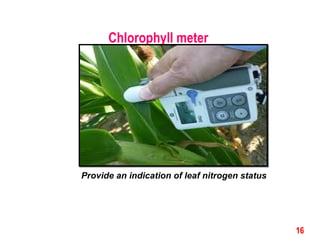
1
Soil fertility evaluation
Dr. Santhosh C.
GVHSS BOYS
KUNNAMKULAM
THRISSUR
Introduction
 Optimum productivity of any cropping system depends on
adequate supply of plant nutrients
 Continued removal of nutrients will increase the potential for future
nutrient related plant stress and yield loss
 Proper rate of plant nutrients is determined by nutrient
requirement of the crop and nutrient supplying power of the soil
 Value of soil and plant analysis depends on careful sampling and
analysis
3
 Nutrient deficiency symptoms of plants
 Analysis of tissue from plants growing on the soil
 Biological tests
 Soil analysis
Techniques to assess soil fertility
4
Nutrient – deficiency symptoms in plants
Growing plants are integrators of all growth factors
Lack of particular nutrient will produce characteristic symptoms
Classification of nutrient deficiency symptoms
•Complete crop failure at seedling stage
•Severe stunting
•Specific leaf symptoms
•Delayed or abnormal maturity
•Poor quality of crops
5
6
Nutrient deficiency in plants
Hidden hunger
• Refers to a situation in which a crop needs more of a given nutrient
yet has shown no deficiency symptoms
• A term used to describe a plant that shows no obvious symptoms
yet the nutrient content is not sufficient to give the top yield
Plant analysis
• Fresh tissue test in field
• Tissue analysis in lab
7
Concept of plant analysis
Amount of given nutrient in plant is directly proportional to
availability of nutrient in soil
Why tissue tests and plant analyses?
To aid in determining the nutrient supplying power of soil
To help in identification of nutrient deficiency symptoms
To aid in determining the effect of fertility treatment
To study the relationship between nutrient status of plants and
crop performance
8
Tissue tests
These semi quantitative tests are intended for verification of
deficiency symptoms
General methods
Chopped plant parts will be treated with extractants and intensity
of colour developed will be compared with standards
Plant tissue will be squeezed with pliers to transfer the plant sap
to filter paper
9
Plant parts tested
10
Parts that will give the best indication of nutritional
status
Conductive tissue of the latest mature leaf
Time of testing
Most critical stage is at bloom stage of from bloom to
early fruiting stage
In corn, the leaf opposite and just below the uppermost
ear at silking is sampled
Well suited for forage crops
Interpretation
 General performance and vigour of plant
 Levels of other nutrients in plants
 Incidence of insects and pests
 Soil conditions like moisture, aeration etc.
 Climatic conditions
 Time of day
Total analysis
Plant materials are ground and analysed by digesting or ashing.
11
Critical nutrient concentration (CNC)
• CNC is located in that portion of the curve where the plant nutrient
concentration changes from deficient to adequate
12
Crop When to sample Part of plant
Rice Seedling stage All the above
ground portions
Prior to heading Four upper most
leaves
Cucumber Before fruit set Mature leaf near
the base of stem
Leaf crops Mid growth stage Youngest mature
leaf
Balance of nutrients
 One of the problem in the interpretation of plant analyses is that of
balance among nutrients
 Ratios of nutrients in plant tissues are used to study nutrient balance
in crops
 Eg:- N/S, K/Mg, K/Ca, Ca+ Mg/K, N/P
13
DIAGNOSIS AND RECOMMENDATION INTEGRATED SYSTEM (DRIS)
 A system that identifies all the nutritional factors limiting crop
production and thus increases the chance of obtaining high crop
yields by improving fertilizer recommendations
Requirements of DRIS
 All factors suspected of having an effect on crop yield must be
identified
 The relationship between these factors and yield must be described
 Calibrated norms must be established
 Recommendations suited to a particular set of conditions must be
continually refined
14
Establishment of DRIS norms
 A survey to obtain data required to establish DRIS norms
 Random selection of sites representing the production area
 Conduct plant and soil analyses
 Record all parameters related directly or indirectly to yield
 Entire population of observations are divided into two
populations
 Each nutrient in plant is expressed in as many ways as possible
15
Chlorophyll meter
16
Provide an indication of leaf nitrogen status
Crop logging
 A graphical record of the progress of crop containing series of
chemical and physical measurements
 Measurements indicating general conditions of plant and suggest
changes in managements
 CNC approach is used
 Leaf sheath is sampled for analysis
17
Biological tests
 Strip tests of farmer’s field
 Neubauer seedling method – based on uptake of nutrients by a large
nos. of plants on a small quantity of soil in short time
 Microbiological methods – growth of azetobacter or aspergillus niger
reflects nutrient deficiency in soil
18
19
Deficiency Crop
Nitrogen Maize , Sorghum ,Leguminous plants
Phosphorus Tomato ,Maize, Lucerne, Cereals, Duranta
Potassium
Maize, Lucerne , Cotton, Potatoes, Banana,
Cucurbits
Sulpur
Lucerne , Clover , Cereals, Tea
Zinc Maize, Tomatoes , Potatoes, Beans, Citrus
Copper Citrus
Iron Ornamental plants, Ixora, Acacia,
Eucalyptus, Gooseberry, Securmanis
Boron Lucerne, Coconut, Guava
Manganese Citrus
Molybdenum Cauliflower, Cabbage
Indicator plants
Soil fertility card
Selection of Area:-
 Extent of rice cultivation was used as one of the criteria for
selection of area under the project.
 Representative areas from three major agro ecological
zones
in the district were also included. Thus 42 Panchayaths
having more than 25% geographical area under rice
representing three agro ecological zones in the district were
selected for sampling.
20
Soil sampling
Detailed soil survey and surface soil sample collection were
carried out by NBSS & LUP in 12 Panchayaths and by KSSO
in the remaining 30 Panchayaths. Surface soil Samples were
collected from plots under each survey number. Collected
samples were handed over by these agencies to RARS,
Pattambi for processing and estimation of available nutrients.
21
Soil pollution
Pollution of earth’s natural land surface by
industrial,commercial, domestic and agricultural activities
Introduction of substances into the soil, resulting in a
change of soil quality, which is likely to affect the normal
use of soil or endangering public health and living
environment.
Soil contaminants spilled onto the surface through many
activities.
22
Causes of soil pollution
 Accidental Spills
 Acid rain (air pollution)
 Intensive farming
 Nuclear wastes
 Industrial Accidents
 Landfill and illegal dumping
23
24
Land Erosion
Agricultural practices such as application pesticides,herbicides
and fertilizers
Mining and other industries
Oil and fuel dumping
Buried wastes
 Disposal of coal ash
 Disposal of ammunitions and agents of war.
 Drainage of contaminated surface water into the soil
 Electronic waste
Industrial wastes
 Fly ash
 Effluents ie. Organic compounds and inorganic complexes
Urban wastes
 Commercial and domestic wastes
 Solid wastes gargage and plastic, metallic containers
Radioactive pollutants
 Nuclear wastes
 Thorium, uranium, heavy water (Sr-90, Cs-137) causing gama
radiation
25
Agricultural practices
 Fertilizers and pesticides
 Toxic metals- lead, arsenic, mercury, cobalt, cadmium etc.
Acid rain
 Air pollution- motor vehicle and factory emissions
26
27
28
29
30
31
Control of soil pollution
Principal remedial strategies
 Aeration
 Bioremediation
 Extraction of ground water or soil vapours
 Excavation of soil
32
33

Santhosh

  • 1.
  • 2.
    Soil fertility evaluation Dr.Santhosh C. GVHSS BOYS KUNNAMKULAM THRISSUR
  • 3.
    Introduction  Optimum productivityof any cropping system depends on adequate supply of plant nutrients  Continued removal of nutrients will increase the potential for future nutrient related plant stress and yield loss  Proper rate of plant nutrients is determined by nutrient requirement of the crop and nutrient supplying power of the soil  Value of soil and plant analysis depends on careful sampling and analysis 3
  • 4.
     Nutrient deficiencysymptoms of plants  Analysis of tissue from plants growing on the soil  Biological tests  Soil analysis Techniques to assess soil fertility 4
  • 5.
    Nutrient – deficiencysymptoms in plants Growing plants are integrators of all growth factors Lack of particular nutrient will produce characteristic symptoms Classification of nutrient deficiency symptoms •Complete crop failure at seedling stage •Severe stunting •Specific leaf symptoms •Delayed or abnormal maturity •Poor quality of crops 5
  • 6.
  • 7.
    Hidden hunger • Refersto a situation in which a crop needs more of a given nutrient yet has shown no deficiency symptoms • A term used to describe a plant that shows no obvious symptoms yet the nutrient content is not sufficient to give the top yield Plant analysis • Fresh tissue test in field • Tissue analysis in lab 7
  • 8.
    Concept of plantanalysis Amount of given nutrient in plant is directly proportional to availability of nutrient in soil Why tissue tests and plant analyses? To aid in determining the nutrient supplying power of soil To help in identification of nutrient deficiency symptoms To aid in determining the effect of fertility treatment To study the relationship between nutrient status of plants and crop performance 8
  • 9.
    Tissue tests These semiquantitative tests are intended for verification of deficiency symptoms General methods Chopped plant parts will be treated with extractants and intensity of colour developed will be compared with standards Plant tissue will be squeezed with pliers to transfer the plant sap to filter paper 9
  • 10.
    Plant parts tested 10 Partsthat will give the best indication of nutritional status Conductive tissue of the latest mature leaf Time of testing Most critical stage is at bloom stage of from bloom to early fruiting stage In corn, the leaf opposite and just below the uppermost ear at silking is sampled Well suited for forage crops
  • 11.
    Interpretation  General performanceand vigour of plant  Levels of other nutrients in plants  Incidence of insects and pests  Soil conditions like moisture, aeration etc.  Climatic conditions  Time of day Total analysis Plant materials are ground and analysed by digesting or ashing. 11
  • 12.
    Critical nutrient concentration(CNC) • CNC is located in that portion of the curve where the plant nutrient concentration changes from deficient to adequate 12 Crop When to sample Part of plant Rice Seedling stage All the above ground portions Prior to heading Four upper most leaves Cucumber Before fruit set Mature leaf near the base of stem Leaf crops Mid growth stage Youngest mature leaf
  • 13.
    Balance of nutrients One of the problem in the interpretation of plant analyses is that of balance among nutrients  Ratios of nutrients in plant tissues are used to study nutrient balance in crops  Eg:- N/S, K/Mg, K/Ca, Ca+ Mg/K, N/P 13
  • 14.
    DIAGNOSIS AND RECOMMENDATIONINTEGRATED SYSTEM (DRIS)  A system that identifies all the nutritional factors limiting crop production and thus increases the chance of obtaining high crop yields by improving fertilizer recommendations Requirements of DRIS  All factors suspected of having an effect on crop yield must be identified  The relationship between these factors and yield must be described  Calibrated norms must be established  Recommendations suited to a particular set of conditions must be continually refined 14
  • 15.
    Establishment of DRISnorms  A survey to obtain data required to establish DRIS norms  Random selection of sites representing the production area  Conduct plant and soil analyses  Record all parameters related directly or indirectly to yield  Entire population of observations are divided into two populations  Each nutrient in plant is expressed in as many ways as possible 15
  • 16.
    Chlorophyll meter 16 Provide anindication of leaf nitrogen status
  • 17.
    Crop logging  Agraphical record of the progress of crop containing series of chemical and physical measurements  Measurements indicating general conditions of plant and suggest changes in managements  CNC approach is used  Leaf sheath is sampled for analysis 17
  • 18.
    Biological tests  Striptests of farmer’s field  Neubauer seedling method – based on uptake of nutrients by a large nos. of plants on a small quantity of soil in short time  Microbiological methods – growth of azetobacter or aspergillus niger reflects nutrient deficiency in soil 18
  • 19.
    19 Deficiency Crop Nitrogen Maize, Sorghum ,Leguminous plants Phosphorus Tomato ,Maize, Lucerne, Cereals, Duranta Potassium Maize, Lucerne , Cotton, Potatoes, Banana, Cucurbits Sulpur Lucerne , Clover , Cereals, Tea Zinc Maize, Tomatoes , Potatoes, Beans, Citrus Copper Citrus Iron Ornamental plants, Ixora, Acacia, Eucalyptus, Gooseberry, Securmanis Boron Lucerne, Coconut, Guava Manganese Citrus Molybdenum Cauliflower, Cabbage Indicator plants
  • 20.
    Soil fertility card Selectionof Area:-  Extent of rice cultivation was used as one of the criteria for selection of area under the project.  Representative areas from three major agro ecological zones in the district were also included. Thus 42 Panchayaths having more than 25% geographical area under rice representing three agro ecological zones in the district were selected for sampling. 20
  • 21.
    Soil sampling Detailed soilsurvey and surface soil sample collection were carried out by NBSS & LUP in 12 Panchayaths and by KSSO in the remaining 30 Panchayaths. Surface soil Samples were collected from plots under each survey number. Collected samples were handed over by these agencies to RARS, Pattambi for processing and estimation of available nutrients. 21
  • 22.
    Soil pollution Pollution ofearth’s natural land surface by industrial,commercial, domestic and agricultural activities Introduction of substances into the soil, resulting in a change of soil quality, which is likely to affect the normal use of soil or endangering public health and living environment. Soil contaminants spilled onto the surface through many activities. 22
  • 23.
    Causes of soilpollution  Accidental Spills  Acid rain (air pollution)  Intensive farming  Nuclear wastes  Industrial Accidents  Landfill and illegal dumping 23
  • 24.
    24 Land Erosion Agricultural practicessuch as application pesticides,herbicides and fertilizers Mining and other industries Oil and fuel dumping Buried wastes  Disposal of coal ash  Disposal of ammunitions and agents of war.  Drainage of contaminated surface water into the soil  Electronic waste
  • 25.
    Industrial wastes  Flyash  Effluents ie. Organic compounds and inorganic complexes Urban wastes  Commercial and domestic wastes  Solid wastes gargage and plastic, metallic containers Radioactive pollutants  Nuclear wastes  Thorium, uranium, heavy water (Sr-90, Cs-137) causing gama radiation 25
  • 26.
    Agricultural practices  Fertilizersand pesticides  Toxic metals- lead, arsenic, mercury, cobalt, cadmium etc. Acid rain  Air pollution- motor vehicle and factory emissions 26
  • 27.
  • 28.
  • 29.
  • 30.
  • 31.
  • 32.
    Control of soilpollution Principal remedial strategies  Aeration  Bioremediation  Extraction of ground water or soil vapours  Excavation of soil 32
  • 33.