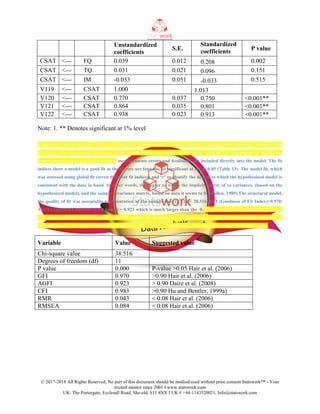
© 2017-2018 All Rights Reserved, No part of this document should be modied/used without prior consent Statsworkℱ - Your
trusted mentor since 2001 I www.statswork.com
UK: The Portergate, Ecclesall Road, She-eld, S11 8NX I UK # +44-1143520021, Info@statswork.com
Exploratory factor analysis (EFA)
Exploratory factor analysis (EFA) is a statistical technique used to reduce data to a
smaller set of summary variables and to explore the theoretical structure of the phenomena. In
order to determine underlying dimensions of multi-item measurement scales used in this study,
principal components analysis with varimax rotation using SPSS 20.0 was performed for all
constructs in the analysis: Tangibility, Assurance, Empathy, Reliability and Responsiveness.
Minimum eigenvalues of 1.0 were used to determine the number of factors for each scale and
with loading above 0.40 on a single factor was retained. Initially, the factorability of 27 items
was examined.
Exploratory factor analysis (EFA) is a statistical technique used to reduce data to a smaller set of summary variables and
to explore the theoretical structure of the phenomena. In order to determine underlying dimensions of multi-item
Table 1: Rotated factor loadings for functional quality (n=43)measurement scales used in this study,
Functional
quality items
Component % variance
explained
Factor 1 Factor 2 Factor 3 Factor 4 Factor 5
Tangibility
TG5 .875
64.25
TG4 .871
TG2 .848
TG7 .838
TG1 .833
TG3 .826
Assurance
AS1 .977
81.96
AS4 .975
AS6 .949
AS3 .946
AS5 .935
Empathy
EM6 .819
87.87
EM3 .774
EM5 .759
EM4 .746
EM1 .718
Reliability
RL6 .745
RL1 .736
© 2017-2018 All Rights Reserved, No part of this document should be modied/used without prior consent Statsworkℱ - Your
trusted mentor since 2001 I www.statswork.com
UK: The Portergate, Ecclesall Road, She-eld, S11 8NX I UK # +44-1143520021, Info@statswork.com
RL4 .719
91.39RL3 .718
RL2 .709
RL8 .688
Responsiveness
RE4 .756
94.10
RE2 .755
RE5 .725
RE1 .712
RE6 .573
 Exploratory factor analysis (EFA) is a statistical technique used to reduce data to a smaller set of summary
variables and to explore the theoretical structure of the phenomena. In order to determine underlying
Six items with inputs fromdimensions of multi-item measurement scales used in this study,
customers were loaded under Factor one with loading ranging from 0.826 to 0.875.
Hence it is named as “Tangibility” for functional quality.
 Five items were loaded under Factor Two with loading ranging from 0.935 to
0.977. Hence it is named as “Assurance” for functional quality.
 Five items were loaded under Factor Three with loading ranging from 0.718 to
0.819. Hence it is named as “Empathy” for functional quality.
 Six items were loaded under Factor Four with loading ranging from 0.688 to 0.745.
Hence it is named as “Reliability” for functional quality.
 Five items were loaded under Factor Five with loading ranging from 0.573 to
0.756. Hence it is named as “Responsiveness” for functional quality.
Table 2: Eigen values in the Functional Quality (n=43)
Factors
EIGENVALUE
S
% TOTAL
VARIANCE
CUMULATIVE
EIGENVALUES
CUMULATIVE
PERCENTAGE
1 9.244 64.248 9.244 64.248
2 5.129 17.710 14.373 81.958
3 4.685 5.911 19.058 87.869
4 3.822 3.518 22.880 91.387
5 2.426 2.716 25.306 94.103
© 2017-2018 All Rights Reserved, No part of this document should be modied/used without prior consent Statsworkℱ - Your
trusted mentor since 2001 I www.statswork.com
UK: The Portergate, Ecclesall Road, She-eld, S11 8NX I UK # +44-1143520021, Info@statswork.com
Exploratory factor analysis (EFA) is a statistical technique used to reduce data to a
smaller set of summary variables and to explore the theoretical structure of the phenomena. In
order to determine underlying dimensions of multi-item measurement scales used in this study,
must be greater than one. Thus factors with eigenvalues greater than one were retained for
subsequent analysis. All the factors accounted for 64-94% of the variance.
Confirmatory Factor Analysis (CFA)
Using the reslult of EFA with the shortlisted 42 items (Table 4), a questionnaire was
prepared and sent to 552 respondents, of which the data of 352 respondents was considered clean
and taken for further analysis. Confirmatory Factor Analysis was carried out on this data. The
CFA was performed with perceived (experienced) service quality data which were received from
352 wind turbine customers.
First order model
In contrast to a first-order CFA model, which comprises only a measurement component,
and a second –order CFA model for which the higher order level is represented by a reduced
form of the structural model, hence the full structural equation model comprises of both a
measurement and structural model. In the full SEM model, certain latent variables are connected
by one way arrows, the directionality of which reflects hypotheses in the study bearing on the
Exploratory factor analysis (EFA) is a statistical technique used to reduce data to a smaller set of
summary variables and to explore the theoretical structure of the phenomena. In order to
Figure 4.determine underlying dimensions of multi-item measurement scales used in this study,
1: First-order model for functional quality, technical quality and corporate quality
© 2017-2018 All Rights Reserved, No part of this document should be modied/used without prior consent Statsworkℱ - Your
trusted mentor since 2001 I www.statswork.com
UK: The Portergate, Ecclesall Road, She-eld, S11 8NX I UK # +44-1143520021, Info@statswork.com
Table 10: CFA for First-order Model for dimensions of functional quality (FNQ),
Technical quality (TEQ) and corporate quality
Unstandardized
coefficients
S.E.
Standardized
coefficients P value
EM <--- FNQ 1.000 0.310
AS <--- FNQ 0.837 0.205 0.303 <0.001**
RE <--- FNQ 1.597 0.358 0.451 <0.001**
RL <--- FNQ 3.190 0.556 0.893 <0.001**
TG <--- FNQ 0.346 0.102 0.226 <0.001**
OS <--- TEQ 1.000 0.972
TA <--- TEQ 0.200 0.053 0.228 <0.001**
IM <--- e8 1.000 0.822
Note: 1. ** Denotes significant at 1% level
Exploratory factor analysis (EFA) is a statistical technique used to reduce data to a
smaller set of summary variables and to explore the theoretical structure of the phenomena. In
order to determine underlying dimensions of multi-item measurement scales used in this study,
into the model. The fit indices show a model is a good fit as the factors are found to be
significant at the p<0.05 (Table 11). The model fit, which was assessed using global fit (seven
different fit indices) and „r‟ to identify the degree to which the hypothesized model is consistent
with the data in hand. In other words, the degree to which the implicit matrix of co variances,
(based on the hypothesized model), and the sample covariance matrix, based on data it seems to
© 2017-2018 All Rights Reserved, No part of this document should be modied/used without prior consent Statsworkℱ - Your
trusted mentor since 2001 I www.statswork.com
UK: The Portergate, Ecclesall Road, She-eld, S11 8NX I UK # +44-1143520021, Info@statswork.com
fit (Bollen, 1989).The structural model, the quality of fit was acceptable representation of the
sample data (χ2
(13)= 24.744, GFI (Goodness of Fit Index)=0.982; AGFI (Adjusted Goodness of
Fit Index) = 0.951 which is much larger than the 0.90 criteria as suggested by Exploratory factor
analysis (EFA) is a statistical technique used to reduce data to a smaller set of summary variables
and to explore the theoretical structure of the phenomena. In order to determine underlying
Table 11: Model fit summarydimensions of multi-item measurement scales used in this study,
4.4.2 Second order model
Figure 2: Second-order model for functional quality, technical quality and corporate
quality with customer satisfaction
Table 12: Second-order Model for dimensions of functional quality, technical quality and
corporate quality with customer satisfaction
Variable Value Suggested value
Chi-square value 24.744
Degrees of freedom (df) 13
P value 0.025 P-value >0.05 Hair et al. (2006)
GFI 0.982 >0.90 Hair et al. (2006)
AGFI 0.951 > 0.90 Daire et al. (2008)
CFI 0.982 >0.90 Hu and Bentler, 1999a)
RMR 0.039 < 0.08 Hair et al. (2006)
RMSEA 0.051 < 0.08 Hair et al. (2006)
© 2017-2018 All Rights Reserved, No part of this document should be modied/used without prior consent Statsworkℱ - Your
trusted mentor since 2001 I www.statswork.com
UK: The Portergate, Ecclesall Road, She-eld, S11 8NX I UK # +44-1143520021, Info@statswork.com
Unstandardized
coefficients
S.E.
Standardized
coefficients P value
CSAT <--- FQ 0.039 0.012 0.208 0.002
CSAT <--- TQ 0.031 0.021 0.096 0.151
CSAT <--- IM -0.033 0.051 -0.033 0.515
V119 <--- CSAT 1.000 1.013
V120 <--- CSAT 0.770 0.037 0.750 <0.001**
V121 <--- CSAT 0.864 0.035 0.801 <0.001**
V122 <--- CSAT 0.938 0.023 0.913 <0.001**
Note: 1. ** Denotes significant at 1% level
Exploratory factor analysis (EFA) is a statistical technique used to reduce data to a smaller set of summary variables and
to explore the theoretical structure of the phenomena. In order to determine underlying dimensions of multi-item
measurements errors and feedbacks are included directly into the model. The fitmeasurement scales used in this study,
indices show a model is a good fit as the factors are found to be significant at the p<0.05 (Table 13). The model fit, which
was assessed using global fit (seven different fit indices) and ‘r’ to identify the degree to which the hypothesized model is
consistent with the data in hand. In other words, the degree to which the implicit matrix of co variances, (based on the
hypothesized model), and the sample covariance matrix, based on data it seems to fit (Bollen, 1989).The structural model,
the quality of fit was acceptable representation of the sample data (χ2
(11)= 38.516, GFI (Goodness of Fit Index)=0.970;
AGFI (Adjusted Goodness of Fit Index) = 0.923 which is much larger than the 0. Exploratory factor analysis (EFA) is a
statistical technique used to reduce data to a smaller set of summary variables and to explore the theoretical structure of
the phenomena. In order to determine underlying dimensions of multi-item measurement scales used in this study,
Variable Value Suggested value
Chi-square value 38.516
Degrees of freedom (df) 11
P value 0.000 P-value >0.05 Hair et al. (2006)
GFI 0.970 >0.90 Hair et al. (2006)
AGFI 0.923 > 0.90 Daire et al. (2008)
CFI 0.983 >0.90 Hu and Bentler, 1999a)
RMR 0.043 < 0.08 Hair et al. (2006)
RMSEA 0.084 < 0.08 Hair et al. (2006)

Sample Work for Exploratory factor analysis (EFA) | Statswork

  • 1.
    © 2017-2018 AllRights Reserved, No part of this document should be modied/used without prior consent Statsworkℱ - Your trusted mentor since 2001 I www.statswork.com UK: The Portergate, Ecclesall Road, She-eld, S11 8NX I UK # +44-1143520021, Info@statswork.com Exploratory factor analysis (EFA) Exploratory factor analysis (EFA) is a statistical technique used to reduce data to a smaller set of summary variables and to explore the theoretical structure of the phenomena. In order to determine underlying dimensions of multi-item measurement scales used in this study, principal components analysis with varimax rotation using SPSS 20.0 was performed for all constructs in the analysis: Tangibility, Assurance, Empathy, Reliability and Responsiveness. Minimum eigenvalues of 1.0 were used to determine the number of factors for each scale and with loading above 0.40 on a single factor was retained. Initially, the factorability of 27 items was examined. Exploratory factor analysis (EFA) is a statistical technique used to reduce data to a smaller set of summary variables and to explore the theoretical structure of the phenomena. In order to determine underlying dimensions of multi-item Table 1: Rotated factor loadings for functional quality (n=43)measurement scales used in this study, Functional quality items Component % variance explained Factor 1 Factor 2 Factor 3 Factor 4 Factor 5 Tangibility TG5 .875 64.25 TG4 .871 TG2 .848 TG7 .838 TG1 .833 TG3 .826 Assurance AS1 .977 81.96 AS4 .975 AS6 .949 AS3 .946 AS5 .935 Empathy EM6 .819 87.87 EM3 .774 EM5 .759 EM4 .746 EM1 .718 Reliability RL6 .745 RL1 .736
  • 2.
    © 2017-2018 AllRights Reserved, No part of this document should be modied/used without prior consent Statsworkℱ - Your trusted mentor since 2001 I www.statswork.com UK: The Portergate, Ecclesall Road, She-eld, S11 8NX I UK # +44-1143520021, Info@statswork.com RL4 .719 91.39RL3 .718 RL2 .709 RL8 .688 Responsiveness RE4 .756 94.10 RE2 .755 RE5 .725 RE1 .712 RE6 .573  Exploratory factor analysis (EFA) is a statistical technique used to reduce data to a smaller set of summary variables and to explore the theoretical structure of the phenomena. In order to determine underlying Six items with inputs fromdimensions of multi-item measurement scales used in this study, customers were loaded under Factor one with loading ranging from 0.826 to 0.875. Hence it is named as “Tangibility” for functional quality.  Five items were loaded under Factor Two with loading ranging from 0.935 to 0.977. Hence it is named as “Assurance” for functional quality.  Five items were loaded under Factor Three with loading ranging from 0.718 to 0.819. Hence it is named as “Empathy” for functional quality.  Six items were loaded under Factor Four with loading ranging from 0.688 to 0.745. Hence it is named as “Reliability” for functional quality.  Five items were loaded under Factor Five with loading ranging from 0.573 to 0.756. Hence it is named as “Responsiveness” for functional quality. Table 2: Eigen values in the Functional Quality (n=43) Factors EIGENVALUE S % TOTAL VARIANCE CUMULATIVE EIGENVALUES CUMULATIVE PERCENTAGE 1 9.244 64.248 9.244 64.248 2 5.129 17.710 14.373 81.958 3 4.685 5.911 19.058 87.869 4 3.822 3.518 22.880 91.387 5 2.426 2.716 25.306 94.103
  • 3.
    © 2017-2018 AllRights Reserved, No part of this document should be modied/used without prior consent Statsworkℱ - Your trusted mentor since 2001 I www.statswork.com UK: The Portergate, Ecclesall Road, She-eld, S11 8NX I UK # +44-1143520021, Info@statswork.com Exploratory factor analysis (EFA) is a statistical technique used to reduce data to a smaller set of summary variables and to explore the theoretical structure of the phenomena. In order to determine underlying dimensions of multi-item measurement scales used in this study, must be greater than one. Thus factors with eigenvalues greater than one were retained for subsequent analysis. All the factors accounted for 64-94% of the variance. Confirmatory Factor Analysis (CFA) Using the reslult of EFA with the shortlisted 42 items (Table 4), a questionnaire was prepared and sent to 552 respondents, of which the data of 352 respondents was considered clean and taken for further analysis. Confirmatory Factor Analysis was carried out on this data. The CFA was performed with perceived (experienced) service quality data which were received from 352 wind turbine customers. First order model In contrast to a first-order CFA model, which comprises only a measurement component, and a second –order CFA model for which the higher order level is represented by a reduced form of the structural model, hence the full structural equation model comprises of both a measurement and structural model. In the full SEM model, certain latent variables are connected by one way arrows, the directionality of which reflects hypotheses in the study bearing on the Exploratory factor analysis (EFA) is a statistical technique used to reduce data to a smaller set of summary variables and to explore the theoretical structure of the phenomena. In order to Figure 4.determine underlying dimensions of multi-item measurement scales used in this study, 1: First-order model for functional quality, technical quality and corporate quality
  • 4.
    © 2017-2018 AllRights Reserved, No part of this document should be modied/used without prior consent Statsworkℱ - Your trusted mentor since 2001 I www.statswork.com UK: The Portergate, Ecclesall Road, She-eld, S11 8NX I UK # +44-1143520021, Info@statswork.com Table 10: CFA for First-order Model for dimensions of functional quality (FNQ), Technical quality (TEQ) and corporate quality Unstandardized coefficients S.E. Standardized coefficients P value EM <--- FNQ 1.000 0.310 AS <--- FNQ 0.837 0.205 0.303 <0.001** RE <--- FNQ 1.597 0.358 0.451 <0.001** RL <--- FNQ 3.190 0.556 0.893 <0.001** TG <--- FNQ 0.346 0.102 0.226 <0.001** OS <--- TEQ 1.000 0.972 TA <--- TEQ 0.200 0.053 0.228 <0.001** IM <--- e8 1.000 0.822 Note: 1. ** Denotes significant at 1% level Exploratory factor analysis (EFA) is a statistical technique used to reduce data to a smaller set of summary variables and to explore the theoretical structure of the phenomena. In order to determine underlying dimensions of multi-item measurement scales used in this study, into the model. The fit indices show a model is a good fit as the factors are found to be significant at the p<0.05 (Table 11). The model fit, which was assessed using global fit (seven different fit indices) and „r‟ to identify the degree to which the hypothesized model is consistent with the data in hand. In other words, the degree to which the implicit matrix of co variances, (based on the hypothesized model), and the sample covariance matrix, based on data it seems to
  • 5.
    © 2017-2018 AllRights Reserved, No part of this document should be modied/used without prior consent Statsworkℱ - Your trusted mentor since 2001 I www.statswork.com UK: The Portergate, Ecclesall Road, She-eld, S11 8NX I UK # +44-1143520021, Info@statswork.com fit (Bollen, 1989).The structural model, the quality of fit was acceptable representation of the sample data (χ2 (13)= 24.744, GFI (Goodness of Fit Index)=0.982; AGFI (Adjusted Goodness of Fit Index) = 0.951 which is much larger than the 0.90 criteria as suggested by Exploratory factor analysis (EFA) is a statistical technique used to reduce data to a smaller set of summary variables and to explore the theoretical structure of the phenomena. In order to determine underlying Table 11: Model fit summarydimensions of multi-item measurement scales used in this study, 4.4.2 Second order model Figure 2: Second-order model for functional quality, technical quality and corporate quality with customer satisfaction Table 12: Second-order Model for dimensions of functional quality, technical quality and corporate quality with customer satisfaction Variable Value Suggested value Chi-square value 24.744 Degrees of freedom (df) 13 P value 0.025 P-value >0.05 Hair et al. (2006) GFI 0.982 >0.90 Hair et al. (2006) AGFI 0.951 > 0.90 Daire et al. (2008) CFI 0.982 >0.90 Hu and Bentler, 1999a) RMR 0.039 < 0.08 Hair et al. (2006) RMSEA 0.051 < 0.08 Hair et al. (2006)
  • 6.
    © 2017-2018 AllRights Reserved, No part of this document should be modied/used without prior consent Statsworkℱ - Your trusted mentor since 2001 I www.statswork.com UK: The Portergate, Ecclesall Road, She-eld, S11 8NX I UK # +44-1143520021, Info@statswork.com Unstandardized coefficients S.E. Standardized coefficients P value CSAT <--- FQ 0.039 0.012 0.208 0.002 CSAT <--- TQ 0.031 0.021 0.096 0.151 CSAT <--- IM -0.033 0.051 -0.033 0.515 V119 <--- CSAT 1.000 1.013 V120 <--- CSAT 0.770 0.037 0.750 <0.001** V121 <--- CSAT 0.864 0.035 0.801 <0.001** V122 <--- CSAT 0.938 0.023 0.913 <0.001** Note: 1. ** Denotes significant at 1% level Exploratory factor analysis (EFA) is a statistical technique used to reduce data to a smaller set of summary variables and to explore the theoretical structure of the phenomena. In order to determine underlying dimensions of multi-item measurements errors and feedbacks are included directly into the model. The fitmeasurement scales used in this study, indices show a model is a good fit as the factors are found to be significant at the p<0.05 (Table 13). The model fit, which was assessed using global fit (seven different fit indices) and ‘r’ to identify the degree to which the hypothesized model is consistent with the data in hand. In other words, the degree to which the implicit matrix of co variances, (based on the hypothesized model), and the sample covariance matrix, based on data it seems to fit (Bollen, 1989).The structural model, the quality of fit was acceptable representation of the sample data (χ2 (11)= 38.516, GFI (Goodness of Fit Index)=0.970; AGFI (Adjusted Goodness of Fit Index) = 0.923 which is much larger than the 0. Exploratory factor analysis (EFA) is a statistical technique used to reduce data to a smaller set of summary variables and to explore the theoretical structure of the phenomena. In order to determine underlying dimensions of multi-item measurement scales used in this study, Variable Value Suggested value Chi-square value 38.516 Degrees of freedom (df) 11 P value 0.000 P-value >0.05 Hair et al. (2006) GFI 0.970 >0.90 Hair et al. (2006) AGFI 0.923 > 0.90 Daire et al. (2008) CFI 0.983 >0.90 Hu and Bentler, 1999a) RMR 0.043 < 0.08 Hair et al. (2006) RMSEA 0.084 < 0.08 Hair et al. (2006)