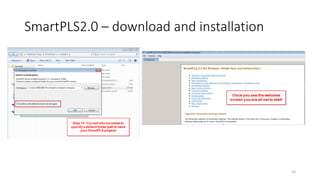
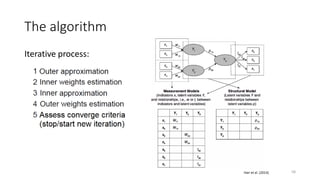
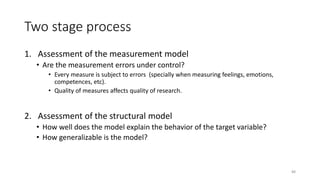
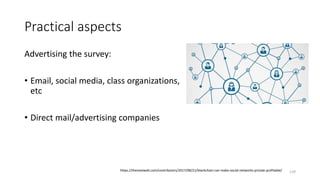
This document provides an agenda for a workshop on structural equation modeling using SmartPLS2.0. The morning session will cover basic concepts, components of structural and measurement models, and the PLS algorithm. After lunch, the analysis method for reflective models will be discussed. The afternoon will conclude with examining the analysis method for formative models. Hugo Watanuki is the PhD student leading the workshop at Napier University.


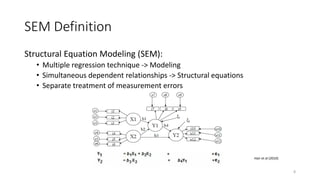

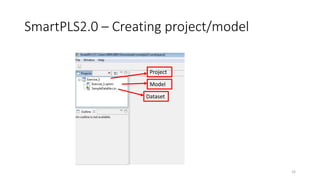
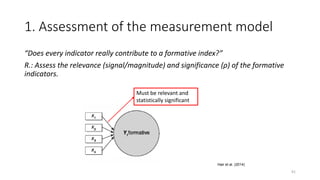
![SmartPLS2.0 – Creating project/model
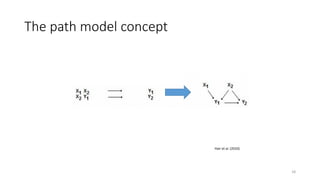
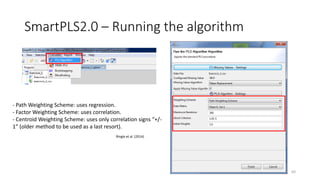
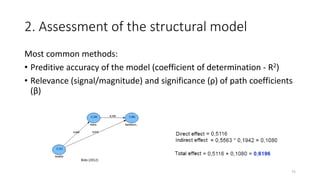
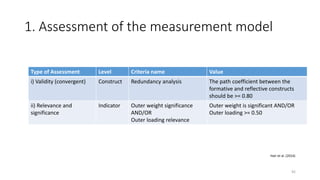
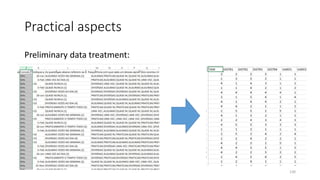
Hair et al. (2014)
29
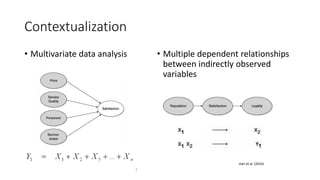
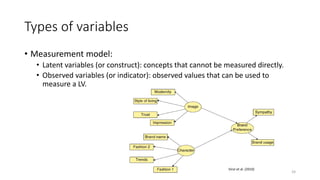
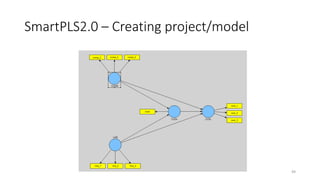
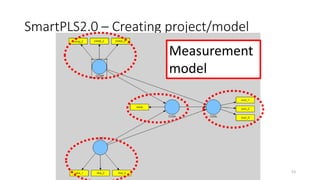
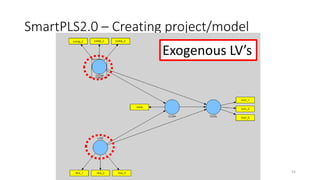
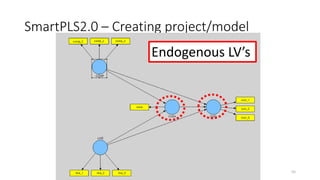
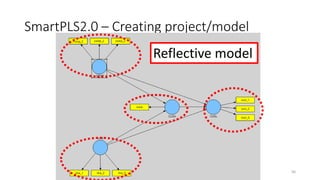
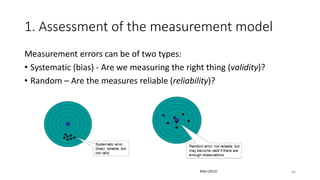
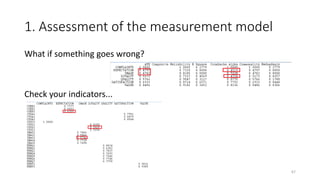
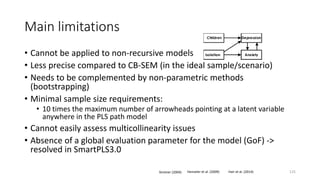
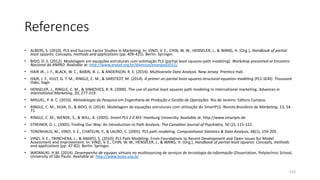
Research question: “What determines
Customer Loyalty (CUSL)?” Competence (COMP)
comp_l [The company] is a top competitor in its market.
comp_2 As far as I know, [the company] is recognized worldwide.
comp_3 I believe that [the company] performs at a premium level.
Likeability (LIKE)
like_l [The company] is a company that I can better identify with than other companies.
like_2
[The company] is a company that I would regret more not having if it no longer existed
than I would other companies.
like_3 I regard [the company] as a likeable company.
Customer Satisfaction (CUSA)
cusa If you consider your experiences with [company], how satisfied are you with [company]?
Customer Loyalty (CUSL)
cusl_l I would recommend [company] to friends and relatives.
cusl_2 If I had to choose again, I would choose [company] as my mobile phone services provider.
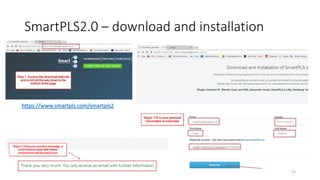
cusl_3 I will remain a customer of [company] in the future.](https://image.slidesharecdn.com/slidesplsworkshopuk-napierv1-180516095218/85/Slides-pls-workshop_uk-napier_v1-29-320.jpg)
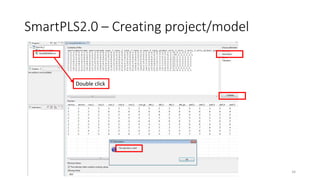


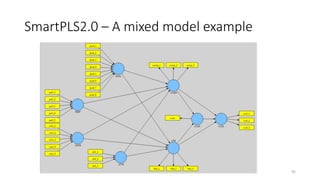
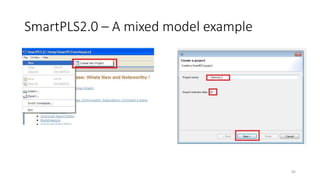
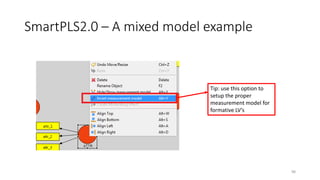
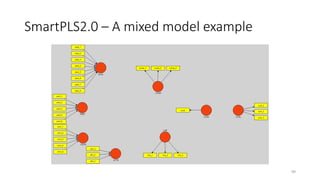
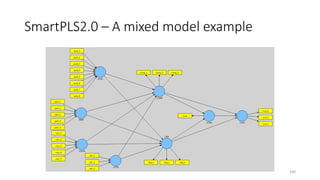
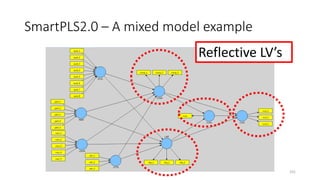
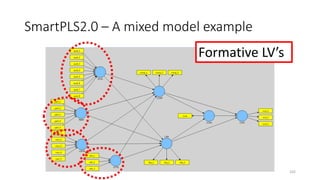
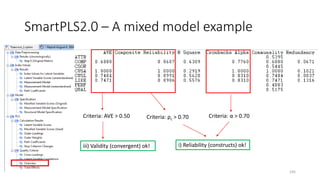
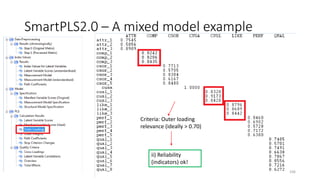
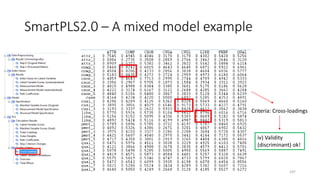
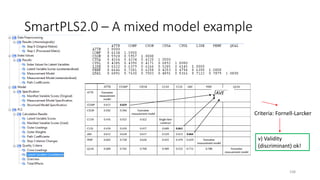
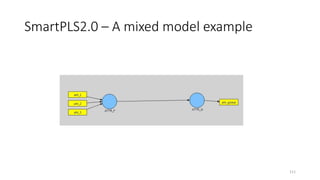
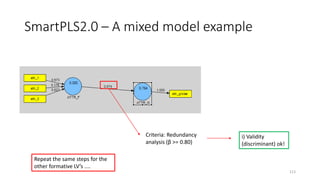
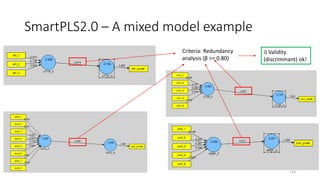
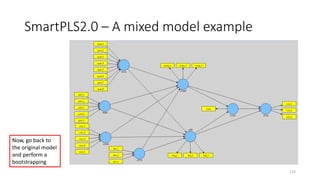
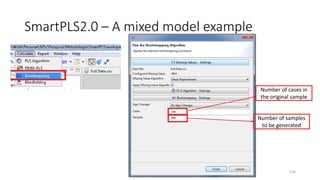
![SmartPLS2.0 – A mixed model example
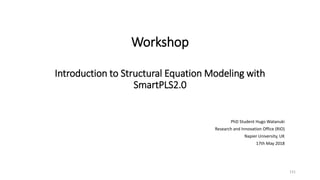
Hair et al. (2014)
94
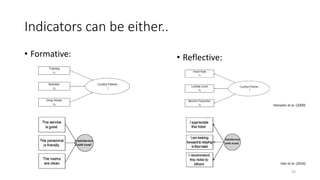
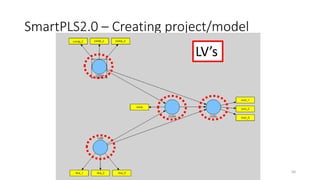
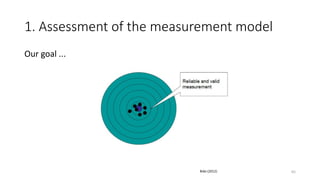
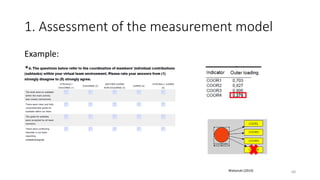
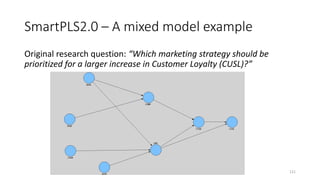
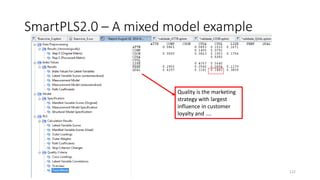
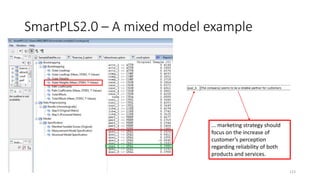
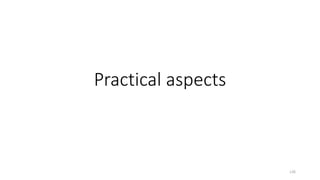
Research question: “Which marketing
strategy should be prioritized for a larger
increase in Customer Loyalty (CUSL)?”
Quality (QUAL)
qual_1 The products/services offered by [the company] are of high quality.
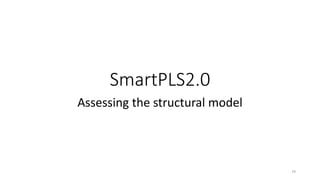
qual_2 In my opinion [the company] tends to be an innovator, rather than an imitator with respect to [industry].
qual_3 I think that [the company]'s products/services offer good value for money.
qual_4 The services [the company] offers are good.
qual_5 Customer concerns are held in high regard at [the company].
qual_6 [The company] seems to be a reliable partner for customers.
qual_7 I regard [the company] as a trustworthy company.
qual_8 I have a lot of respect for [the company].
Performance (PERF)
perf_1 [The company] is a very well-managed company.
perf_2 [The company] is an economically stable company.
perf_3 I assess the business risk for [the company] as modest compared to its competitors.
perf_4 I think that [the company] has growth potential.
perf_5 [The company] has a clear vision about the future of the company.
Corporate Social Responsibility (CSOR)
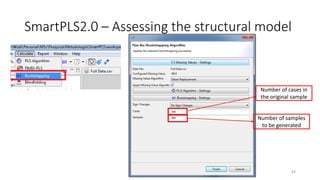
csor_1 [The company] behaves in a socially conscious way.
csor_2 I have the impression that [the company] is forthright in giving information to the public.
csor_3 I have the impression that [the company] has a fair attitude toward competitors.
csor_4 [The company] is concerned about the preservation of the environment.
csor_5 I have the feeling that [the company] is not only concerned about profits.
Attractiveness (ATTR)
attr_1 In my opinion [the company] is successful in attracting high-quality employees.
attr_2 I could see myself working at [the company].
attr_3 I like the physical appearance of [the company] (company, buildings, shops, etc.).](https://image.slidesharecdn.com/slidesplsworkshopuk-napierv1-180516095218/85/Slides-pls-workshop_uk-napier_v1-94-320.jpg)


![Polymer [ बहुलक ] Chemistry Notes PDF - Irfanullah Mehar - JJ Sir Chemistry.pdf](https://cdn.slidesharecdn.com/ss_thumbnails/polymerchemistrynotespdf-irfanullahmehar-jjsirchemistry-260210172118-3f9b37f7-thumbnail.jpg?width=640&height=640&fit=bounds)


