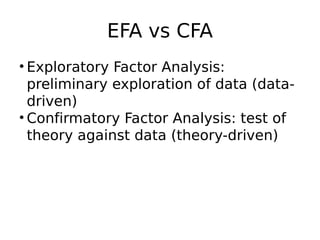
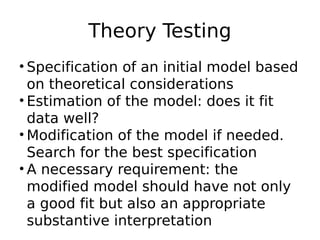
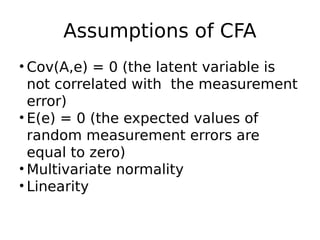
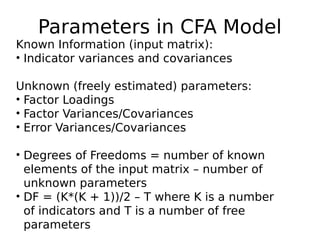
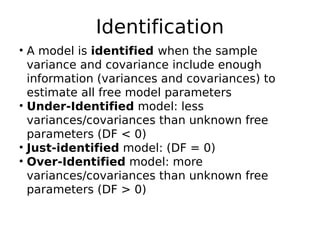
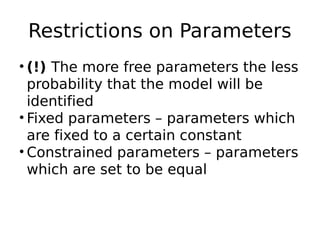
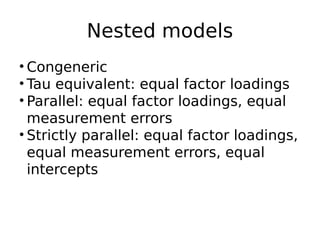
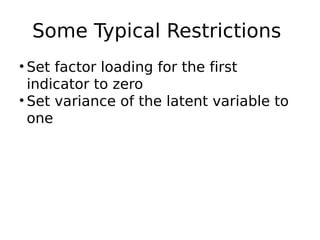
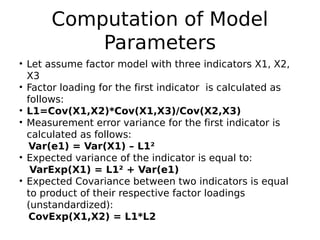
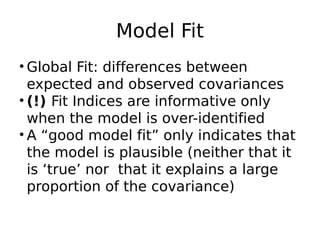
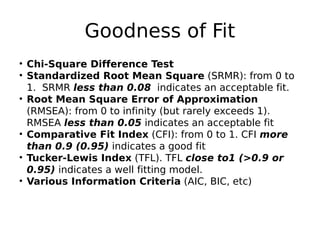
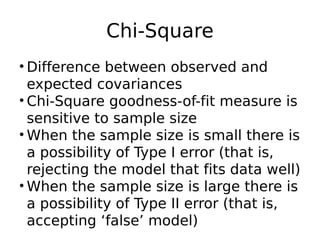
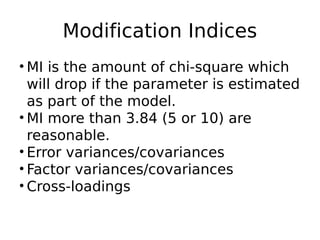
Confirmatory Factor
Analysis
Eduard Ponarin
Boris Sokolov
HSE, St. Petersburg
19.11.2013
EFA vs CFA
• Exploratory Factor Analysis:
preliminary exploration of data (data-
driven)
• Confirmatory Factor Analysis: test of
theory against data (theory-driven)
Why we need CFA?
• Empirical test for a theory
• Operationalization of a theory: do our
indicators actually measure our
constructs? (quality of our
questionnaire)
• Measurement part of structural model
(Instead of aggregated indices)
Theory Testing
• Specification of an initial model based
on theoretical considerations
• Estimation of the model: does it fit
data well?
• Modification of the model if needed.
Search for the best specification
• A necessary requirement: the
modified model should have not only
a good fit but also an appropriate
substantive interpretation
Assumptions of CFA
• Cov(A,e) = 0 (the latent variable is
not correlated with the measurement
error)
• E(e) = 0 (the expected values of
random measurement errors are
equal to zero)
• Multivariate normality
• Linearity
Parameters in CFA Model
Known Information (input matrix):
• Indicator variances and covariances
Unknown (freely estimated) parameters:
• Factor Loadings
• Factor Variances/Covariances
• Error Variances/Covariances
• Degrees of Freedoms = number of known
elements of the input matrix – number of
unknown parameters
• DF = (K*(K + 1))/2 – T where K is a number
of indicators and T is a number of free
parameters
Identification
• A model is identified when the sample
variance and covariance include enough
information (variances and covariances) to
estimate all free model parameters
• Under-Identified model: less
variances/covariances than unknown free
parameters (DF < 0)
• Just-identified model: (DF = 0)
• Over-Identified model: more
variances/covariances than unknown free
parameters (DF > 0)
Restrictions on Parameters
• (!) The more free parameters the less
probability that the model will be
identified
• Fixed parameters – parameters which
are fixed to a certain constant
• Constrained parameters – parameters
which are set to be equal
Nested models
• Congeneric
• Tau equivalent: equal factor loadings
• Parallel: equal factor loadings, equal
measurement errors
• Strictly parallel: equal factor loadings,
equal measurement errors, equal
intercepts
Some Typical Restrictions
• Set factor loading for the first
indicator to zero
• Set variance of the latent variable to
one
Computation of Model
Parameters
• Let assume factor model with three indicators X1, X2,
X3
• Factor loading for the first indicator is calculated as
follows:
• L1=Cov(X1,X2)*Cov(X1,X3)/Cov(X2,X3)
• Measurement error variance for the first indicator is
calculated as follows:
Var(e1) = Var(X1) – L1²
• Expected variance of the indicator is equal to:
VarExp(X1) = L1² + Var(e1)
• Expected Covariance between two indicators is equal
to product of their respective factor loadings
(unstandardized):
CovExp(X1,X2) = L1*L2
Model Fit
• Global Fit: differences between
expected and observed covariances
• (!) Fit Indices are informative only
when the model is over-identified
• A “good model fit” only indicates that
the model is plausible (neither that it
is ‘true’ nor  that it explains a large
proportion of the covariance)
Goodness of Fit
• Chi-Square Difference Test
• Standardized Root Mean Square (SRMR): from 0 to
1. SRMR less than 0.08 indicates an acceptable fit.
• Root Mean Square Error of Approximation
(RMSEA): from 0 to infinity (but rarely exceeds 1).
RMSEA less than 0.05 indicates an acceptable fit
• Comparative Fit Index (CFI): from 0 to 1. CFI more
than 0.9 (0.95) indicates a good fit
• Tucker-Lewis Index (TFL). TFL close to1 (>0.9 or
0.95) indicates a well fitting model.
• Various Information Criteria (AIC, BIC, etc)
Chi-Square
• Difference between observed and
expected covariances
• Chi-Square goodness-of-fit measure is
sensitive to sample size
• When the sample size is small there is
a possibility of Type I error (that is,
rejecting the model that fits data well)
• When the sample size is large there is
a possibility of Type II error (that is,
accepting ‘false’ model)
Modification Indices
• MI is the amount of chi-square which
will drop if the parameter is estimated
as part of the model.
• MI more than 3.84 (5 or 10) are
reasonable.
• Error variances/covariances
• Factor variances/covariances
• Cross-loadings
Thank you for attention!

Confirmatory Factor Analysis

  • 1.
    Confirmatory Factor Analysis Eduard Ponarin BorisSokolov HSE, St. Petersburg 19.11.2013
  • 2.
    EFA vs CFA •Exploratory Factor Analysis: preliminary exploration of data (data- driven) • Confirmatory Factor Analysis: test of theory against data (theory-driven)
  • 3.
    Why we needCFA? • Empirical test for a theory • Operationalization of a theory: do our indicators actually measure our constructs? (quality of our questionnaire) • Measurement part of structural model (Instead of aggregated indices)
  • 4.
    Theory Testing • Specificationof an initial model based on theoretical considerations • Estimation of the model: does it fit data well? • Modification of the model if needed. Search for the best specification • A necessary requirement: the modified model should have not only a good fit but also an appropriate substantive interpretation
  • 5.
    Assumptions of CFA •Cov(A,e) = 0 (the latent variable is not correlated with the measurement error) • E(e) = 0 (the expected values of random measurement errors are equal to zero) • Multivariate normality • Linearity
  • 6.
    Parameters in CFAModel Known Information (input matrix): • Indicator variances and covariances Unknown (freely estimated) parameters: • Factor Loadings • Factor Variances/Covariances • Error Variances/Covariances • Degrees of Freedoms = number of known elements of the input matrix – number of unknown parameters • DF = (K*(K + 1))/2 – T where K is a number of indicators and T is a number of free parameters
  • 7.
    Identification • A modelis identified when the sample variance and covariance include enough information (variances and covariances) to estimate all free model parameters • Under-Identified model: less variances/covariances than unknown free parameters (DF < 0) • Just-identified model: (DF = 0) • Over-Identified model: more variances/covariances than unknown free parameters (DF > 0)
  • 8.
    Restrictions on Parameters •(!) The more free parameters the less probability that the model will be identified • Fixed parameters – parameters which are fixed to a certain constant • Constrained parameters – parameters which are set to be equal
  • 9.
    Nested models • Congeneric •Tau equivalent: equal factor loadings • Parallel: equal factor loadings, equal measurement errors • Strictly parallel: equal factor loadings, equal measurement errors, equal intercepts
  • 10.
    Some Typical Restrictions •Set factor loading for the first indicator to zero • Set variance of the latent variable to one
  • 11.
    Computation of Model Parameters •Let assume factor model with three indicators X1, X2, X3 • Factor loading for the first indicator is calculated as follows: • L1=Cov(X1,X2)*Cov(X1,X3)/Cov(X2,X3) • Measurement error variance for the first indicator is calculated as follows: Var(e1) = Var(X1) – L1² • Expected variance of the indicator is equal to: VarExp(X1) = L1² + Var(e1) • Expected Covariance between two indicators is equal to product of their respective factor loadings (unstandardized): CovExp(X1,X2) = L1*L2
  • 12.
    Model Fit • GlobalFit: differences between expected and observed covariances • (!) Fit Indices are informative only when the model is over-identified • A “good model fit” only indicates that the model is plausible (neither that it is ‘true’ nor  that it explains a large proportion of the covariance)
  • 13.
    Goodness of Fit •Chi-Square Difference Test • Standardized Root Mean Square (SRMR): from 0 to 1. SRMR less than 0.08 indicates an acceptable fit. • Root Mean Square Error of Approximation (RMSEA): from 0 to infinity (but rarely exceeds 1). RMSEA less than 0.05 indicates an acceptable fit • Comparative Fit Index (CFI): from 0 to 1. CFI more than 0.9 (0.95) indicates a good fit • Tucker-Lewis Index (TFL). TFL close to1 (>0.9 or 0.95) indicates a well fitting model. • Various Information Criteria (AIC, BIC, etc)
  • 14.
    Chi-Square • Difference betweenobserved and expected covariances • Chi-Square goodness-of-fit measure is sensitive to sample size • When the sample size is small there is a possibility of Type I error (that is, rejecting the model that fits data well) • When the sample size is large there is a possibility of Type II error (that is, accepting ‘false’ model)
  • 15.
    Modification Indices • MIis the amount of chi-square which will drop if the parameter is estimated as part of the model. • MI more than 3.84 (5 or 10) are reasonable. • Error variances/covariances • Factor variances/covariances • Cross-loadings
  • 16.
    Thank you forattention!