![Al Falcione Director, Product Marketing Salesforce.com [email_address]](https://image.slidesharecdn.com/sales-roi-benchmarking-17082/85/Sales-ROI-Benchmarking-4-320.jpg)
![Rick Davis Senior Vice President and Manager, Commercial Information Services SunTrust [email_address]](https://image.slidesharecdn.com/sales-roi-benchmarking-17082/85/Sales-ROI-Benchmarking-10-320.jpg)
![Wes Benwick President & CEO Bennett’s Business Systems [email_address]](https://image.slidesharecdn.com/sales-roi-benchmarking-17082/85/Sales-ROI-Benchmarking-21-320.jpg)
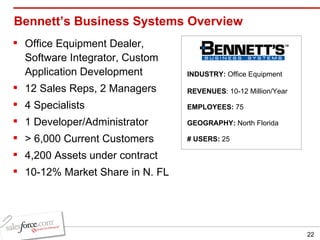
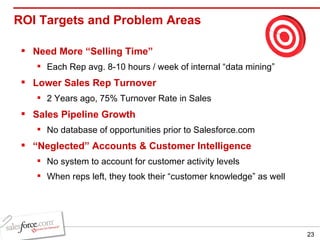
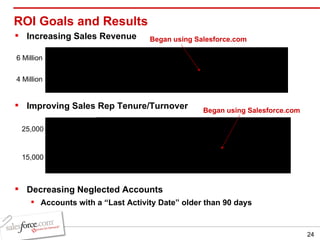
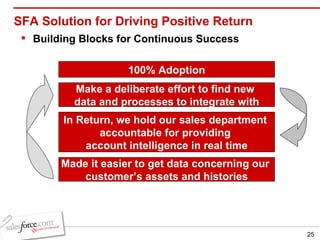
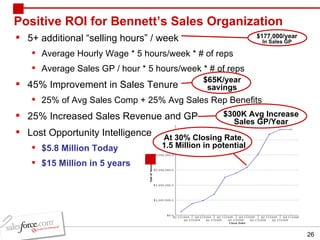
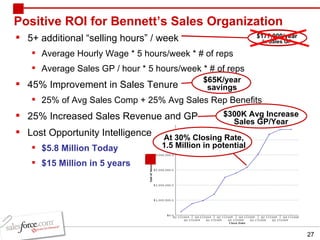
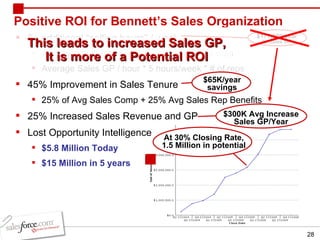
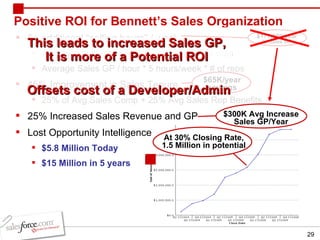
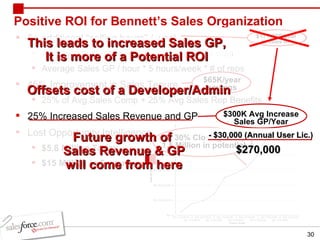
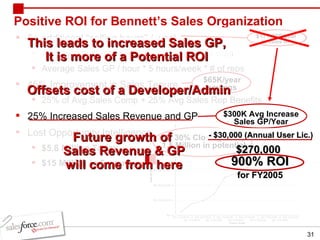

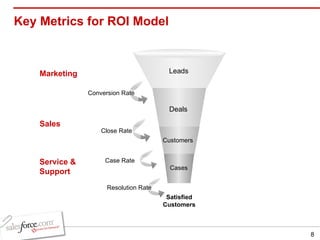
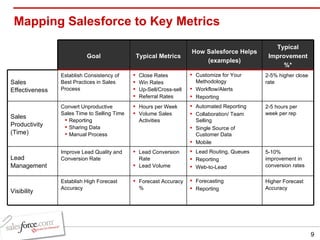
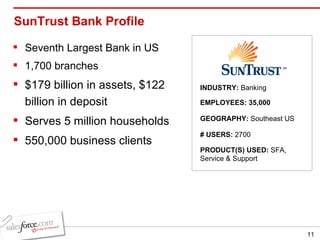
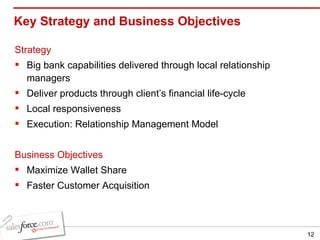
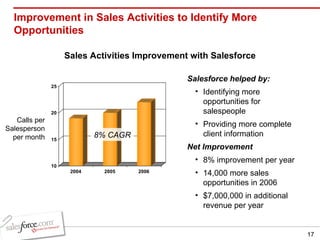
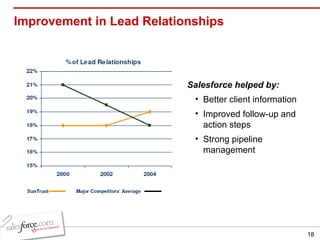
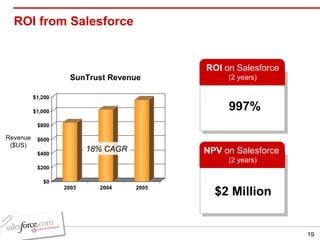
The document discusses an agenda for a sales ROI benchmarking track at a conference. It includes a safe harbor statement, outlines the agenda which will discuss ROI case studies from SunTrust Bank and Bennett's Business Systems, and provides contact information for the presenters. Key metrics for an ROI model are identified such as satisfied customers, leads, deals closed, and case resolution rates. The document also discusses how Salesforce can help improve these metrics.