![Michael Ferris Sr. Project Manager [email_address] Former Director of Service Technology Enterasys Networks Global Technical Assistance Center](https://image.slidesharecdn.com/best-practices-in-measuring-critical-support-metrics-14869/85/Best-Practices-in-Measuring-Critical-Support-Metrics-3-320.jpg)
![Cheral Stewart CRM Administrator CallSource [email_address]](https://image.slidesharecdn.com/best-practices-in-measuring-critical-support-metrics-14869/85/Best-Practices-in-Measuring-Critical-Support-Metrics-15-320.jpg)
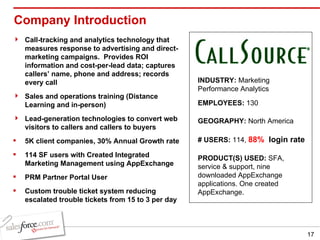
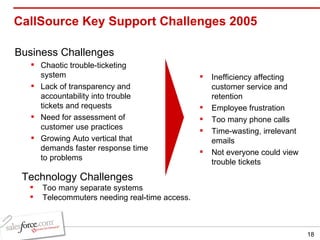
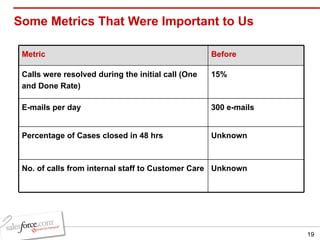
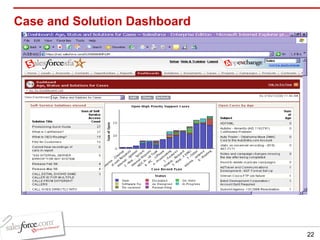
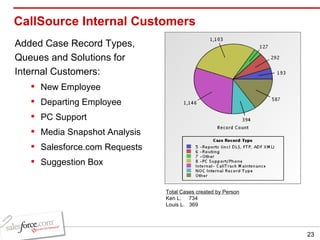
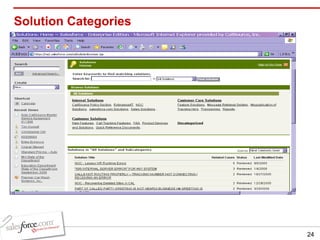
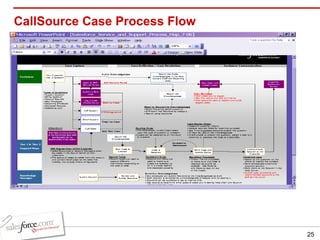
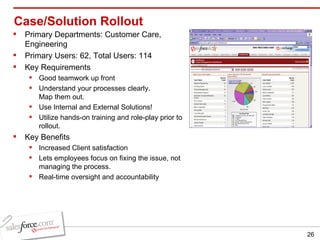
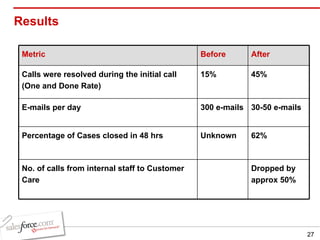


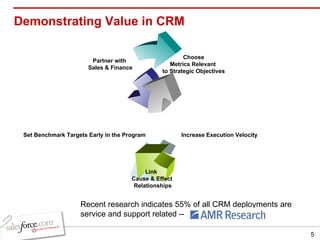
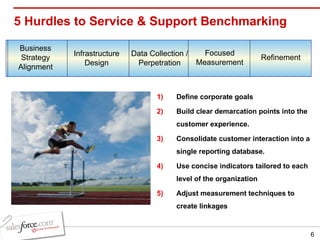
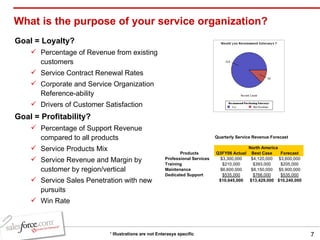
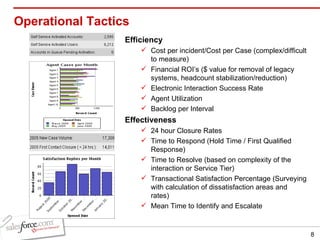
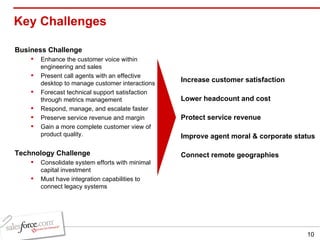
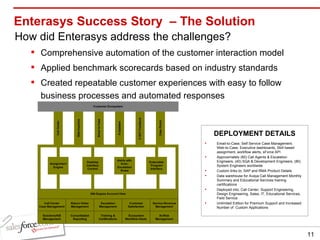
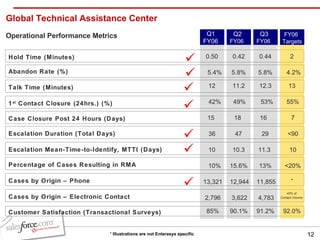
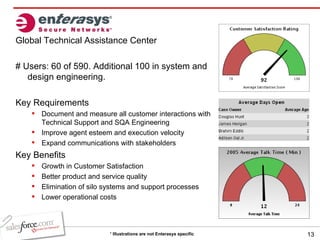
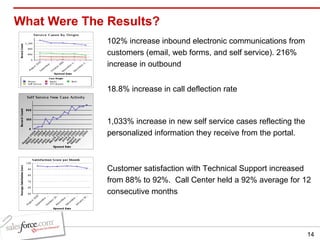
The document discusses best practices for measuring critical support metrics. It provides examples of how two companies, Enterasys Networks and CallSource, used Salesforce to improve their customer support. Both companies saw increases in customer satisfaction and agent productivity by defining clear goals, implementing the right metrics, and ensuring their support teams had access to the necessary customer information. Call deflection rates, case closure times, and internal support requests all improved after implementing Salesforce.