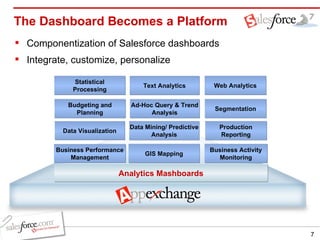
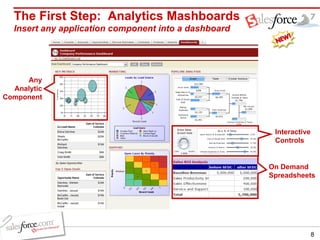
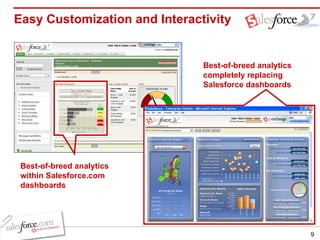
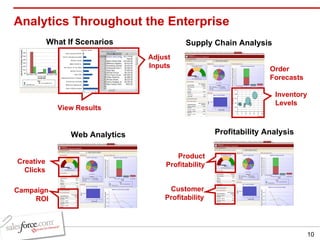
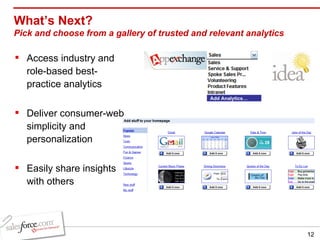
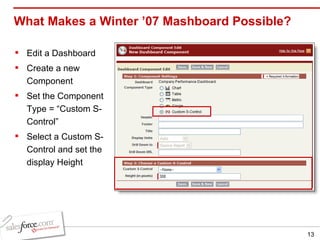
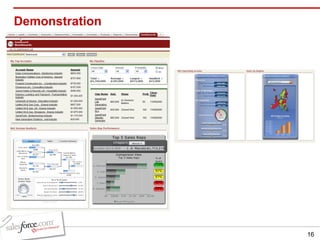
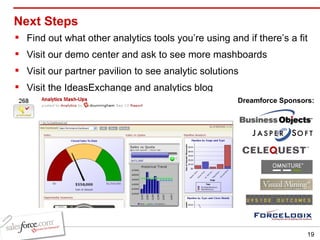
Introducing Analytics Mashboards Darren Cunningham – Director, Product Line Manager Glenn Braunstein  – Principal Sales Engineer Track: Information Technology
Safe Harbor Statement “ Safe harbor” statement under the Private Securities Litigation Reform Act of 1995: This presentation may contain forward-looking statements the achievement of which involves risks, uncertainties and assumptions. If any such risks or uncertainties materialize or if any of the assumptions proves incorrect, our results could differ materially from the results expressed or implied by the forward-looking statements we make.  All statements other than statements of historical fact could be deemed forward-looking, including any projections of subscriber growth, earnings, revenues, or other financial items and any statements regarding strategies or plans of management for future operations, statements of belief, any statements concerning new, planned, or upgraded services or technology developments and customer contracts or use of our services. The risks and uncertainties referred to above include - but are not limited to - risks associated with the integration of Sendia Corporation’s technology, operations, infrastructure and personnel with ours; unexpected costs or delays incurred in integrating Sendia with salesforce.com, which could adversely affect our operating results and rate of growth; any unknown errors or limitations in the Sendia technology; any third party intellectual property claims arising from the Sendia technology; customer and partner acceptance and deployment of the AppExchange and AppExchange Mobile platforms; interruptions or delays in our service or our Web hosting; our new business model; breach of our security measures; possible fluctuations in our operating results and rate of growth; the emerging market in which we operate; our relatively limited operating history; our ability to hire, retain and motivate our employees and manage our growth; competition; our ability to continue to release and gain customer acceptance of new and improved versions of our CRM service; unanticipated changes in our effective tax rate; fluctuations in the number of shares outstanding; the price of such shares; foreign currency exchange rates and interest rates. Further information on these and other factors that could affect our financial results is included in the reports on Forms 10-K, 10-Q and 8-K and in other filings we make with the Securities and Exchange Commission from time to time, including our Form 10-K for the fiscal year ended January 31, 2006. These documents are available on the SEC Filings section of the Investor Information section of our website at  www.salesforce.com/investor . Any unreleased services or features referenced in this or other press releases or public statements are not currently available and may not be delivered on time or at all.  Customers who purchase our services should make purchase decisions based upon features that are currently available.  Salesforce.com, inc. assumes no obligation and does not intend to update these forward-looking statements, except as required by law.
Most enterprises are experiencing a growing proliferation of analytic tools in support of their CRM strategies . The Analytics Challenge Source: Gartner, Inc., "Bringing Balance to the Force of CRM Analytics", March 20, 2006 Barriers to enterprise-wide BI adoption: Ease-of-use Integration with existing, multiple platforms Data quality Training time and cost No clear ROI Scalability No industry standard Cost of BI talent Lower than expected analytic value No future BPM alignment “ ” Source: InformationWeek Research BI Survey of 300 Business Technology Professionals, Spring 2005
The Analytics Challenge Business people want: Simplicity and flexibility Zero-training interface Fast access to information Alignment with process Data-driven decisions IT spends most time on: Data integration and quality Managing security and access Architectural design Reducing costs Managing expectations
The Result? A vast population exists whose business intelligence requirements have not been met to their full potential. “ ” Source: Worldwide BI Tools 2005 Vendor Shares, Dan Vesset, Brian McDonough, IDC June 2006. Source: TDWI Report, Enterprise BI: Strategies and Technologies for Deploying BI on an Enterprise Scale. August 2005
The Salesforce Approach to Analytics Today Easy to integrate best-of-breed analytics Partnerships through Easy-to-use CRM reporting and dashboards
The Dashboard Becomes a Platform Componentization of Salesforce dashboards Integrate, customize, personalize Data Mining/ Predictive Analysis Data Visualization Analytics Mashboards Budgeting and Planning Ad-Hoc Query & Trend Analysis Segmentation Production Reporting Statistical Processing Text Analytics Web Analytics GIS Mapping Business Performance Management Business Activity Monitoring
The First Step:  Analytics Mashboards Insert any application component into a dashboard On Demand Spreadsheets Interactive Controls Any Analytic Component
Easy Customization and Interactivity Best-of-breed analytics within Salesforce.com dashboards Best-of-breed analytics completely replacing Salesforce dashboards
Analytics Throughout the Enterprise Profitability Analysis Web Analytics Supply Chain Analysis Product Profitability Inventory Levels Creative Clicks Campaign ROI Customer Profitability Order Forecasts What If Scenarios Adjust Inputs View Results
AppExchange Analytics Category Today Choice of best-in-class analytics applications Analytics Partners Today Many New Products and Partnerships in development for Winter ’07
Access industry and role-based best-practice analytics Deliver consumer-web simplicity and personalization Easily share insights with others What’s Next? Pick and choose from a gallery of trusted and relevant analytics Add Analytics…
What Makes a Winter ’07 Mashboard Possible? Edit a Dashboard Create a new Component Set the Component Type = “Custom S-Control” Select a Custom S-Control and set the display Height
What’s an S-Control? Any type of content that you can display or run in a browser S-Controls can be: Custom HTML HTML/JavaScript AJAX ActiveX Controls Java Applets URL  Link to an existing webpage Renders the page in Salesforce.com Snippet  Reusable S-Control code Can be HTML/JavaScript, merge fields, formula functions, etc. Included in S-Controls at runtime
Use Cases How have my historical sales been trending? Can I interactively analyze What-If Scenarios? What if I want to perform a Profitability Analysis? What are my Net Operating Sales? Can my Inventory levels meet my Forecast?   “ Moving the BI Line Forward!”
Demonstration
Be Aware Users can select S-Controls that make no sense on dashboards E.g. they need context from being on a detail page Users can select S-Controls that make the page immediately redirect on load You have to design S-Controls that fit the width in Salesforce dashboards today
Commonly Asked Questions What’s not included in Winter ’07 mashboards? API to access salesforce.com reports and/or dashboards S-Control typing So only some S-Controls can be used on dashboards, others in detail pages, others as pop-ups How long does it take to add an S-Control to dashboard? Deployment time < 1 minute per user What level of expertise or skill-set needed?  Developer to build new S-Controls User to build dashboards and use the S-Controls What are some implementation best practices? Always use <NOSCRIPT> where JavaScript is used to generate content You can recover the Salesforce session to implement single sign-on
Next Steps Find out what other analytics tools you’re using and if there’s a fit Visit our demo center and ask to see more mashboards Visit our partner pavilion to see analytic solutions Visit the IdeasExchange and analytics blog Dreamforce Sponsors:
Discussion What other analytical tools are you using today? Do you see opportunities with mashboards?
Analytics Sessions Session Meet the PM – Roadmap Overview Mashboard Shootout Introducing Analytics Mashboards Information Peer Pressure Building Integrated Marketing Reports and Dashboards  How to Create Top Sales Dashboards Best Practices for Competitive Pipeline Analysis  Bulking Up: Large Data Migration, Replication, and Analytics  Instant Stardom: How to Build Executive Dashboards Advanced Reporting and Dashboards for Executive Visibility The Path to Achieving 100% Adoption Manage What You Measure :  Lessons from Dashboard Pros  Hands-On with Executive Reports and Dashboards Track General  General IT Sales Execs Marketing Exec Sales Opps AppX Developers New Sys Admin EE Sys Admin PE Sys Admin Large Ent Dep Also Visit the  Partner Pavilion   for Innovative  Analytics Solutions
Darren Cunningham Director, Product Management Glenn Braunstein Principal Sales Engineer QUESTION & ANSWER SESSION
Session Feedback Let us know how we’re doing! Please score the session from 5 to 1 (5=excellent,1=needs improvement) on the following categories: Overall rating of the session Quality of content Strength of presentation delivery Relevance of the session to your organization Save time! Use your cell phone or mobile device to send Feedback via SMS/Text Messaging! Send a message to  26335 In the message body:   Session 223, ####   For example, “ Session 123, 5555 ” Session ID:  223 Session ID # Scores for 4 categories SMS Voting powered by:

Introducing Analytics Mash-ups

  • 1.
    Introducing Analytics MashboardsDarren Cunningham – Director, Product Line Manager Glenn Braunstein – Principal Sales Engineer Track: Information Technology
  • 2.
    Safe Harbor Statement“ Safe harbor” statement under the Private Securities Litigation Reform Act of 1995: This presentation may contain forward-looking statements the achievement of which involves risks, uncertainties and assumptions. If any such risks or uncertainties materialize or if any of the assumptions proves incorrect, our results could differ materially from the results expressed or implied by the forward-looking statements we make.  All statements other than statements of historical fact could be deemed forward-looking, including any projections of subscriber growth, earnings, revenues, or other financial items and any statements regarding strategies or plans of management for future operations, statements of belief, any statements concerning new, planned, or upgraded services or technology developments and customer contracts or use of our services. The risks and uncertainties referred to above include - but are not limited to - risks associated with the integration of Sendia Corporation’s technology, operations, infrastructure and personnel with ours; unexpected costs or delays incurred in integrating Sendia with salesforce.com, which could adversely affect our operating results and rate of growth; any unknown errors or limitations in the Sendia technology; any third party intellectual property claims arising from the Sendia technology; customer and partner acceptance and deployment of the AppExchange and AppExchange Mobile platforms; interruptions or delays in our service or our Web hosting; our new business model; breach of our security measures; possible fluctuations in our operating results and rate of growth; the emerging market in which we operate; our relatively limited operating history; our ability to hire, retain and motivate our employees and manage our growth; competition; our ability to continue to release and gain customer acceptance of new and improved versions of our CRM service; unanticipated changes in our effective tax rate; fluctuations in the number of shares outstanding; the price of such shares; foreign currency exchange rates and interest rates. Further information on these and other factors that could affect our financial results is included in the reports on Forms 10-K, 10-Q and 8-K and in other filings we make with the Securities and Exchange Commission from time to time, including our Form 10-K for the fiscal year ended January 31, 2006. These documents are available on the SEC Filings section of the Investor Information section of our website at www.salesforce.com/investor . Any unreleased services or features referenced in this or other press releases or public statements are not currently available and may not be delivered on time or at all.  Customers who purchase our services should make purchase decisions based upon features that are currently available.  Salesforce.com, inc. assumes no obligation and does not intend to update these forward-looking statements, except as required by law.
  • 3.
    Most enterprises areexperiencing a growing proliferation of analytic tools in support of their CRM strategies . The Analytics Challenge Source: Gartner, Inc., &quot;Bringing Balance to the Force of CRM Analytics&quot;, March 20, 2006 Barriers to enterprise-wide BI adoption: Ease-of-use Integration with existing, multiple platforms Data quality Training time and cost No clear ROI Scalability No industry standard Cost of BI talent Lower than expected analytic value No future BPM alignment “ ” Source: InformationWeek Research BI Survey of 300 Business Technology Professionals, Spring 2005
  • 4.
    The Analytics ChallengeBusiness people want: Simplicity and flexibility Zero-training interface Fast access to information Alignment with process Data-driven decisions IT spends most time on: Data integration and quality Managing security and access Architectural design Reducing costs Managing expectations
  • 5.
    The Result? Avast population exists whose business intelligence requirements have not been met to their full potential. “ ” Source: Worldwide BI Tools 2005 Vendor Shares, Dan Vesset, Brian McDonough, IDC June 2006. Source: TDWI Report, Enterprise BI: Strategies and Technologies for Deploying BI on an Enterprise Scale. August 2005
  • 6.
    The Salesforce Approachto Analytics Today Easy to integrate best-of-breed analytics Partnerships through Easy-to-use CRM reporting and dashboards
  • 7.
    The Dashboard Becomesa Platform Componentization of Salesforce dashboards Integrate, customize, personalize Data Mining/ Predictive Analysis Data Visualization Analytics Mashboards Budgeting and Planning Ad-Hoc Query & Trend Analysis Segmentation Production Reporting Statistical Processing Text Analytics Web Analytics GIS Mapping Business Performance Management Business Activity Monitoring
  • 8.
    The First Step: Analytics Mashboards Insert any application component into a dashboard On Demand Spreadsheets Interactive Controls Any Analytic Component
  • 9.
    Easy Customization andInteractivity Best-of-breed analytics within Salesforce.com dashboards Best-of-breed analytics completely replacing Salesforce dashboards
  • 10.
    Analytics Throughout theEnterprise Profitability Analysis Web Analytics Supply Chain Analysis Product Profitability Inventory Levels Creative Clicks Campaign ROI Customer Profitability Order Forecasts What If Scenarios Adjust Inputs View Results
  • 11.
    AppExchange Analytics CategoryToday Choice of best-in-class analytics applications Analytics Partners Today Many New Products and Partnerships in development for Winter ’07
  • 12.
    Access industry androle-based best-practice analytics Deliver consumer-web simplicity and personalization Easily share insights with others What’s Next? Pick and choose from a gallery of trusted and relevant analytics Add Analytics…
  • 13.
    What Makes aWinter ’07 Mashboard Possible? Edit a Dashboard Create a new Component Set the Component Type = “Custom S-Control” Select a Custom S-Control and set the display Height
  • 14.
    What’s an S-Control?Any type of content that you can display or run in a browser S-Controls can be: Custom HTML HTML/JavaScript AJAX ActiveX Controls Java Applets URL Link to an existing webpage Renders the page in Salesforce.com Snippet Reusable S-Control code Can be HTML/JavaScript, merge fields, formula functions, etc. Included in S-Controls at runtime
  • 15.
    Use Cases Howhave my historical sales been trending? Can I interactively analyze What-If Scenarios? What if I want to perform a Profitability Analysis? What are my Net Operating Sales? Can my Inventory levels meet my Forecast?  “ Moving the BI Line Forward!”
  • 16.
  • 17.
    Be Aware Userscan select S-Controls that make no sense on dashboards E.g. they need context from being on a detail page Users can select S-Controls that make the page immediately redirect on load You have to design S-Controls that fit the width in Salesforce dashboards today
  • 18.
    Commonly Asked QuestionsWhat’s not included in Winter ’07 mashboards? API to access salesforce.com reports and/or dashboards S-Control typing So only some S-Controls can be used on dashboards, others in detail pages, others as pop-ups How long does it take to add an S-Control to dashboard? Deployment time < 1 minute per user What level of expertise or skill-set needed? Developer to build new S-Controls User to build dashboards and use the S-Controls What are some implementation best practices? Always use <NOSCRIPT> where JavaScript is used to generate content You can recover the Salesforce session to implement single sign-on
  • 19.
    Next Steps Findout what other analytics tools you’re using and if there’s a fit Visit our demo center and ask to see more mashboards Visit our partner pavilion to see analytic solutions Visit the IdeasExchange and analytics blog Dreamforce Sponsors:
  • 20.
    Discussion What otheranalytical tools are you using today? Do you see opportunities with mashboards?
  • 21.
    Analytics Sessions SessionMeet the PM – Roadmap Overview Mashboard Shootout Introducing Analytics Mashboards Information Peer Pressure Building Integrated Marketing Reports and Dashboards How to Create Top Sales Dashboards Best Practices for Competitive Pipeline Analysis Bulking Up: Large Data Migration, Replication, and Analytics Instant Stardom: How to Build Executive Dashboards Advanced Reporting and Dashboards for Executive Visibility The Path to Achieving 100% Adoption Manage What You Measure : Lessons from Dashboard Pros Hands-On with Executive Reports and Dashboards Track General General IT Sales Execs Marketing Exec Sales Opps AppX Developers New Sys Admin EE Sys Admin PE Sys Admin Large Ent Dep Also Visit the Partner Pavilion for Innovative Analytics Solutions
  • 22.
    Darren Cunningham Director,Product Management Glenn Braunstein Principal Sales Engineer QUESTION & ANSWER SESSION
  • 23.
    Session Feedback Letus know how we’re doing! Please score the session from 5 to 1 (5=excellent,1=needs improvement) on the following categories: Overall rating of the session Quality of content Strength of presentation delivery Relevance of the session to your organization Save time! Use your cell phone or mobile device to send Feedback via SMS/Text Messaging! Send a message to 26335 In the message body: Session 223, #### For example, “ Session 123, 5555 ” Session ID: 223 Session ID # Scores for 4 categories SMS Voting powered by: