![Chris Hoffmann Senior Principal & Research Director [email_address]](https://image.slidesharecdn.com/manage-what-you-measure-lessons-from-dashboard-pros-16877/75/Manage-What-You-Measure-Lessons-from-Dashboard-Pros-12-2048.jpg)
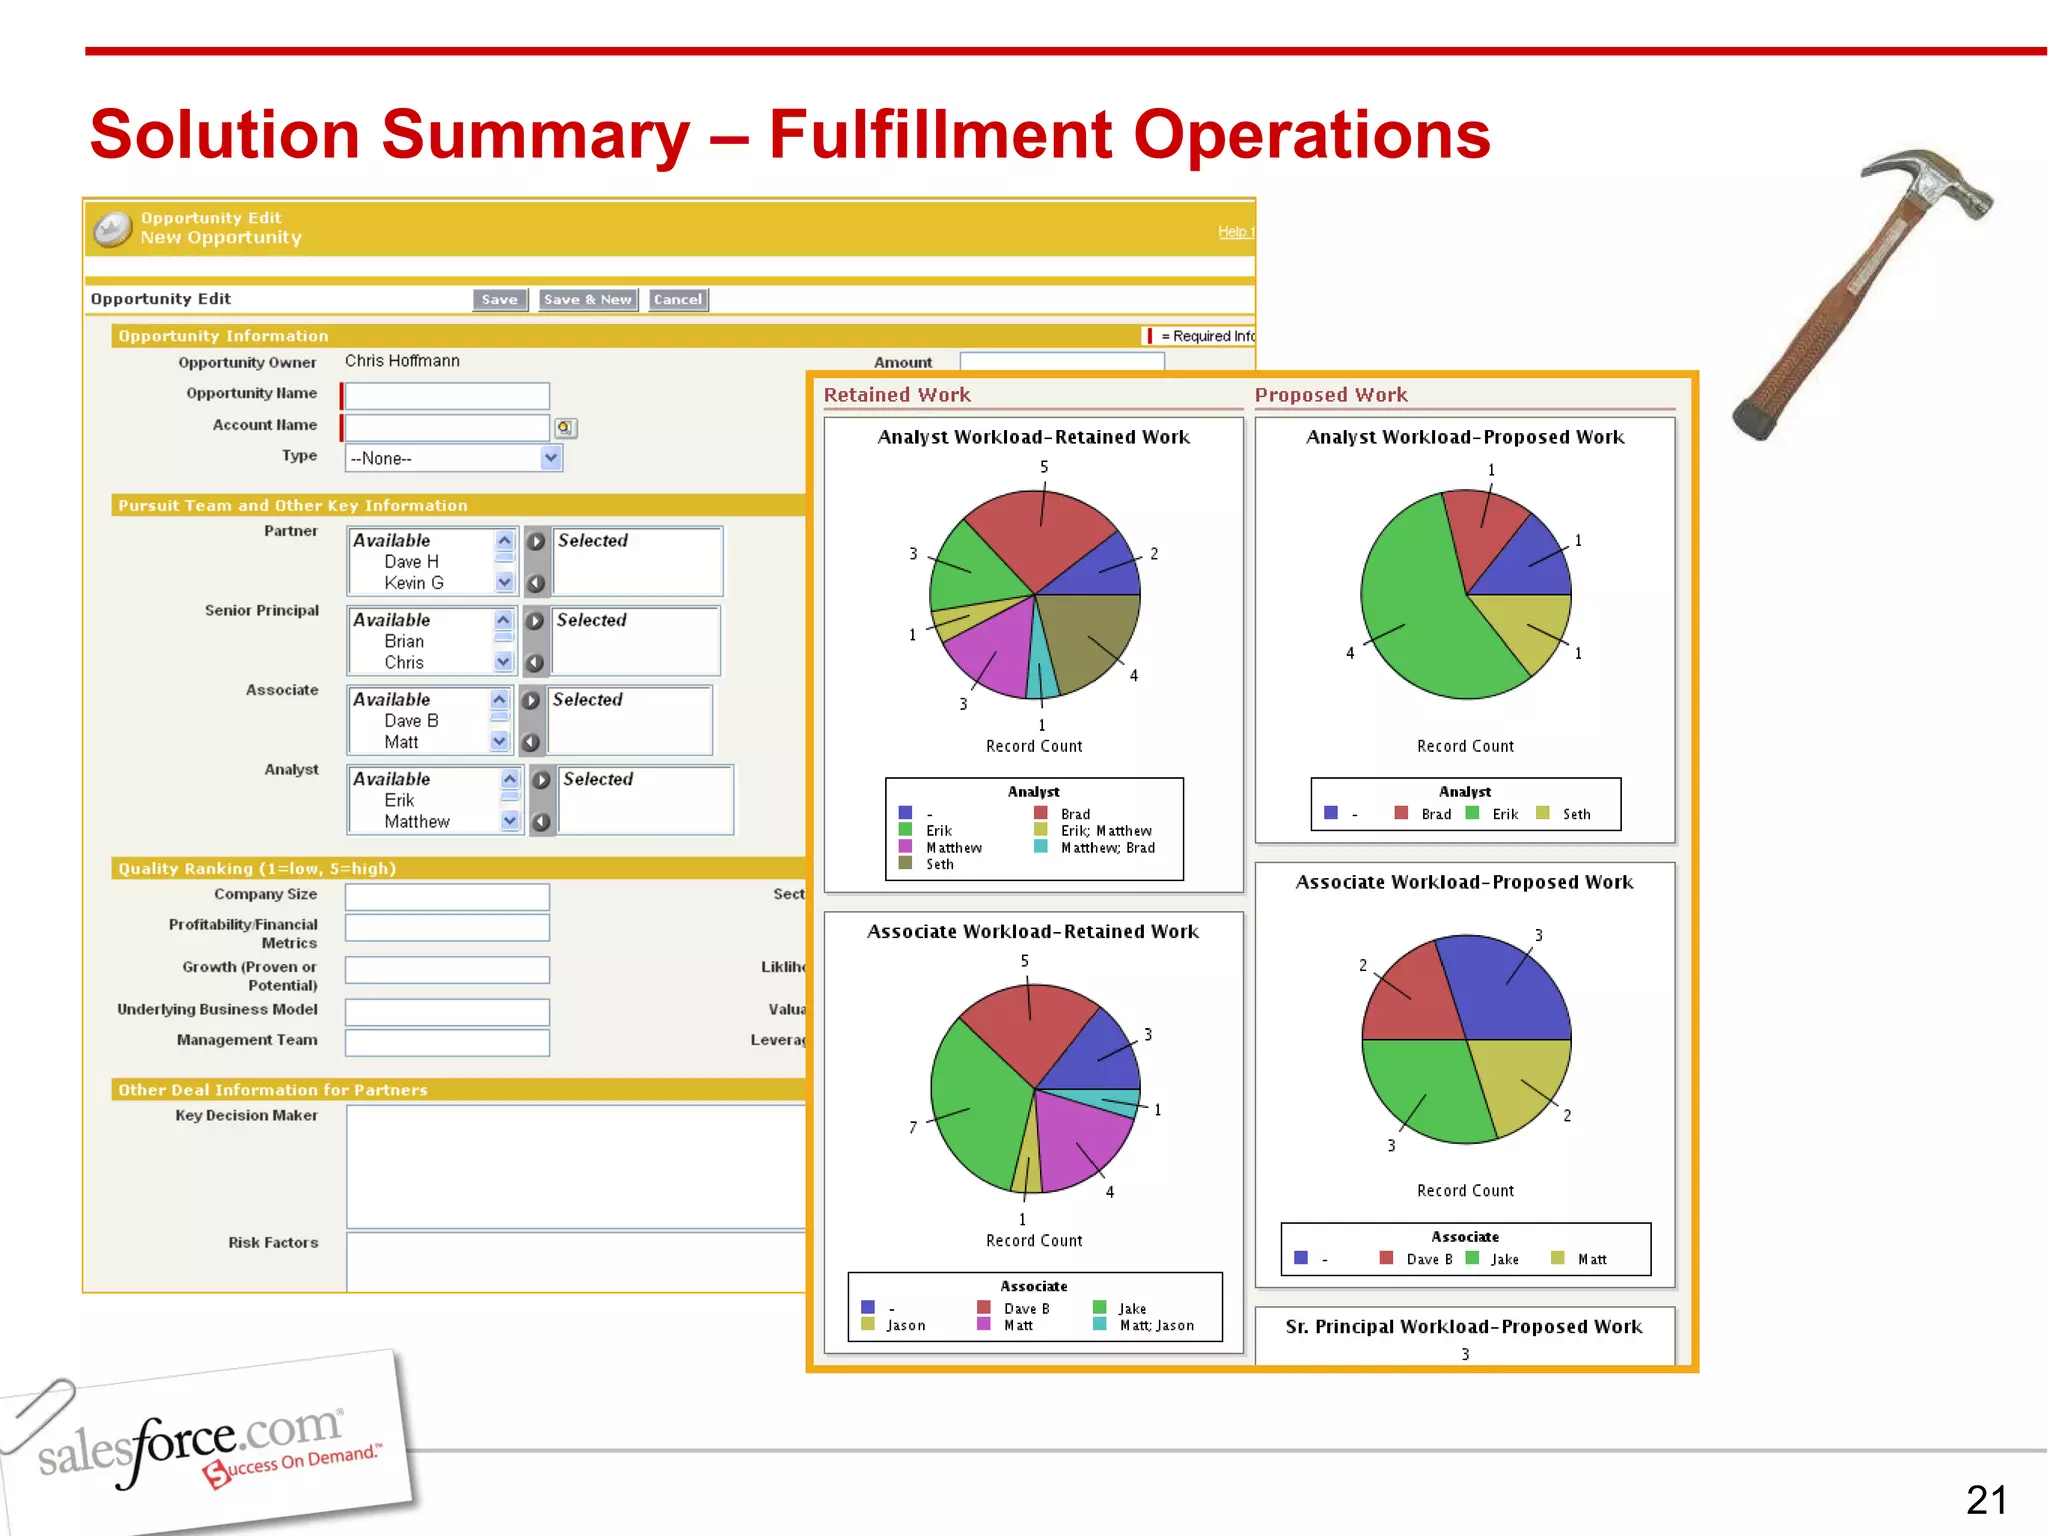
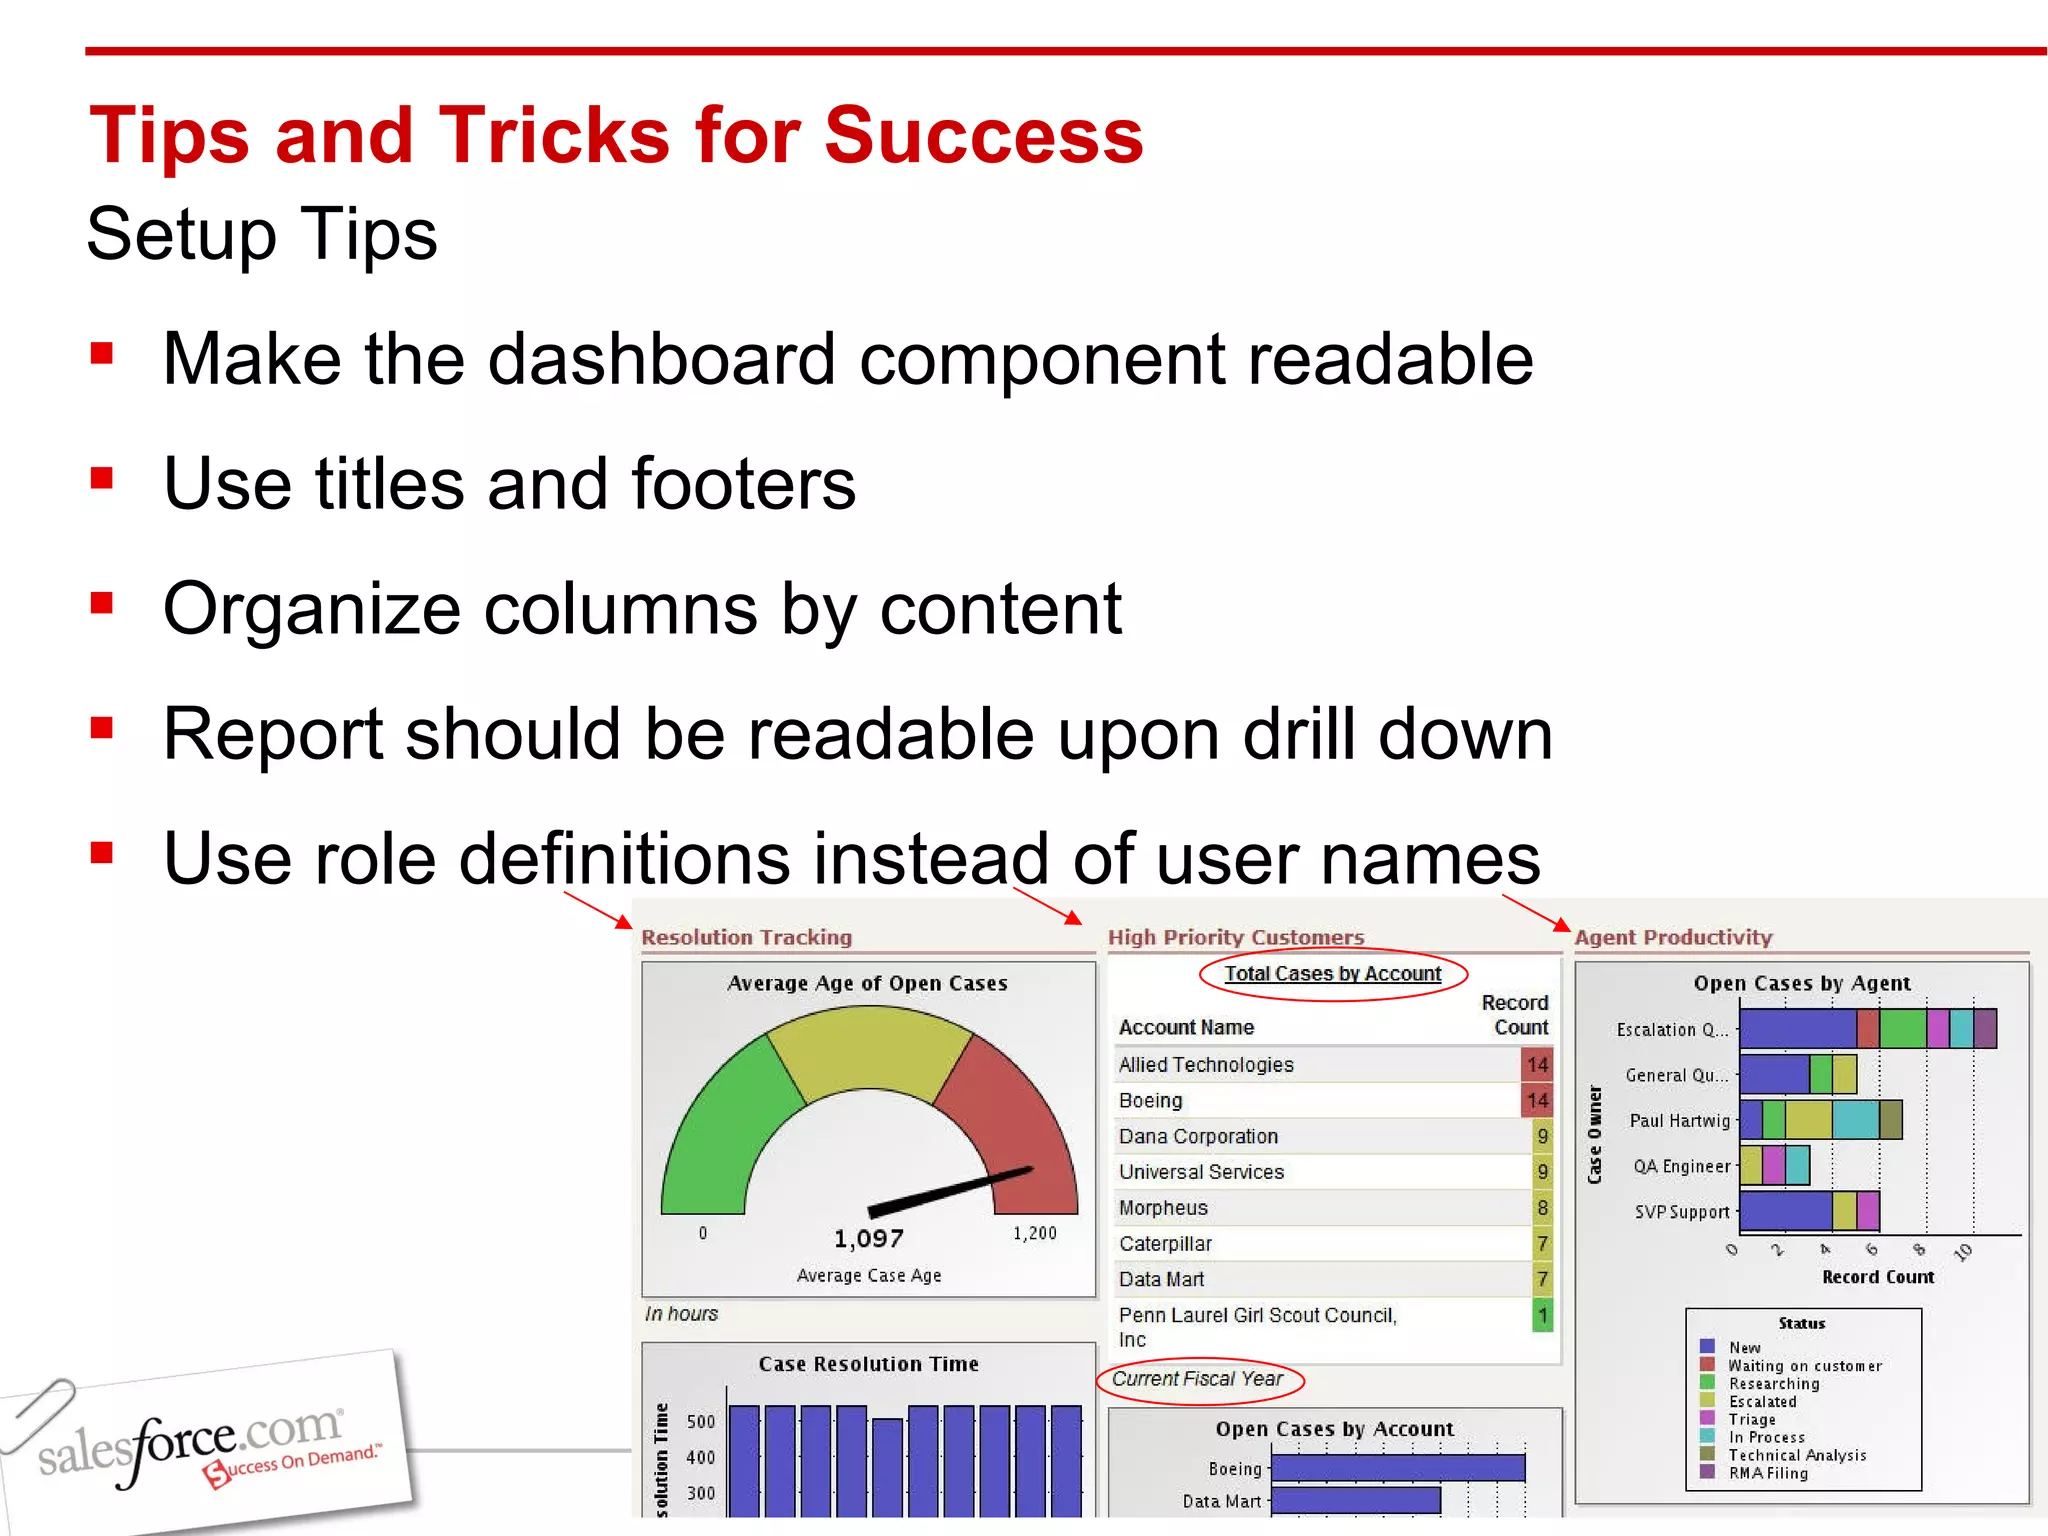

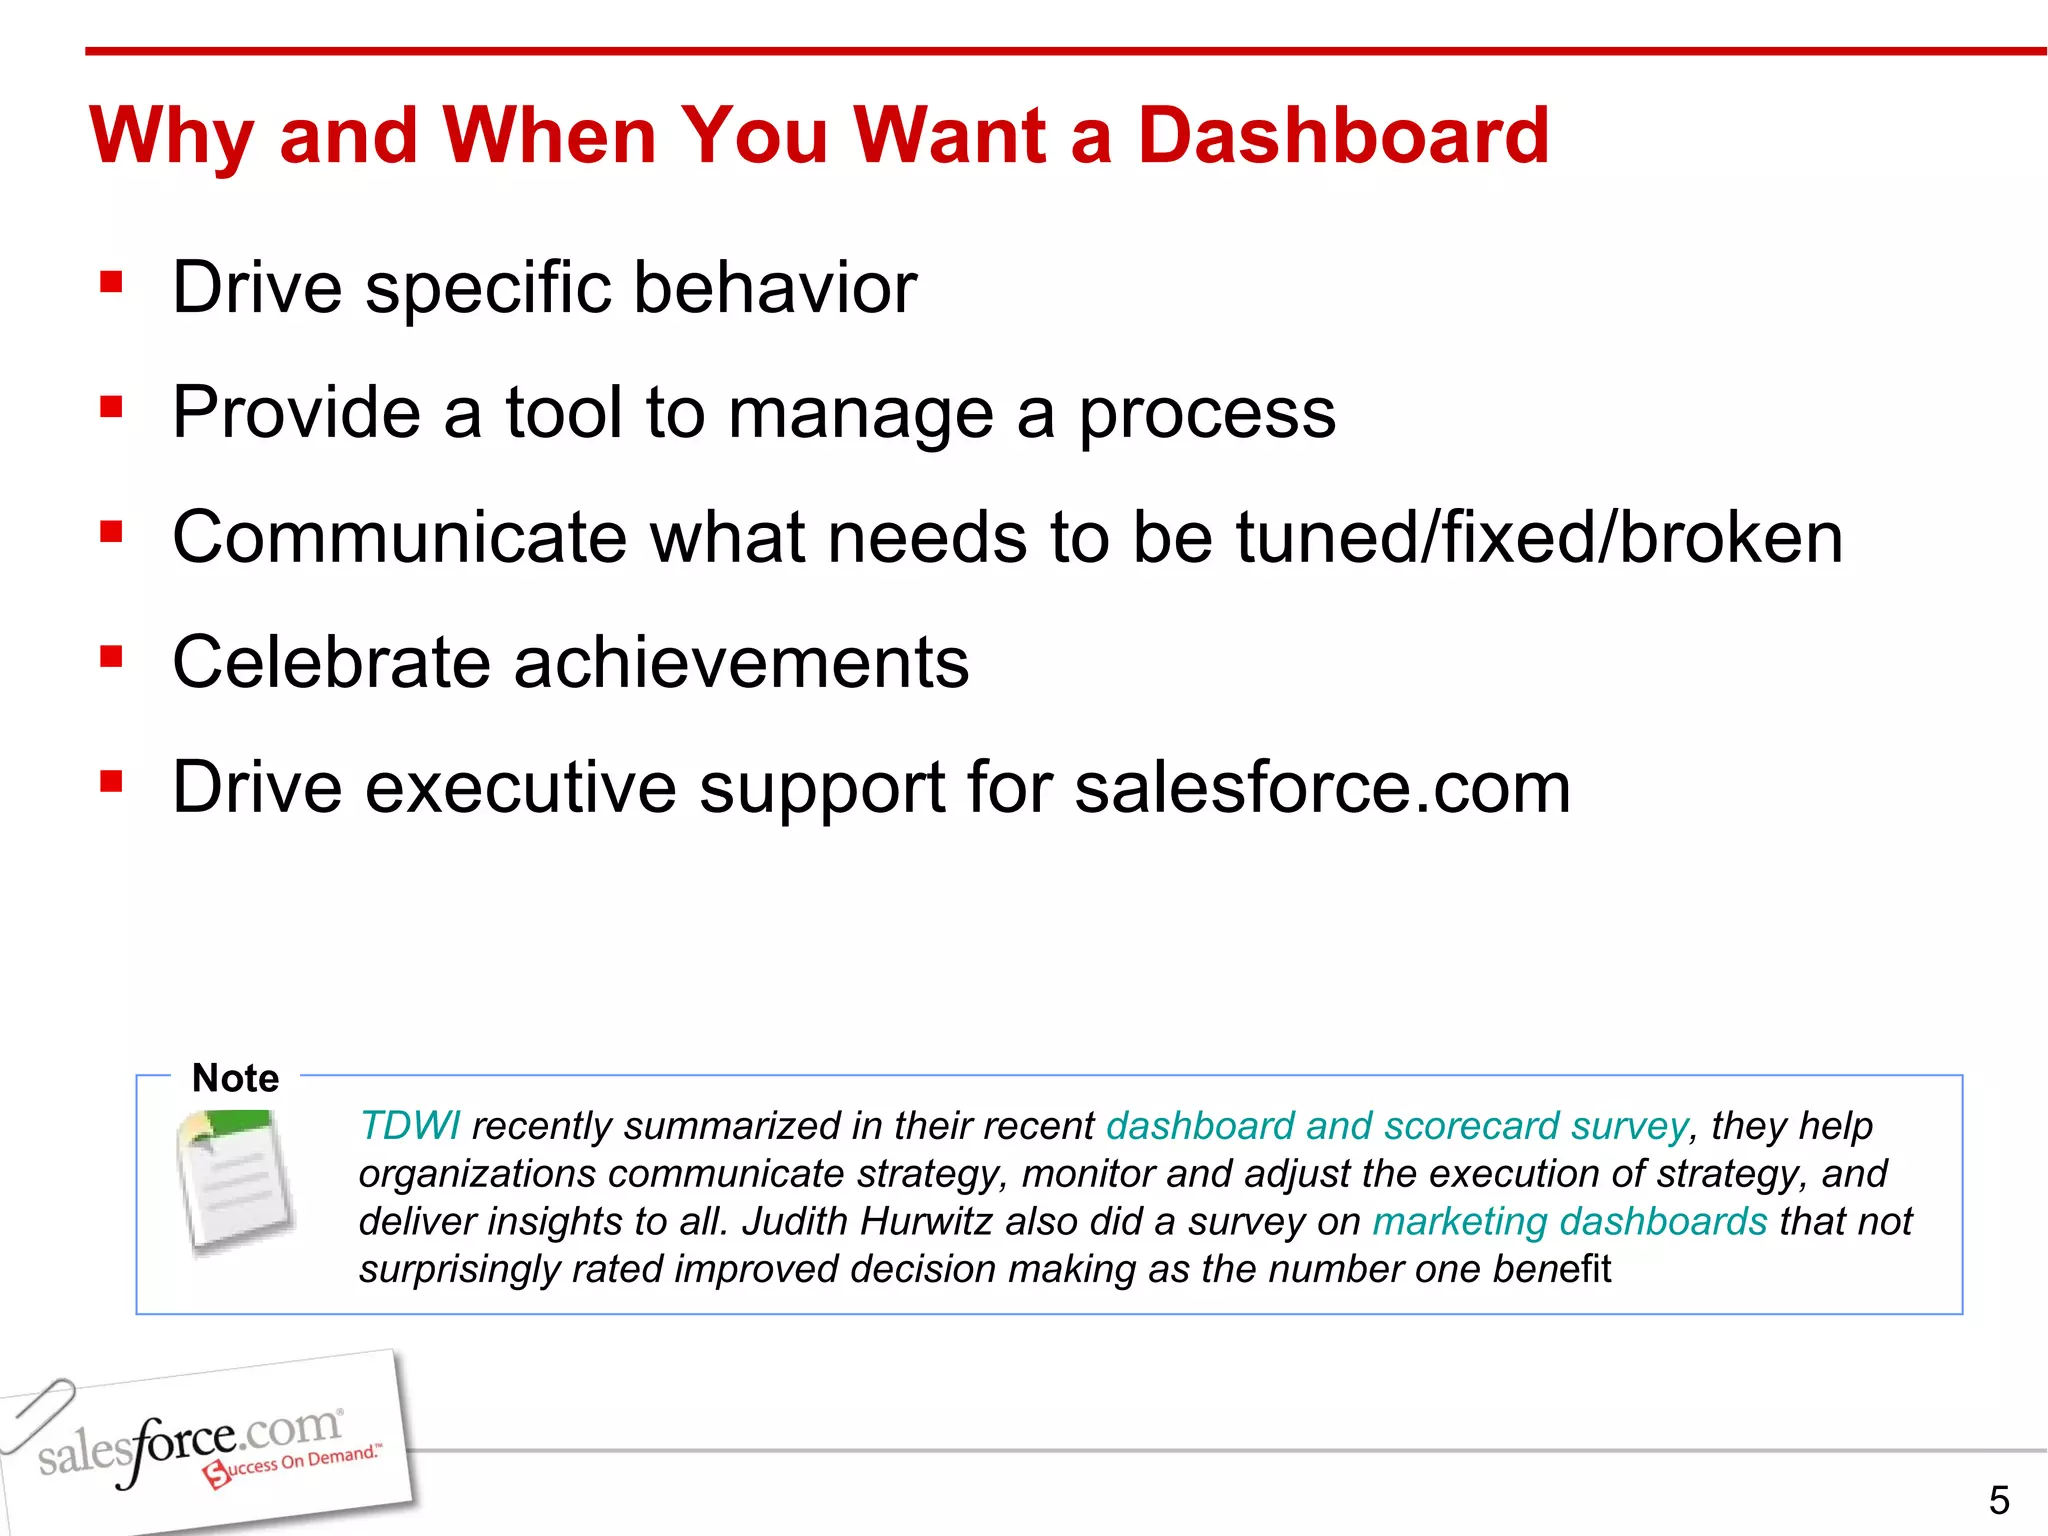
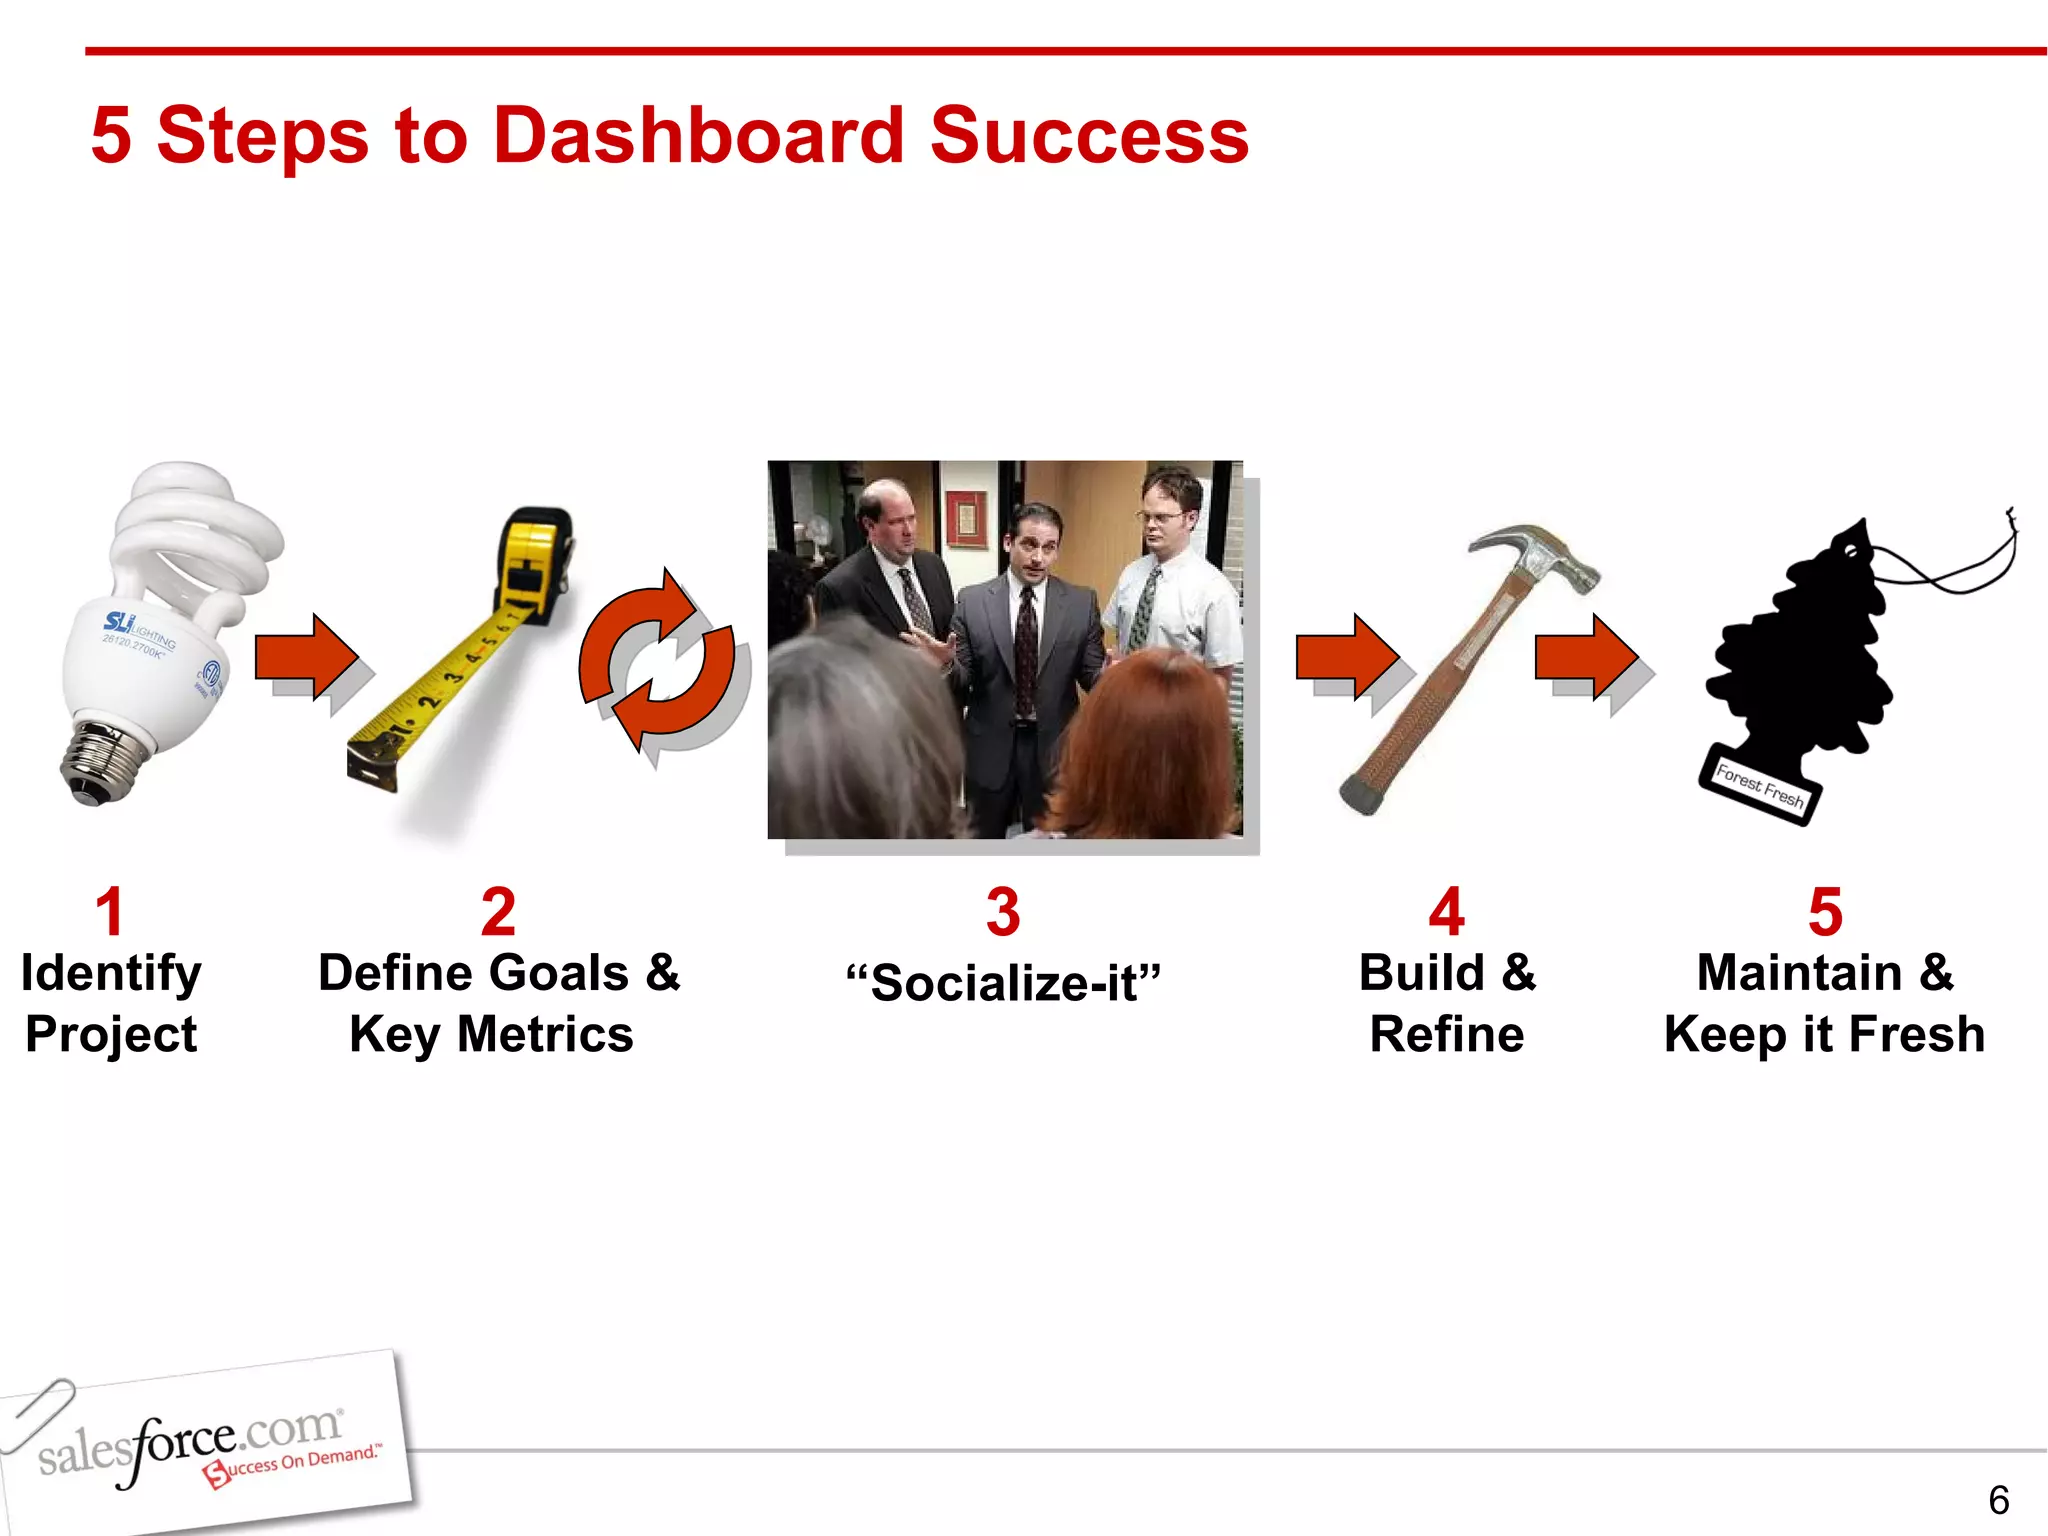
The document discusses lessons learned from dashboard experts at salesforce.com on creating effective dashboards. It outlines a 5 step process for dashboard success: 1) identify the project, 2) define goals and key metrics, 3) socialize the dashboard concept, 4) build and refine the dashboard, and 5) maintain and keep the dashboard fresh. Tips are provided around visualization techniques, maintenance best practices, and gaining stakeholder buy-in for dashboard initiatives. A case study of a client's implementation highlights benefits like improved visibility, productivity, and decision making.


![[DF2U] Deep Dive into Salesforce.com Reporting, Analytics, and Dashboard](https://cdn.slidesharecdn.com/ss_thumbnails/df2uboreporting-110331070335-phpapp02-thumbnail.jpg?width=640&height=640&fit=bounds)