Downloaded 170 times

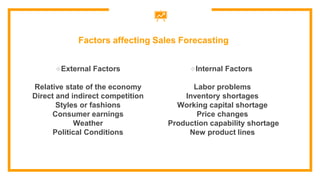
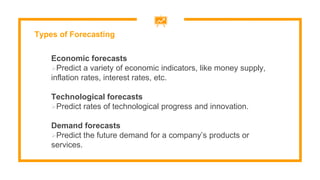
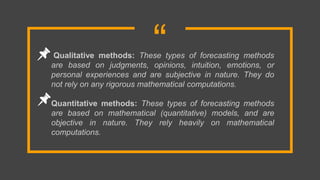
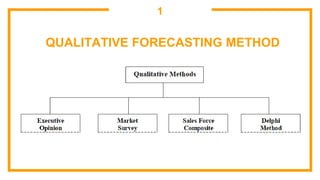
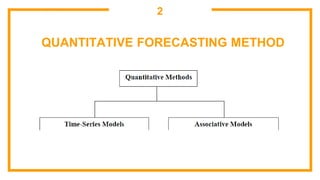


This document discusses sales forecasting. It begins by defining sales forecasting as projecting expected customer demand for products or services under certain assumptions. Forecasting can be used for strategic planning, finance, marketing, and production. The document then lists some principles of forecasting, noting that forecasts are rarely perfect and more accurate for shorter time periods and grouped data. It discusses internal and external factors that can affect forecasts. The rest of the document outlines different types of forecasting methods, including qualitative methods based on judgments and quantitative methods based on mathematical models. It provides examples of various qualitative and quantitative forecasting methods.


![Product1 [3] forecasting v2](https://cdn.slidesharecdn.com/ss_thumbnails/product13-forecastingv2-190226041012-thumbnail.jpg?width=640&height=640&fit=bounds)