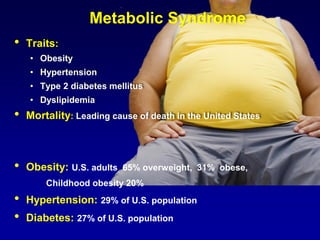
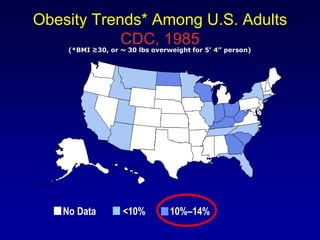
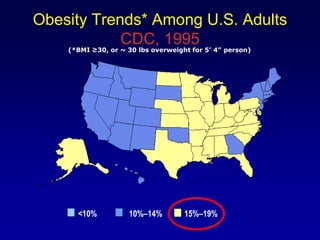
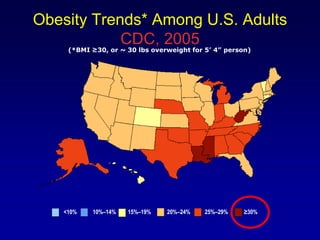
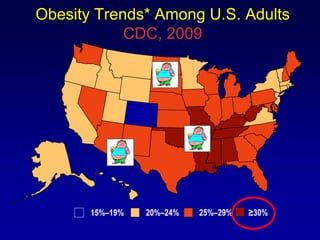
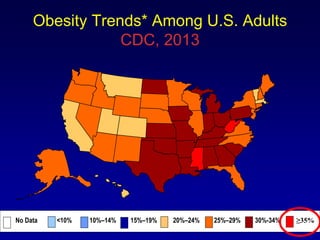
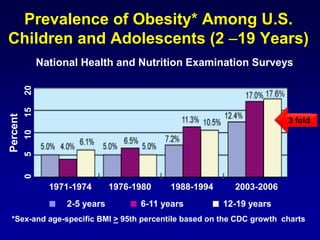
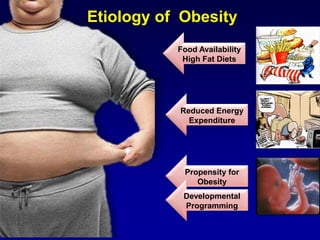
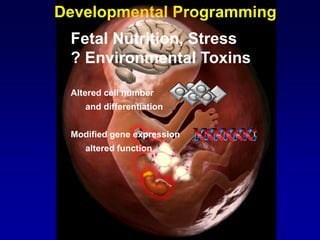
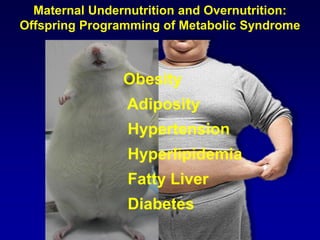
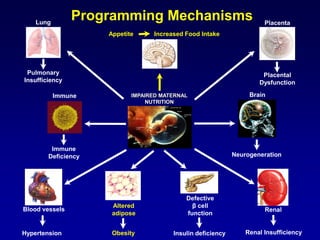
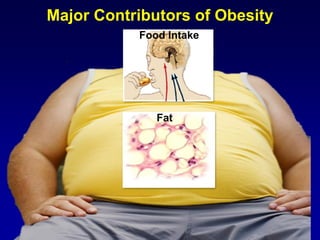
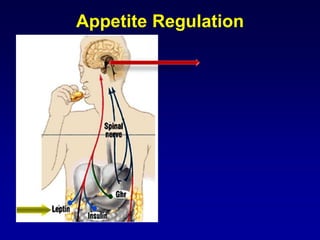
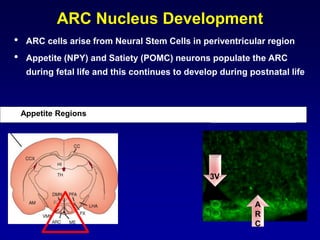
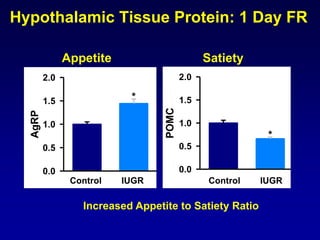
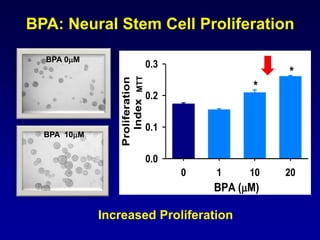
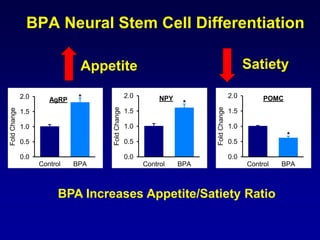
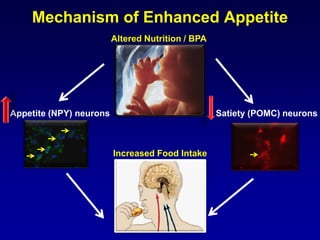
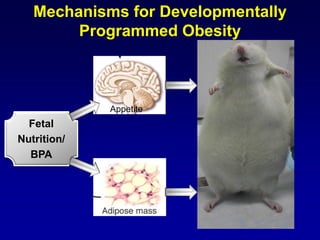
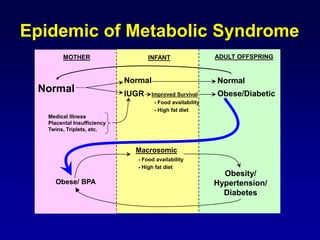
Perinatal Origins of
Childhood and Adult Obesity
Michael G. Ross, M.D., M.P.H.
Mina Desai, Ph.D.
Department of Obstetrics & Gynecology
Harbor-UCLA Medical Center
Metabolic Syndrome
• Traits:
• Obesity
• Hypertension
• Type 2 diabetes mellitus
• Dyslipidemia
• Mortality: Leading cause of death in the United States
• Obesity: U.S. adults 65% overweight, 31% obese,
Childhood obesity 20%
• Hypertension: 29% of U.S. population
• Diabetes: 27% of U.S. population
Obesity Trends* Among U.S. Adults
CDC, 1985
(*BMI ≥30, or ~ 30 lbs overweight for 5’ 4” person)
No Data <10% 10%–14%
Obesity Trends* Among U.S. Adults
CDC, 1995
(*BMI ≥30, or ~ 30 lbs overweight for 5’ 4” person)
<10% 10%–14% 15%–19%
Obesity Trends* Among U.S. Adults
CDC, 2005
(*BMI ≥30, or ~ 30 lbs overweight for 5’ 4” person)
<10% 10%–14% 15%–19% 20%–24% 25%–29% ≥30%
Obesity Trends* Among U.S. Adults
CDC, 2009
15%–19% 20%–24% 25%–29% ≥30%
Obesity Trends* Among U.S. Adults
CDC, 2013
No Data <10% 10%–14% 15%–19% 20%–24% 25%–29% 30%-34% ≥35%
Prevalence of Obesity* Among U.S.
Children and Adolescents (2 –19 Years)
05101520
Percent
1971-1974 1976-1980 1988-1994 2003-2006
National Health and Nutrition Examination Surveys
*Sex-and age-specific BMI > 95th percentile based on the CDC growth charts
■ 2-5 years ■ 6-11 years ■ 12-19 years
3 fold
Etiology of Obesity
Food Availability
High Fat Diets
Reduced Energy
Expenditure
Propensity for
Obesity
Developmental
Programming
Developmental Programming
Altered cell number
and differentiation
Modified gene expression
altered function
Fetal Nutrition, Stress
? Environmental Toxins
Programming vs. Mutations
Genetic mutations: Long epochs,
irreversible
Programmed phenotypes: Respond to
acute environmental stresses
Environmental Stresses on Survival
Drought and Famine
•Famine: nutrient reduction
Famine/drought during pregnancy
results in low birth weight infants
“Thrifty Phenotype”
Increased food intake, gorging
Efficient metabolism
Reduced energy expenditure
Survival Advantage in an
environment of reduced nutrient
availability
“Thrifty” vs. “Inadvertent Thrifty”
Phenotype
• Intrauterine Growth Restricted Newborns
– Improved Fecundity:
• Maternal medical illness
– Etiologies:
• Substance abuse, cigarette smoking
– Twins and higher order:
• Natural and In Vitro Fertilization
• Enhanced Neonatal Survival: viability 400 g
High fat, high calorie diet
Thrifty Phenotype Obesity
Barker Hypothesis
Developmental Programming
Small for Gestational Age (SGA) and/or
Low Birth Weight (LBW) human newborns
• Paradoxical increased risk of
hypertension, obesity, and diabetes as
adult
Hertfordshire Birth Records
1911-1949
Electronic Medical Record
Birth Weight and Metabolic Syndrome
Prevalence of Metabolic Syndrome according to birth weight in
407 men, aged 65 years, born in Hertfordshire
Birth Weight and Adult Diseases
Epidemiological Studies
 Obesity
 Diabetes
 Cardiovascular Disease
 Hypertension
 Lipids
 Fatty Liver
 Immuno-compromise, Allergies
 Addiction, Substance abuse
The relationship between deciles of birth weight and systolic blood
pressure (SBP) among Swedish males at 18 years old
Nilsson: J Hypertens, Volume 15(12).December 1997.1627–1631
Fig. 1
Birth Weight and Blood Pressure
Ponderal Index and Coronary Heart Disease
395 deaths in 6856 men in Helsinki
Ponderal
index at birth
(kg/m3)
Body mass index at 12 years (kg/m2)
Hazard
ratio
>18 -18 -17 -16
-29
>29
-27
-25
4
3
2
1
0
5
Eriksson JG et al BMJ 2001
Birth Weight and Type 2 Diabetes
1179 Pima Indians aged 201179 Pima Indians aged 20--39 years39 years
McCance DR et al BMJ 1994;308:942-5
0
10
20
30
<2.5 -3.0 -3.5 -4.0 4.0
Birthweight (kg)
Ageadjustedprevalence(68%CI)
Hovi P et al. N Engl J Med 2007;356:2053-2063
Glucose, Insulin Concentrations and the Insulin-Resistance Index
Adults with Very Low Birth Weight (VLBW) versus Adults Born at Term
Birth Weight and Insulin Resistance
Models of Fetal Programming
• Maternal Obesity
• Low Birth Weight
• Environmental Toxins: Bisphenol A
• Phenotype
• Mechanisms of Appetite and Adipose
Programming
Prevalence of Maternal Obesity
◌ ≥ 200 lb
● ≥ 250 lb
□ ≥ 300 lb
■ > 29 kg/m3
In USA women at first prenatal visit
2 fold
Model of Maternal Obesity
High Fat Diet
OFFSPRING
• Litter size: Culled to 4 males and 4 females at birth
• Nursing: All pups nursed by same dams until p21
• Weaning: At p21 to ad Libitum food and water
Body Weight of Male Offspring
1 Day 3 Weeks 6 Months
Mean ± SE; * p < 0.01
Control HF
BodyWeight(g)
0
2
4
6
8
Control HF
BodyWeight(g)
0
20
40
60
80
*
Control HF
BodyWeight(g)
0
300
400
500
600 *
Accelerated Growth During Nursing
Control Mat-OB Control Mat-OB Control Mat-OB
Percentage Body Fat: Male Offspring
3 Weeks 6 Months
Mean ± SE; * p < 0.001
Control HF
BodyFat(%)
0
2
4
6
8
10
12
14
16
*
Control HF
BodyFat(%)
0
5
10
15
20
25
30 *
Early Onset Obesity
Control Mat-OB Control Mat-OB
Plasma Triglycerides: Male Offspring
1 Day 3 Weeks
Mean ± SE; * p < 0.01
Control HF
Triglyceride(mg/dl)
0
40
80
120
160
*
Triglyceride(mg/dl)
0
40
80
120
160
*
Control HF
Hypertriglyceridemia
Control Mat-OB Control Mat-OB
Systolic Blood Pressure
6 Week Obese Males
Control HF
BloodPressure(mmHg)
0
120
130
140
150
160
*
* P < 0.05 vs. Control
Early Onset Hypertension
Control Mat-OB
Glucose, Insulin and GTT
3 Month Obese Males
Time (mins)
BloodGlucose(mg/dl)
0
80
120
160
200
Control
HF
*
*
*
* *
*
0 15 30 60 120 180
Control HF
Glucose(mg/dl)
0
60
80
100
120
140
160
*
Control HF
Insulin(ng/ml)
0.0
0.2
0.4
0.6
0.8
1.0
1.2
1.4
1.6 *
Insulin Resistance
Control Mat-OB
Control Mat-OB
Mat-OB
Low Birth Weight Trends in USA
15
12
9
6
3
1981 1985 1990 1995 2000 2005 2010
+28%
+12%
-1%
All races
White
Hispanic
Black
Change from
1989
+16%
Model of Intrauterine Growth Restriction (IUGR)
Maternal Food Restriction (FR)
OFFSPRING
• Litter size: Culled to 4 males and 4 females at birth
• Nursing: All pups cross-fostered to ad libitum fed Control dams
until p21
• Weaning: At p21 to ad Libitum food and water
Body Weight of Male Offspring
1 Day 3 Weeks 9 Months
Mean ± SE; * p < 0.01 Desai et al, Am J Physiol, 2005
Control FR
BodyWeight(g)
0
2
4
6
8
*
Control FR/AdLib
BodyWeight(g)
0
20
30
40
50
60
*
Control FR/AdLib
BodyWeight(g)
0
500
600
700
800
*
Rapid Catch-up Growth
Control IUGR Control IUGR Control IUGR
% Body Fat of Male Offspring
3 Weeks 9 Months
Mean ± SE; * p < 0.001 Desai et al, Am J Physiol, 2005
Control FR/AdLib
%BodyFat
0
4
8
12
16
Control FR/AdLib
%BodyFat
0
5
10
15
20
25
*
Adult Obesity
Control IUGR Control IUGR
Systolic Blood Pressure
3 Month Obese Adult Males
Control IUGR
BloodPressure
(mmHg)
120
130
140
150
160
*
* P < 0.05 vs. Control
Hypertension
Lipid Profile
9 Month IUGR Obese Adult Males
Mean ± SE; * p < 0.001 Desai et al, Am J Obstet Gynecol, 2007
Hypertriglyceridemia
Control FR/AdLib
Triglyceride(mg/dl)
0
40
60
80
100
120
*
Control FR/AdLibCholesterol(mg/dl)
0
60
80
100
Triglyceride Cholesterol
Control IUGR Control IUGR
Glucose, Insulin and GTT
9 Month IUGR Adult Males
Time (mins)
0 30 60 90 120 150 180 210Glucose(mg/dl)
0
80
120
160
200
240
*
* *
*
*
*
Control
FR/AdLib
Desai et al, Am J Obstet Gynecol, 2007
Insulin Resistance
Control FR/AdLib
Glucose(mg/dl)
0
80
90
100
110
120
*
Control FR/AdLib
Insulin(ng/ml)
0.0
0.2
0.4
0.6
0.8
1.0
*
Control IUGR
Control IUGR
IUGR
Maternal Undernutrition and Overnutrition:
Offspring Programming of Metabolic Syndrome
Obesity
Adiposity
Hypertension
Hyperlipidemia
Fatty Liver
Diabetes
Non-alcoholic
fatty liver
disease
Increased fat
storage
Reduced satiety
FAT
FAT
FAT
FAT
FAT
Double Hit: High Fat Diet
Postnatal High Fat Diet
Body Composition: Controls and IUGR
* vs Control; # vs High Fat Diet
Control FR/AdLib
BodyWeight(g)
0
500
600
700
800
900
*
*
#
Control FR/AdLib
%BodyFat 0
10
15
20
25
30
35
*
*
#
#
Normal diet High fat diet
Control IUGRControl IUGR
Bisphenol A (BPA)
NHANES: BPA Levels during Pregnancy
Breast Milk
1.1 ng/ml
Maternal Serum
1 - 2 ng/ml
Placenta
1 – 105 ng/ml
Amniotic Fluid
8.3 – 8.7 ng/ml
Fetal Serum
0.2 – 9.2 ng/ml
Model of Maternal Bisphenol A (BPA)
OFFSPRING
• Litter size: Culled to 4 males and 4 females at birth
• Nursing: All pups nursed by same dams until p21
• Weaning: At p21 to ad libitum food and BPA-free water
Maternal BPA: Birth Weight at 1 Day
SYSBP_MSYSBP_M
Control BPA
BodyWight(g)
0
2
4
6
8
Control BPA
MALES FEMALES
Normal Birth Weight
Offspring Body Composition at 3 Weeks
0
5
10
15
MALES FEMALES
FatMass(g)
0
20
40
60
80
100
MALES FEMALES
TotalMass(g)
* * * *
Control BPA
Offspring Body Composition at 6 months
0
20
40
60
80
100
MALES FEMALES
FatMass(g)
0
200
400
600
MALES FEMALES
TotalMass(g)
0
5
10
15
20
MALES FEMALES
Fat(%)
*
*
Increased Body Fat
in Males
*
Control BPA
Programming Mechanisms
Appetite Increased Food Intake
IMPAIRED MATERNAL
NUTRITION
Altered
adipose
Obesity
Defective
β cell
function
Insulin deficiency
Renal
Renal InsufficiencyHypertension
Blood vessels
Lung
Pulmonary
Insufficiency
Placenta
Placental
Dysfunction
Immune
Immune
Deficiency
Brain
Neurogeneration
Major Contributors of Obesity
Food Intake
Fat
“Appetite Efficiency”
Time Spent Eating vs. Obesity Rate
Mechanism of Obesity
Weekly food intake; Mean ± SE
Age (weeks)
4 5 6 7 8 9 10 11 12
FoodIntake(g/day)
10
15
20
25
30
35
40
*
*
*
* *
* *
Control
HF
Age (weeks)
4 5 6 7 8 9 10 11 12
FoodIntake(g)
10
15
20
25
30
35
40
*
*
*
*
*
* * *
Control
FR
Under-Nutrition Over-Nutrition
Increased Food Intake
IUGR Mat-Ob
PVN
ARC POMC
NPY
Appetite Regulation
ARC Nucleus Development
• ARC cells arise from Neural Stem Cells in periventricular region
• Appetite (NPY) and Satiety (POMC) neurons populate the ARC
during fetal life and this continues to develop during postnatal life
Appetite Regions Neural Stem Cells
3V
A
R
C
In Vivo Neural Stem Cell Migration
1 Day Newborn Hypothalamus
3V = Third Ventricle
Control IUGR
MigrationRate(BrdUCells)
0
20
40
60
80
100
120
*
3V
Nestin = marker of NSC
BrdU = proliferation
* P < 0.01
Control
IUGR
Hypothalamic Neurospheres
Undifferentiated
Early Differentiation
Hypothalamic NSC Proliferation
Control IUGR
Control IUGR
Foldchange
0.0
0.2
0.4
0.6
0.8
1.0
1.2
*
Nestin
Decreased Proliferation
Control IUGR
Foldchange
0.0
0.2
0.4
0.6
0.8
1.0
1.2
*
Proliferation Index
Hypothalamic NSC Differentiation
Neuron Astrocyte
Decreased Differentiation
Control IUGR
FoldChange
0.0
0.2
0.4
0.6
0.8
1.0
1.2
*
Tuj1
Control IUGR
FoldChange
0.0
0.2
0.4
0.6
0.8
1.0
1.2
*
GFAP
Differentiated Neural Stem Cell
NPY Neurons
NPYCells(%pertotalcells)
0
2
4
6
8
*
Control IUGR
Control IUGR
* P < 0.05 vs. Control
Increased NPY
(appetite neurons)
Hypothalamic Tissue Protein: 1 Day FR
Appetite Satiety
Control SGA
POMC 0.0
0.5
1.0
1.5
2.0
*
Increased Appetite to Satiety Ratio
DNMT1
Control SGA
AgRP
0.0
0.5
1.0
1.5
2.0
*
Control IUGR Control IUGR
BPA: Neural Stem Cell Proliferation
BPA (M)
0 1 10 20
Proliferation
Index
0.0
0.1
0.2
0.3
*
*
BPA 0M
BPA 10M
Increased Proliferation
MTT
BPA Neural Stem Cell Differentiation
Control BPA
FoldChange
0.0
0.5
1.0
1.5
2.0 *AgRP
Control BPA
FoldChange
0.0
0.5
1.0
1.5
2.0
*
NPY
Control BPA
FoldChange
0.0
0.5
1.0
1.5
2.0
*
POMC
BPA Increases Appetite/Satiety Ratio
Appetite Satiety
Mechanism of Enhanced Appetite
Appetite (NPY) neurons Satiety (POMC) neurons
Increased Food Intake
Altered Nutrition / BPA
What Programs Adiposity ?
• Adipose Proliferation and Differentiation
• Lipogenesis
Adipogenesis
Preadipocyte
Mature
Adipocytes
Differentiation
Increased Number
of Preadipocytes
Proliferation
Hypertrophy
Lipid filled
Adipocytes
Pref1
PPARg
C/EBPa
SREBP1
Primary Cell Culture
• Adipose tissue from 1 day old offspring
• Preadipocytes
• Adipocyte
Control IUGR
Preadipocytes from 1 Day Newborn
Proliferation
CONTROL
IUGR
ProliferationIndex
0.0
0.2
0.4
0.6
0.8
1.0
*
*
*
*
*
*
c
c
c
c
Insulin (g/ml)
0 5 20 40
Control IUGR
Adipocytes from 1 Day Newborn
Lipid Storage
CONTROL
IUGR
Oil Red Stain; x10
O-R-OAbsorbance
0.0
0.1
0.2
0.3
*
*
*
* *
*
c
c
c
c
Insulin (g/ml)
0 5 20 40
Control IUGR
BPA: Preadipocytes
Control BPA (10g)
BPA (M)
ProliferativeIndex
0.0
0.2
0.4
0.6
0.8
0 1 10 20
*
* *
Adipogenesis Lipogenesis
Increased Proliferation and Lipid Storage
Mechanisms for Developmentally
Programmed Obesity
Appetite
Fetal
Nutrition/
BPA
IUGR NSC
HES1
SIRT1 Mash1
-
HES1
Ngn3
Low
Energy
Hes1 gene
Ac
Mash1/Ngn3 genes
POMC
NPY
-
-
+
NSC
Proliferation
renewal
Neural Stem Cell Programming:
Epigenetic Regulation
Adipose Stem Cells:
Epigenetic Regulation
MOTHER INFANT ADULT OFFSPRING
Normal
Normal Normal
Medical Illness
Placental Insufficiency
Twins, Triplets, etc.
IUGR Improved Survival
- Food availability
- High fat diet
Obese/Diabetic
Obese/ BPA
Macrosomic
- Food availability
- High fat diet
Obesity/
Hypertension/
Diabetes
Epidemic of Metabolic Syndrome
Journals.cambridge.org/DOH
Ross 5-7-15

Ross 5-7-15

  • 1.
    Perinatal Origins of Childhoodand Adult Obesity Michael G. Ross, M.D., M.P.H. Mina Desai, Ph.D. Department of Obstetrics & Gynecology Harbor-UCLA Medical Center
  • 2.
    Metabolic Syndrome • Traits: •Obesity • Hypertension • Type 2 diabetes mellitus • Dyslipidemia • Mortality: Leading cause of death in the United States • Obesity: U.S. adults 65% overweight, 31% obese, Childhood obesity 20% • Hypertension: 29% of U.S. population • Diabetes: 27% of U.S. population
  • 3.
    Obesity Trends* AmongU.S. Adults CDC, 1985 (*BMI ≥30, or ~ 30 lbs overweight for 5’ 4” person) No Data <10% 10%–14%
  • 4.
    Obesity Trends* AmongU.S. Adults CDC, 1995 (*BMI ≥30, or ~ 30 lbs overweight for 5’ 4” person) <10% 10%–14% 15%–19%
  • 5.
    Obesity Trends* AmongU.S. Adults CDC, 2005 (*BMI ≥30, or ~ 30 lbs overweight for 5’ 4” person) <10% 10%–14% 15%–19% 20%–24% 25%–29% ≥30%
  • 6.
    Obesity Trends* AmongU.S. Adults CDC, 2009 15%–19% 20%–24% 25%–29% ≥30%
  • 7.
    Obesity Trends* AmongU.S. Adults CDC, 2013 No Data <10% 10%–14% 15%–19% 20%–24% 25%–29% 30%-34% ≥35%
  • 8.
    Prevalence of Obesity*Among U.S. Children and Adolescents (2 –19 Years) 05101520 Percent 1971-1974 1976-1980 1988-1994 2003-2006 National Health and Nutrition Examination Surveys *Sex-and age-specific BMI > 95th percentile based on the CDC growth charts ■ 2-5 years ■ 6-11 years ■ 12-19 years 3 fold
  • 9.
    Etiology of Obesity FoodAvailability High Fat Diets Reduced Energy Expenditure Propensity for Obesity Developmental Programming
  • 10.
    Developmental Programming Altered cellnumber and differentiation Modified gene expression altered function Fetal Nutrition, Stress ? Environmental Toxins
  • 11.
    Programming vs. Mutations Geneticmutations: Long epochs, irreversible Programmed phenotypes: Respond to acute environmental stresses
  • 12.
    Environmental Stresses onSurvival Drought and Famine •Famine: nutrient reduction Famine/drought during pregnancy results in low birth weight infants “Thrifty Phenotype” Increased food intake, gorging Efficient metabolism Reduced energy expenditure Survival Advantage in an environment of reduced nutrient availability
  • 13.
    “Thrifty” vs. “InadvertentThrifty” Phenotype • Intrauterine Growth Restricted Newborns – Improved Fecundity: • Maternal medical illness – Etiologies: • Substance abuse, cigarette smoking – Twins and higher order: • Natural and In Vitro Fertilization • Enhanced Neonatal Survival: viability 400 g
  • 14.
    High fat, highcalorie diet Thrifty Phenotype Obesity
  • 15.
    Barker Hypothesis Developmental Programming Smallfor Gestational Age (SGA) and/or Low Birth Weight (LBW) human newborns • Paradoxical increased risk of hypertension, obesity, and diabetes as adult
  • 16.
  • 17.
  • 18.
    Birth Weight andMetabolic Syndrome Prevalence of Metabolic Syndrome according to birth weight in 407 men, aged 65 years, born in Hertfordshire
  • 19.
    Birth Weight andAdult Diseases Epidemiological Studies  Obesity  Diabetes  Cardiovascular Disease  Hypertension  Lipids  Fatty Liver  Immuno-compromise, Allergies  Addiction, Substance abuse
  • 20.
    The relationship betweendeciles of birth weight and systolic blood pressure (SBP) among Swedish males at 18 years old Nilsson: J Hypertens, Volume 15(12).December 1997.1627–1631 Fig. 1 Birth Weight and Blood Pressure
  • 21.
    Ponderal Index andCoronary Heart Disease 395 deaths in 6856 men in Helsinki Ponderal index at birth (kg/m3) Body mass index at 12 years (kg/m2) Hazard ratio >18 -18 -17 -16 -29 >29 -27 -25 4 3 2 1 0 5 Eriksson JG et al BMJ 2001
  • 22.
    Birth Weight andType 2 Diabetes 1179 Pima Indians aged 201179 Pima Indians aged 20--39 years39 years McCance DR et al BMJ 1994;308:942-5 0 10 20 30 <2.5 -3.0 -3.5 -4.0 4.0 Birthweight (kg) Ageadjustedprevalence(68%CI)
  • 23.
    Hovi P etal. N Engl J Med 2007;356:2053-2063 Glucose, Insulin Concentrations and the Insulin-Resistance Index Adults with Very Low Birth Weight (VLBW) versus Adults Born at Term Birth Weight and Insulin Resistance
  • 24.
    Models of FetalProgramming • Maternal Obesity • Low Birth Weight • Environmental Toxins: Bisphenol A • Phenotype • Mechanisms of Appetite and Adipose Programming
  • 25.
    Prevalence of MaternalObesity ◌ ≥ 200 lb ● ≥ 250 lb □ ≥ 300 lb ■ > 29 kg/m3 In USA women at first prenatal visit 2 fold
  • 26.
    Model of MaternalObesity High Fat Diet OFFSPRING • Litter size: Culled to 4 males and 4 females at birth • Nursing: All pups nursed by same dams until p21 • Weaning: At p21 to ad Libitum food and water
  • 27.
    Body Weight ofMale Offspring 1 Day 3 Weeks 6 Months Mean ± SE; * p < 0.01 Control HF BodyWeight(g) 0 2 4 6 8 Control HF BodyWeight(g) 0 20 40 60 80 * Control HF BodyWeight(g) 0 300 400 500 600 * Accelerated Growth During Nursing Control Mat-OB Control Mat-OB Control Mat-OB
  • 28.
    Percentage Body Fat:Male Offspring 3 Weeks 6 Months Mean ± SE; * p < 0.001 Control HF BodyFat(%) 0 2 4 6 8 10 12 14 16 * Control HF BodyFat(%) 0 5 10 15 20 25 30 * Early Onset Obesity Control Mat-OB Control Mat-OB
  • 29.
    Plasma Triglycerides: MaleOffspring 1 Day 3 Weeks Mean ± SE; * p < 0.01 Control HF Triglyceride(mg/dl) 0 40 80 120 160 * Triglyceride(mg/dl) 0 40 80 120 160 * Control HF Hypertriglyceridemia Control Mat-OB Control Mat-OB
  • 30.
    Systolic Blood Pressure 6Week Obese Males Control HF BloodPressure(mmHg) 0 120 130 140 150 160 * * P < 0.05 vs. Control Early Onset Hypertension Control Mat-OB
  • 31.
    Glucose, Insulin andGTT 3 Month Obese Males Time (mins) BloodGlucose(mg/dl) 0 80 120 160 200 Control HF * * * * * * 0 15 30 60 120 180 Control HF Glucose(mg/dl) 0 60 80 100 120 140 160 * Control HF Insulin(ng/ml) 0.0 0.2 0.4 0.6 0.8 1.0 1.2 1.4 1.6 * Insulin Resistance Control Mat-OB Control Mat-OB Mat-OB
  • 32.
    Low Birth WeightTrends in USA 15 12 9 6 3 1981 1985 1990 1995 2000 2005 2010 +28% +12% -1% All races White Hispanic Black Change from 1989 +16%
  • 33.
    Model of IntrauterineGrowth Restriction (IUGR) Maternal Food Restriction (FR) OFFSPRING • Litter size: Culled to 4 males and 4 females at birth • Nursing: All pups cross-fostered to ad libitum fed Control dams until p21 • Weaning: At p21 to ad Libitum food and water
  • 34.
    Body Weight ofMale Offspring 1 Day 3 Weeks 9 Months Mean ± SE; * p < 0.01 Desai et al, Am J Physiol, 2005 Control FR BodyWeight(g) 0 2 4 6 8 * Control FR/AdLib BodyWeight(g) 0 20 30 40 50 60 * Control FR/AdLib BodyWeight(g) 0 500 600 700 800 * Rapid Catch-up Growth Control IUGR Control IUGR Control IUGR
  • 35.
    % Body Fatof Male Offspring 3 Weeks 9 Months Mean ± SE; * p < 0.001 Desai et al, Am J Physiol, 2005 Control FR/AdLib %BodyFat 0 4 8 12 16 Control FR/AdLib %BodyFat 0 5 10 15 20 25 * Adult Obesity Control IUGR Control IUGR
  • 36.
    Systolic Blood Pressure 3Month Obese Adult Males Control IUGR BloodPressure (mmHg) 120 130 140 150 160 * * P < 0.05 vs. Control Hypertension
  • 37.
    Lipid Profile 9 MonthIUGR Obese Adult Males Mean ± SE; * p < 0.001 Desai et al, Am J Obstet Gynecol, 2007 Hypertriglyceridemia Control FR/AdLib Triglyceride(mg/dl) 0 40 60 80 100 120 * Control FR/AdLibCholesterol(mg/dl) 0 60 80 100 Triglyceride Cholesterol Control IUGR Control IUGR
  • 38.
    Glucose, Insulin andGTT 9 Month IUGR Adult Males Time (mins) 0 30 60 90 120 150 180 210Glucose(mg/dl) 0 80 120 160 200 240 * * * * * * Control FR/AdLib Desai et al, Am J Obstet Gynecol, 2007 Insulin Resistance Control FR/AdLib Glucose(mg/dl) 0 80 90 100 110 120 * Control FR/AdLib Insulin(ng/ml) 0.0 0.2 0.4 0.6 0.8 1.0 * Control IUGR Control IUGR IUGR
  • 39.
    Maternal Undernutrition andOvernutrition: Offspring Programming of Metabolic Syndrome Obesity Adiposity Hypertension Hyperlipidemia Fatty Liver Diabetes
  • 40.
    Non-alcoholic fatty liver disease Increased fat storage Reducedsatiety FAT FAT FAT FAT FAT Double Hit: High Fat Diet
  • 41.
    Postnatal High FatDiet Body Composition: Controls and IUGR * vs Control; # vs High Fat Diet Control FR/AdLib BodyWeight(g) 0 500 600 700 800 900 * * # Control FR/AdLib %BodyFat 0 10 15 20 25 30 35 * * # # Normal diet High fat diet Control IUGRControl IUGR
  • 42.
  • 43.
    NHANES: BPA Levelsduring Pregnancy Breast Milk 1.1 ng/ml Maternal Serum 1 - 2 ng/ml Placenta 1 – 105 ng/ml Amniotic Fluid 8.3 – 8.7 ng/ml Fetal Serum 0.2 – 9.2 ng/ml
  • 44.
    Model of MaternalBisphenol A (BPA) OFFSPRING • Litter size: Culled to 4 males and 4 females at birth • Nursing: All pups nursed by same dams until p21 • Weaning: At p21 to ad libitum food and BPA-free water
  • 45.
    Maternal BPA: BirthWeight at 1 Day SYSBP_MSYSBP_M Control BPA BodyWight(g) 0 2 4 6 8 Control BPA MALES FEMALES Normal Birth Weight
  • 46.
    Offspring Body Compositionat 3 Weeks 0 5 10 15 MALES FEMALES FatMass(g) 0 20 40 60 80 100 MALES FEMALES TotalMass(g) * * * * Control BPA
  • 47.
    Offspring Body Compositionat 6 months 0 20 40 60 80 100 MALES FEMALES FatMass(g) 0 200 400 600 MALES FEMALES TotalMass(g) 0 5 10 15 20 MALES FEMALES Fat(%) * * Increased Body Fat in Males * Control BPA
  • 48.
    Programming Mechanisms Appetite IncreasedFood Intake IMPAIRED MATERNAL NUTRITION Altered adipose Obesity Defective β cell function Insulin deficiency Renal Renal InsufficiencyHypertension Blood vessels Lung Pulmonary Insufficiency Placenta Placental Dysfunction Immune Immune Deficiency Brain Neurogeneration
  • 49.
    Major Contributors ofObesity Food Intake Fat
  • 50.
    “Appetite Efficiency” Time SpentEating vs. Obesity Rate
  • 51.
    Mechanism of Obesity Weeklyfood intake; Mean ± SE Age (weeks) 4 5 6 7 8 9 10 11 12 FoodIntake(g/day) 10 15 20 25 30 35 40 * * * * * * * Control HF Age (weeks) 4 5 6 7 8 9 10 11 12 FoodIntake(g) 10 15 20 25 30 35 40 * * * * * * * * Control FR Under-Nutrition Over-Nutrition Increased Food Intake IUGR Mat-Ob
  • 52.
  • 53.
    ARC Nucleus Development •ARC cells arise from Neural Stem Cells in periventricular region • Appetite (NPY) and Satiety (POMC) neurons populate the ARC during fetal life and this continues to develop during postnatal life Appetite Regions Neural Stem Cells 3V A R C
  • 54.
    In Vivo NeuralStem Cell Migration 1 Day Newborn Hypothalamus 3V = Third Ventricle Control IUGR MigrationRate(BrdUCells) 0 20 40 60 80 100 120 * 3V Nestin = marker of NSC BrdU = proliferation * P < 0.01 Control IUGR
  • 55.
  • 56.
    Hypothalamic NSC Proliferation ControlIUGR Control IUGR Foldchange 0.0 0.2 0.4 0.6 0.8 1.0 1.2 * Nestin Decreased Proliferation Control IUGR Foldchange 0.0 0.2 0.4 0.6 0.8 1.0 1.2 * Proliferation Index
  • 57.
    Hypothalamic NSC Differentiation NeuronAstrocyte Decreased Differentiation Control IUGR FoldChange 0.0 0.2 0.4 0.6 0.8 1.0 1.2 * Tuj1 Control IUGR FoldChange 0.0 0.2 0.4 0.6 0.8 1.0 1.2 * GFAP
  • 58.
    Differentiated Neural StemCell NPY Neurons NPYCells(%pertotalcells) 0 2 4 6 8 * Control IUGR Control IUGR * P < 0.05 vs. Control Increased NPY (appetite neurons)
  • 59.
    Hypothalamic Tissue Protein:1 Day FR Appetite Satiety Control SGA POMC 0.0 0.5 1.0 1.5 2.0 * Increased Appetite to Satiety Ratio DNMT1 Control SGA AgRP 0.0 0.5 1.0 1.5 2.0 * Control IUGR Control IUGR
  • 60.
    BPA: Neural StemCell Proliferation BPA (M) 0 1 10 20 Proliferation Index 0.0 0.1 0.2 0.3 * * BPA 0M BPA 10M Increased Proliferation MTT
  • 61.
    BPA Neural StemCell Differentiation Control BPA FoldChange 0.0 0.5 1.0 1.5 2.0 *AgRP Control BPA FoldChange 0.0 0.5 1.0 1.5 2.0 * NPY Control BPA FoldChange 0.0 0.5 1.0 1.5 2.0 * POMC BPA Increases Appetite/Satiety Ratio Appetite Satiety
  • 62.
    Mechanism of EnhancedAppetite Appetite (NPY) neurons Satiety (POMC) neurons Increased Food Intake Altered Nutrition / BPA
  • 63.
    What Programs Adiposity? • Adipose Proliferation and Differentiation • Lipogenesis
  • 64.
  • 65.
    Primary Cell Culture •Adipose tissue from 1 day old offspring • Preadipocytes • Adipocyte Control IUGR
  • 66.
    Preadipocytes from 1Day Newborn Proliferation CONTROL IUGR ProliferationIndex 0.0 0.2 0.4 0.6 0.8 1.0 * * * * * * c c c c Insulin (g/ml) 0 5 20 40 Control IUGR
  • 67.
    Adipocytes from 1Day Newborn Lipid Storage CONTROL IUGR Oil Red Stain; x10 O-R-OAbsorbance 0.0 0.1 0.2 0.3 * * * * * * c c c c Insulin (g/ml) 0 5 20 40 Control IUGR
  • 68.
    BPA: Preadipocytes Control BPA(10g) BPA (M) ProliferativeIndex 0.0 0.2 0.4 0.6 0.8 0 1 10 20 * * * Adipogenesis Lipogenesis Increased Proliferation and Lipid Storage
  • 69.
    Mechanisms for Developmentally ProgrammedObesity Appetite Fetal Nutrition/ BPA
  • 70.
    IUGR NSC HES1 SIRT1 Mash1 - HES1 Ngn3 Low Energy Hes1gene Ac Mash1/Ngn3 genes POMC NPY - - + NSC Proliferation renewal Neural Stem Cell Programming: Epigenetic Regulation
  • 71.
  • 74.
    MOTHER INFANT ADULTOFFSPRING Normal Normal Normal Medical Illness Placental Insufficiency Twins, Triplets, etc. IUGR Improved Survival - Food availability - High fat diet Obese/Diabetic Obese/ BPA Macrosomic - Food availability - High fat diet Obesity/ Hypertension/ Diabetes Epidemic of Metabolic Syndrome
  • 75.