This document summarizes a presentation on diabetes and obesity given by Dr. Francisco Cervantes. Some key points:
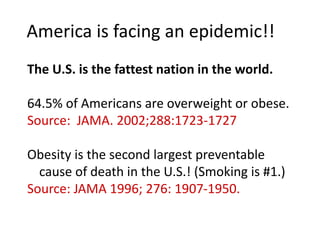
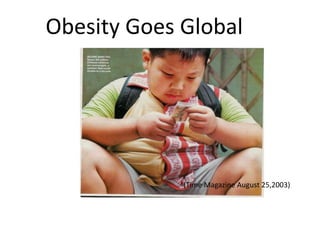
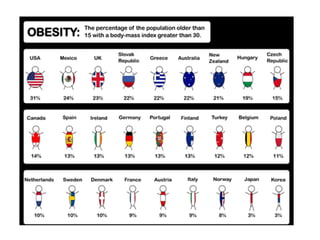
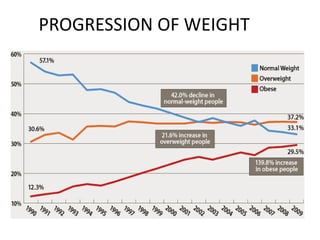
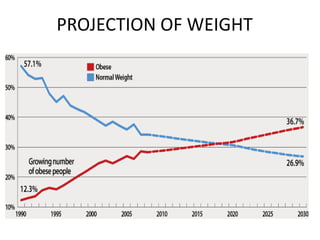
- America is facing an obesity epidemic, with over 60% of Americans overweight or obese. Obesity is the second leading preventable cause of death.
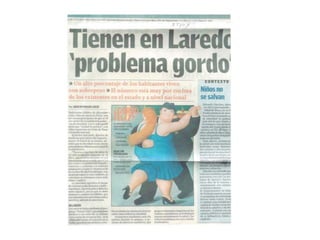
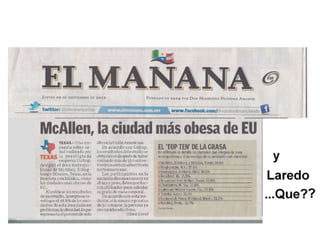
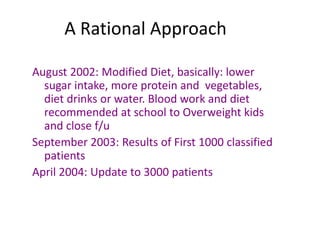
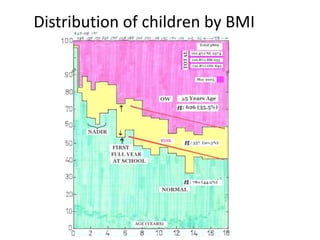
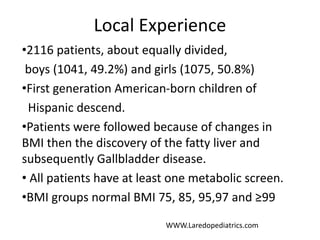
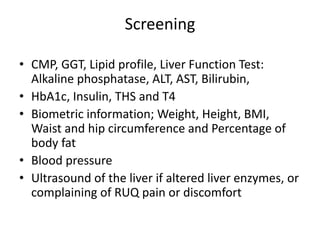
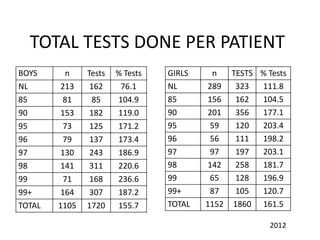
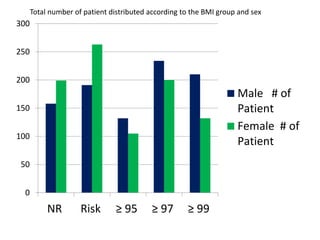
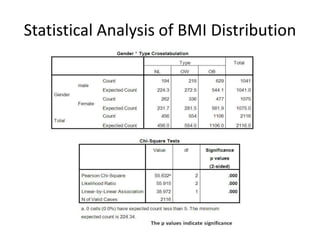
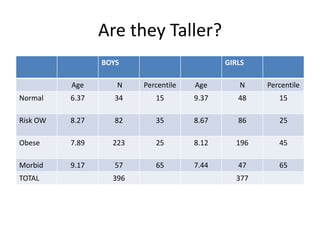
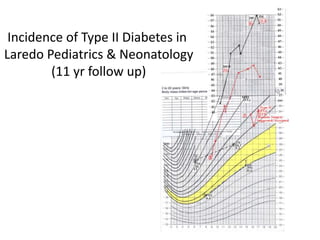
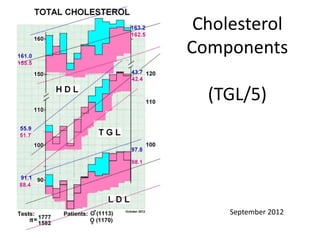
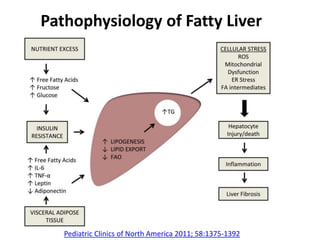
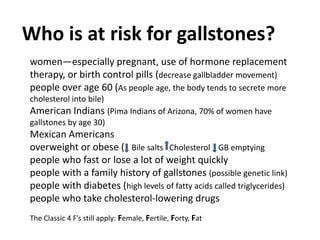
- Dr. Cervantes tracked over 2000 pediatric patients in Laredo, Texas and found high rates of overweight, obesity, and related conditions like fatty liver disease and gallstones.
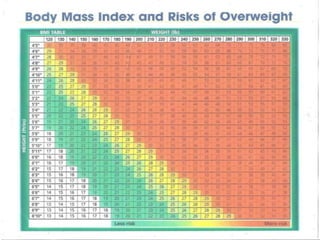
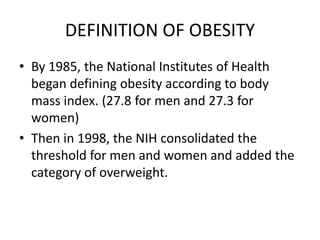
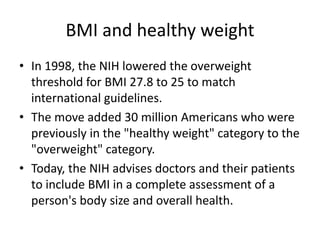
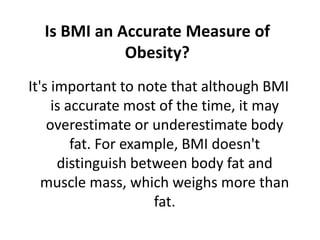
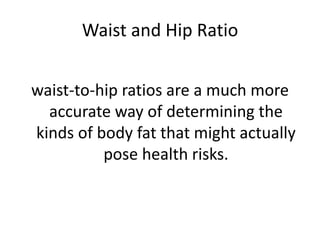
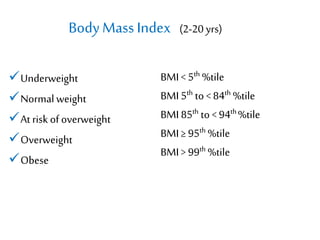
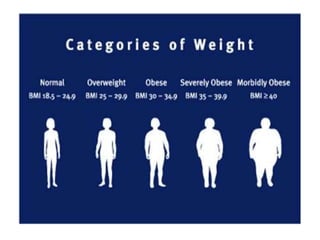
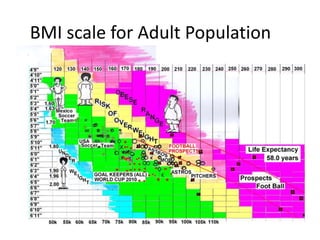
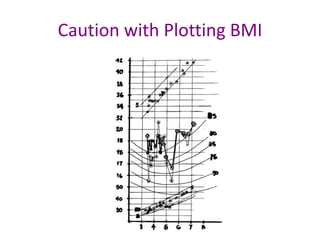
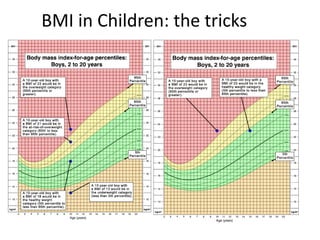
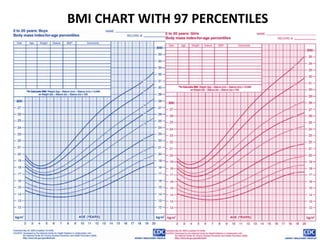
- BMI is a useful screening tool but has limitations. Waist-to-hip ratio and other factors provide more accurate assessment of health risks.
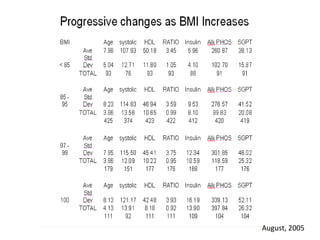
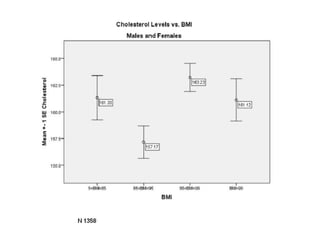
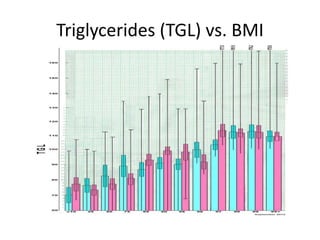
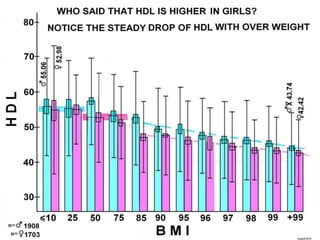
- Overweight and obesity increase risks for conditions like high blood pressure, high cholesterol, diabetes, and non-