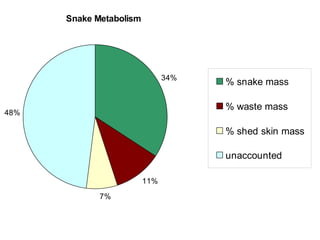
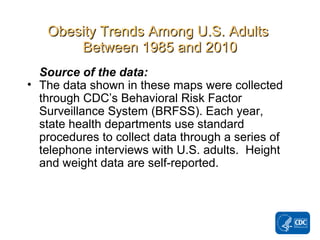
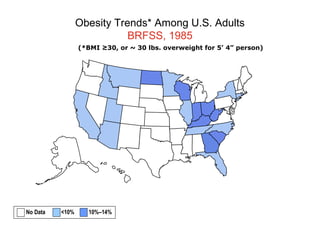
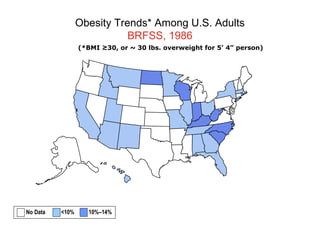
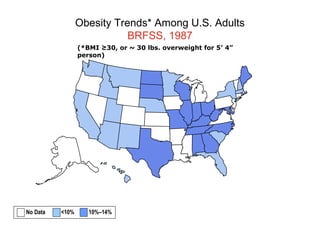
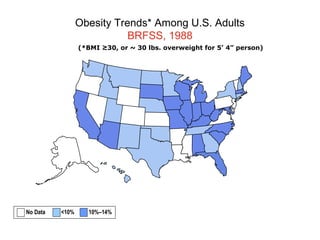
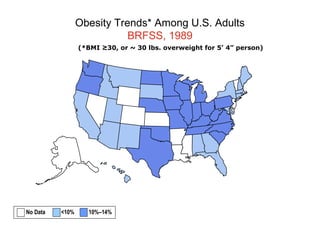
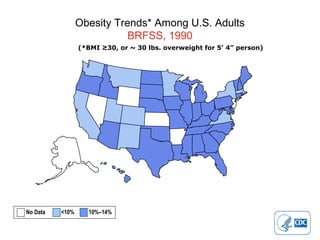
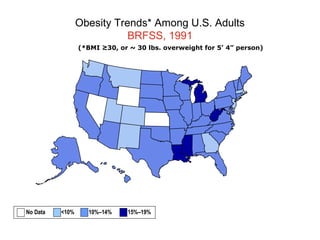
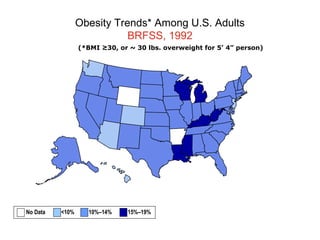
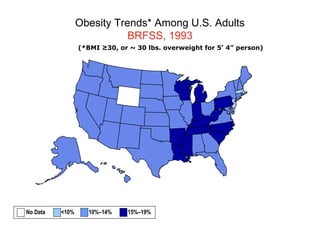
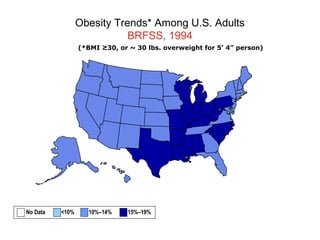
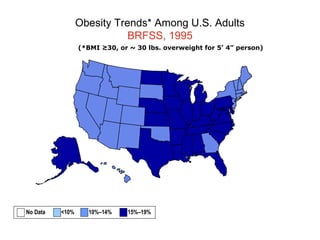
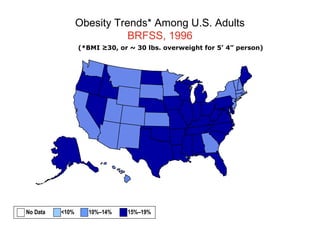
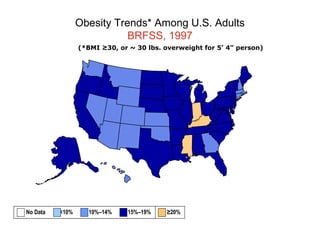
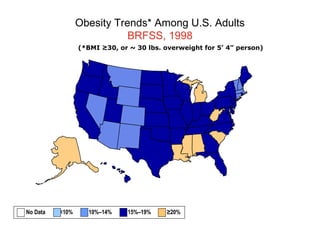
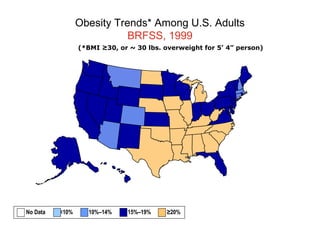
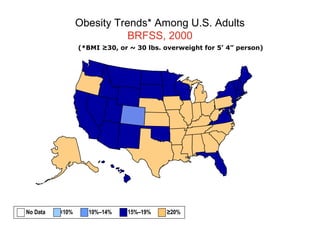
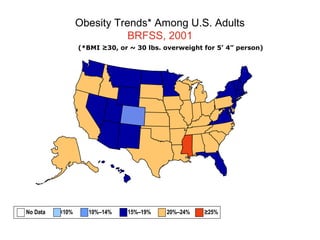
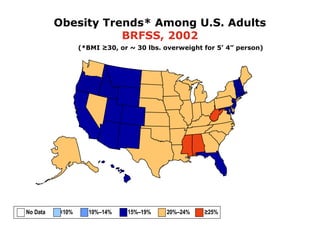
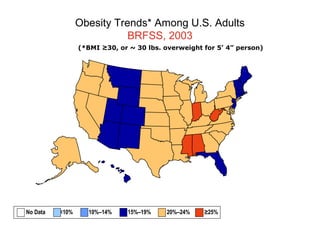
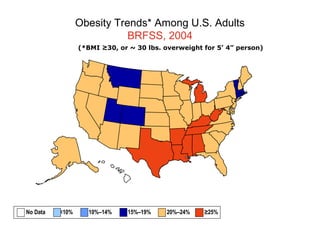
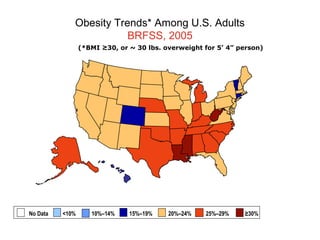
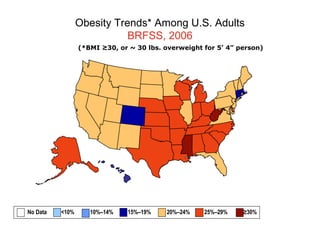
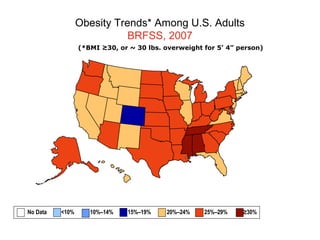
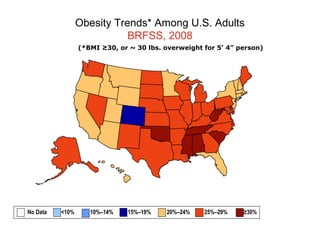
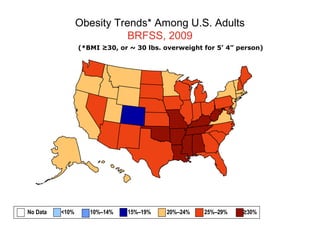
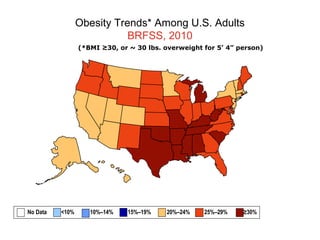
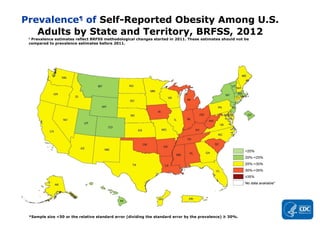
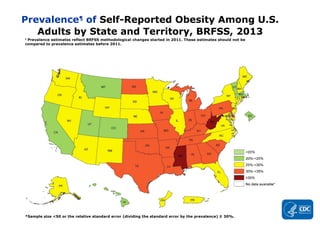
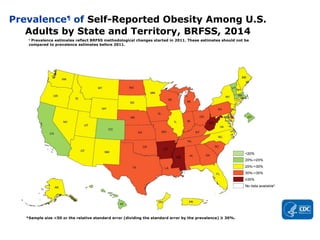
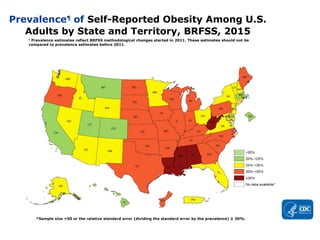
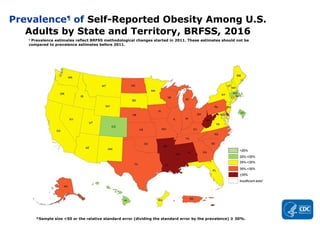
The document discusses metabolism in snakes and trends in obesity among US adults. A snake metabolism study found that 34% of a snake's mass comes from food intake, while 11% is waste, 7% is shed skin, and 48% is unaccounted for. The rest of the document shows maps from 1985 to 2016 tracking rising obesity rates in the US according to the Behavioral Risk Factor Surveillance System, with rates increasing over time and some states having rates over 30% by 2016.


![Figure 10.6-4
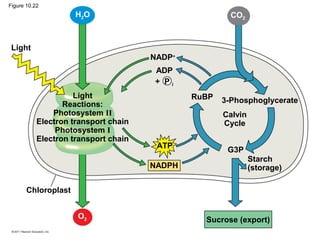
Light
Light
Reactions
Calvin
Cycle
Chloroplast
[CH2O]
(sugar)
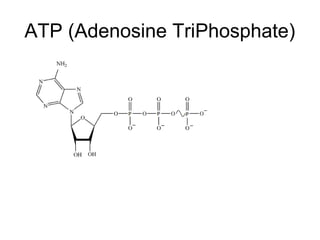
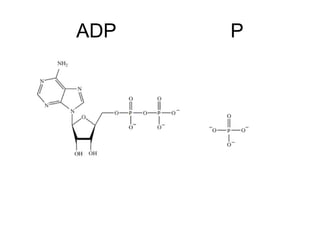
ATP
NADPH
NADP+
ADP
+ P i
H2O CO2
O2](https://image.slidesharecdn.com/metabolism-180124152255/85/Metabolism-67-320.jpg)