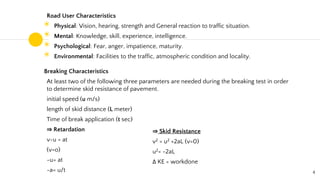
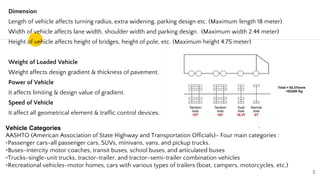
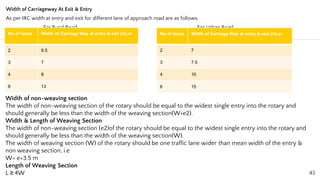
Unit 5: TRAFFIC
ENGINEERING & HIGHWAY
DRAINAGE
by, Ms. Priya Sarita Mane
Content
◉ Traffic Engineering: Fundamentals of traffic flow, Road User and Vehicular
characteristics. Traffic Studies: Volume studies, speed studies, parking
studies, origin-destination studies and accident studies.
◉ Traffic management and Safety: Traffic control devices, channelization,
traffic signal, junctions, intelligent transportation system, Design of Rotary
Intersection and traffic Signal.
◉ Highway drainage- Necessity, surface draining and sub drainage
2
INTRODUCTION
◉ Before highway is opened to traffic, careful thought must be given to conveying to drivers
information concerning its proper use. Such information is given traffic control devices.
◉ Engineer must also recognize that despite their best efforts to promote well-designed traffic
control systems, vehicles will occasionally go out of control and possibly crash. Every effort
must be made to prevent traffic accident from occurring and, failing that, to minimize the
injuries and economic losses from those crashes that do occur.
Traffic System Components
◉ Road users-drivers, pedestrians, bicyclists, and passengers
◉ Vehicles- private and commercial
◉ Streets and highways
◉ Traffic control devices
◉ The general environment
3
Road User Characteristics
◉ Physical: Vision, hearing, strength and General reaction to traffic situation.
◉ Mental: Knowledge, skill, experience, intelligence.
◉ Psychological: Fear, anger, impatience, maturity.
◉ Environmental: Facilities to the traffic, atmospheric condition and locality.
Breaking Characteristics
At least two of the following three parameters are needed during the breaking test in order
to determine skid resistance of pavement.
initial speed (u m/s)
length of skid distance (L meter)
Time of break application (t sec)
⇒ Retardation
v-u = at
(v=o)
-u= at
-a= u/t 4
⇒ Skid Resistance
v2 = u2 +2aL (v=0)
u2= -2aL
Δ KE = workdone
Dimension
Length of vehicle affects turning radius, extra widening, parking design etc. (Maximum length 18 meter)
Width of vehicle affects lane width, shoulder width and parking design. (Maximum width 2.44 meter)
Height of vehicle affects height of bridges, height of pole, etc. (Maximum height 4.75 meter)
Weight of Loaded Vehicle
Weight affects design gradient & thickness of pavement.
Power of Vehicle
It affects limiting & design value of gradient.
Speed of Vehicle
It affect all geometrical element & traffic control devices.
5
Vehicle Categories
AASHTO (American Association of State Highway and Transportation Officials)- Four main categories :
▫Passenger cars-all passenger cars, SUVs, minivans, vans, and pickup trucks.
▫Buses-intercity motor coaches, transit buses, school buses, and articulated buses
▫Trucks-single-unit trucks, tractor-trailer, and tractor-semi-trailer combination vehicles
▫Recreational vehicles-motor homes, cars with various types of trailers (boat, campers, motorcycles, etc.)
Traffic Studies
◉ Traffic Volume Study
◉ Traffic Speed Studies
◉ Traffic Flow Characteristics & Capacity Study
◉ Origin and Destination (O & D) Study
◉ Parking Study
◉ Accident Studies
6
Volume studies
7
• Number of vehicle crossing the particular
section of road is per unit time is called
Traffic Volume. It is expressed in veh/day,
veh/hr, veh/min.
• PCU (Passenger Car Unit)
• Under mixed traffic condition, It is difficult
to find traffic volume, traffic density etc
hence all class of vehicle are converted into
a standard vehicle unit which is called PCU.
Class of Vehicle PCU
Car, Tempo 1
Motar Cycle 0.5
Cycle Rickshaw 1.5
Bus, Truck 3
Horse Drawn Vehicle 4
Small Bullet Car 6
Large Bullet Car 8
Measurements of Traffic
Volume
◉ Manual Method
In manual counts trained persons are posted
at each lag of an intersection to count and
record the number of trucks or buses, cars
etc.
◉ Mechanical Method
Radar (Radio Detection & Ranging)
CCTV Cameras
Magnetic Detector
Pressure Sensitive Detectors
◉ Presentation Of Traffic Volume Data
Annual Average Daily Traffic (AADT)
Annual Average Hourly Traffic (AAHT)
Annual Average Week Day Traffic (AAWT)
Average Daily Traffic (ADT)
Trend Chart
30th Highest Hourly Volume
Volume Flow Diagram at Intersection
Variation Chart
8
9
Traffic Volume Data can be expressed in following different ways-
Annual Average Daily Traffic (AADT)
AADT= veh/day.
Annual Average Hourly Traffic (AAHT)
AAHT= veh/hr.
Annual Average Week Day Traffic (AAWT)
AAWT= veh/day.
NOTE: AAWT>AADT, as on weekends traffic volume is considerably reduced.
Average Daily Traffic (ADT)
ADT= veh/day.
NOTE: ADT>AADT
Trend Chart
Traffic volume data can be represented in form of Trend chart over period of years, which is useful in
estimating the rate of growth of traffic that can be used for planning future expansion, design and regulation.
If from trend chart rate of growth of traffic volume is computed to be r%, then future traffic in given by
A=P(1+r)n
A= future traffic volume
P= present traffic volume
n= no of years.
Note: Average rate of growth of traffic is consider 5-7.5%.
10
30th Highest Hourly Volume
• It has been observed that 30th highest hourly
volume gives a satisfactory results in terms of
performance & it is economical in nature.
• 30th highest hourly volume is exceeded only
29 times in a years & all other traffic data will
lie lesser than that.
• IRC consider this traffic volume as Design
Hourly Volume.
Volume Flow Diagram at Intersection
Volume flow diagram at intersection either
drawn to a certain scale or indicating
traffic volume can be used find the details of
crossing & turning traffic.
These data are required for design
of Intersection.
11
Variation Chart
Variation charts shows the hourly, daily and seasonal variations. It helps in deciding the facilities and
regulations needed during peak traffic hours.
Periodic Volume Count
⇒In order to find certain traffic data, such as AADT, ADT etc. it is necessary to count traffic for long duration
of time(may be for years or months).
⇒Counting traffic for long duration of time, involves cost & effort which is not feasible practically.
⇒Hence to make reasonable estimate of certain traffic data concept of expansion factor can be used in
Periodic Volume Count.
⇒In periodic volume count, expansion factors are used as follows.
12
Peak Hour Factor (PHF)
It is defined as the ratio between the number of vehicles counted during the peak hour
and four times the number of vehicles counted during the highest 15 consecutive
minutes. Peak hour factor is a measure of the variation in demand during the peak
hour.
Traffic Speed Studies
Speed is the rate of travel expressed in kmph or m/s . Over a
particular route, the actual speed of vehicle may vary. Speed
of vehicle depends upon several factors such as geometric
features, traffic conditions, time, place, driver and
environment.
• Types of Speed
• Spot Speed
• Average Speed
• Time Mean Speed
• Space Mean Speed
• Journey Speed
• Running Speed
13
14
Spot Speed
It is an instantaneous speed of vehicle at particular instant of time or section of road. It is measured by:
Enoscope, Pressure Contact Tube, Loop Detector.
Average Speed
It is average speed of traffic calculate on the basic of spot speed of so many vehicle. It can be considered in
two different ways.
1.Time Mean Speed
2.Space Mean Speed
Time Mean Speed
Arithmetic mean of spot speed of all vehicle is called Time Mean Speed.
Space Mean Speed
It is harmonic mean of spot speed of all vehicle.
Note: Vt>Vs
Journey Speed
Running Speed
Running Time = Journey Time – Delay
15
Generally there are two type of speed studies carried out.
Spot Speed Study
Speed And Delay Study
1.Spot Speed Study
Spot speed studies cannot be used to find density because
measurements are done at one point only. Spot speed studies are
generally carried out for the following reasons:
• In accident studies
• To calculate the traffic capacity
• Planning of traffic regulations
• Decide the speed trends.
Representation Of Spot Speed Data
• Speed Distribution Table
• Frequency Distribution Curve
• Cumulative Speed of Vehicle
Speed Distribution Table
From the spot speed data of the selected sample, frequency
distribution tables are prepared for various speed range and no of
vehicle in such range. The arithmetic mean is taken as average speed.
Speed Rang
(kmph)
No of Speed /
Frequency
Observed
% Frequency
0-10 5 1.25
10-20 8 2
20-30 10 2.5
30-40 17 4.25
40-50 30 7.5
50-60 46 11.5
60-70 200 50
70-80 52 13
80-90 32 8
16
Frequency Distribution Curve
Curve plotted between average values of each speed group on the x-axis
and the frequency of vehicles in that group on y-axis is known as
frequency distribution curve of the spot speed.
•A frequency distribution curve of spot speed is plotted with speed of
vehicle or avg. value of each speed group of vehicle on the X- axis and
the percentages of vehicle in that group on the Y- axis. This graph is
called speed distribution curve.
98th percentile speed
• It is the speed at or below which 98% of vehicle are moving and only
2% exceeds this limit.
• As per IRC this speed is considered as design speed for Geometric
design.
85th percentile speed
• It is the upper safe movement for vehicle movement.
• This is adopted for safe speed limit.
15th Percentile Speed
• It is the lower safe limit to avoid congestion.
• Minimum speed on Major highway.
50th percentile speed
• It is considered as median speed.
2. Speed And Delay Study
We know that spot speed study cannot give the density of traffic. Hence speed & delay studies are carried out over
a long distance and hence it is possible to determine density of traffic. This study gives the running speeds, overall
speeds, fluctuation in speed and delay between two stations.
There are various methods of carrying out speed and delay study.
Floating Car Method
License Plate Method
Interview Technique
Elevated Observations
Floating Car Method
This method is used only for two lane two road. In this method a test vehicle is driven over a given length of road.
Speed of text vehicle should be approximately same as speed of traffic.
A group of four observers sitting in test vehicle records various details.
Observer 1: 1st observer will be record total journey time and total cumulative delay time using 2 stop watches.
Observer 2: Location & Reasons for congestion will be noted by 2nd observer.
Observer 3: Number of vehicle overtaking the test vehicles as well as overtaken by test vehicle will be noted
by 3rd observer.
Observer 4: 4th observer counts total number of vehicles in opposite direction on adjacent length.
17
18
According to this Method
Where,
tw= Average journey time when the test vehicle is running with the flow.
ta= Average journey time when the test vehicle is running against the flow.
ny= Average no of vehicle overtaking the test vehicle – Average no of vehicle overtaken by the test
vehicle.
ny= overtaking – overtaken. {this can be +ve, -ve or even zero}
na= Average no of vehicle counted in the direction of stream when the test vehicle travels in
the opposite direction. {na is measured by 4th observer of opposite direction of test vehicle}
PARKING STUDIES
◉ Parking is one of the major problems that is created by the increasing road traffic. It is an impact of transport
development.
◉ The availability of less space in urban areas has increased the demand for parking space especially in areas
like Central business district.
◉ This affects the mode choice also. This has a great economical impact.
PARKING STATISTICS
◉ Parking accumulation
◉ Parking volume
◉ Parking load
◉ Average Parking duration
◉ Parking turnover
◉ Parking index
PARKING ACCUMULATION
It is defined as the number of vehicles parked at a given instant of time.
expressed by accumulation curve.
Plotting the number of bays occupied with respect to time.
19
Parking volume:
◉ Parking volume is the total number of vehicles parked at a given duration of time
PARKING LOAD,AVERAGE
◉ Parking load gives the area under the accumulation curve.
◉ It is expressed as vehicle hours.
PARKING DURATION
◉ It is the ratio of total vehicle hours to the number of vehicles parked.
◉ Parking duration = parking load/parking volume
PARKING TURNOVER
◉ It is the ratio of number of vehicles parked in a duration to the number of parking bays available.
◉ Parking turnover = parking volume/No.of bays available
PARKING INDEX
◉ Parking index is also called occupancy or efficiency. It is defined as the ratio of number of bays occupied in a
time duration to the total space available.
◉ Parking index = parking load/ parking capacity *100
20
TYPES OF PARKING STUDIES
On street :
◉ Parallel parking
◉ 30˚ angle parking
◉ 45˚ angle parking
◉ 60˚ angle parking
◉ Right angle parking
Off street :
◉ Mechanical car parking
◉ Multistory car parking
◉ Roof car parking
◉ Surface car parking
◉ Underground parking
21
PARALLEL PARKING
The vehicles are parked along the length of the road.
The length available to park N number of vehicles, L = N/5.9
30° PARKING
The vehicles are parked at 30° with respect to the road alignment. In this case, more vehicles can be parked
compared to parallel parking. Delay caused to the traffic is also minimum in this type of parking
•L =0.58+5N
45° PARKING
As the angle of parking increases, more number of vehicles can be parked.
Hence compared to parallel parking and thirty
degree parking, more number of vehicles can be accommodated in this
type of parking.
L = 3.54 N+1.77
60° PARKING
The vehicles are parked at 60° to the direction of road. More number of
vehicles can be accommodated in this parking type. L=2.89N+2.16
RIGHT ANGLE PARKING
90° parking, the vehicles are parked perpendicular to the direction of
the road. Although it consumes maximum width kerb, length required is
very little.
L= 2.5N
22
OFF- STREET PARKING
In many urban centers, some areas are exclusively allotted for parking which will be at some distance away from
the main stream of traffic. Such a parking is referred to as off-street parking.
23
ACCIDENT STUDIES
The problem of accident is a very acute in highway transportation due to complex flow pattern of vehicular
traffic, presence of mixed traffic along with pedestrians. Traffic accident leads to loss of life and property. Thus
the traffic engineers have to undertake a big responsibility of providing safe traffic movements to the road users
and ensure their safety. Road accidents cannot be totally prevented but by suitable traffic engineering and
management the accident rate can be reduced to a certain extent. For this reason systematic study of traffic
accidents are required to be carried out. Proper investigation of the cause of accident will help to propose
preventive measures in terms of design and control.
◉ OBJECTIVES OF ACCIDENT STUDIES
1. To study the causes of accidents and suggest corrective measures at potential location
2. To evaluate existing design
3. To compute the financial losses incurred To support the proposed design and provide economic justification
to the improvement suggested by the traffic engineer
5. To carry out before and after studies and to demonstrate the improvement in the problem.
◉ CAUSES OF ROAD ACCIDENTS
1. Road Users - Excessive speed and rash driving, violation of traffic rules, failure to perceive traffic situation or
sign or signal in adequate time, carelessness, fatigue, alcohol,sleep etc.
2. Vehicle - Defects such as failure of brakes, steering system, tyre burst,lighting system .
3. Road Condition - Skidding road surface, pot holes, ruts. 24
4. Road design - Defective geometric design like inadequate sight distance, inadequate width of shoulders,
improper curve design, improper traffic control devices and improper lighting.
5. Environmental factors -unfavorable weather conditions like mist, snow, smoke and heavy rainfall which restrict
normal visibility and makes driving unsafe.
6. Other causes -improper location of advertisement boards, gate of level crossing not closed when required etc..
ACCIDENT STATISTICS
◉ The statistical analysis of accident is carried out periodically at critical locations or road stretches which will
help to arrive at suitable measures to effectively decrease accident rates. It is the measure (or estimates) of the
number and severity of accident.
◉ The places of accidents are marked on the map and the points of their clustering (BLACK SPOT) are
determined.
ACCIDENT ANALYSIS
◉ The accident data collection is the first step in the accident study. The data collection of the accidents is
primarily done by the police. Motorist accident reports are secondary data which are filed by motorists
themselves. The data to be collected should comprise all of these parameters:
◉ General - Date, time, person involved in accident, classification of accident like fatal, serious, minor
◉ Location - Description and detail of location of accident 25
◉ Details of vehicle involved - Registration number, description of vehicle, loading detail, vehicular defects
◉ Nature of accident - Details of collision, damages, injury and casualty
◉ Road and traffic condition - Details of road geometry, surface characteristics, type of traffic, traffic density
etc..
◉ Primary causes of accident - Details of various possible cases (already mentioned)which are the main causes
of accident.
◉ Accident cost - Financial losses incurred due to property damage, personal injury and casualty
These data collected need proper storing and retrieving for the following purpose.
1. Identification of location of points at which unusually high number of accident occur.
2. Detailed functional evaluation of critical accident location to identify the causes of accidents.
3. Development of procedure that allows identification of hazards before large number of accidents occurs.
4. Development of different statistical measures of various accident related factors to give insight into general
trends, common casual factors, driver profiles, etc.
26
ACCIDENT INVESTIGATION
1. Reporting
◉ Motorist accident report
◉ Police accident report
2. At Scene-Investigation
3. Technical Preparation
4. Professional Reconstruction
5. Cause Analysis
ACCIDENT DATA ANALYSIS
1. Accident Rate per Kilometer
2. Accident involvement Rate
3. Death rate based on population
4.Death rate based on registration
5. Accident Rate based on vehicle-kms of travel
27
SPEED STUDIES
◉ Spot Speed -
Instantaneous speed of a vehicle at a specified location.
◉ Average Speed -
Average of the spot speeds of all vehicles passing a given point on the highway.
◉ Running Speed -
Average speed maintained by a vehicle over a given course while the vehicle is in motion. Running speed=
Length of course / Running time
= Length of course / (Journey time- Delays)
◉ Journey speed-
Also known as overall travel speed It is the effective speed between two points. It is the distance between
two points divided by the total time taken by the vehicle to complete the journey, including all delays.
Journey speed = Distance/ Total journey Time (including Delays).
◉ Running speed-
It is the average speed maintained by a vehicle over a particular stretch of road, while the vehicle is in
motion; this is obtained by dividing the distance covered by the time during which the vehicle is actually
in motion.
28
TYPES OF SPEED STUDY
◉ Spot speed study
◉ Speed and delay study
Use of spot speed study
The use in planning traffic control and in traffic regulation.
To use in geometric design for redesigning the existing highway.
To use in accident studies.
To study the traffic capacity.
Spot speed study
The methods available for measuring spot speed can be grouped as
Those observations that require time taken by a vehicle to cover a known distance.
It consist of 1) long base methods- vehicles are timed over a long distance.
2) Short base methods- vehicles are timed over a Short distance, say about 2m.
Radar Speedometer which automatically records- instantaneous speed
Photographic method
Enoscope 29
PEDESTRAIN STUDY
◉ People walk for many reasons: to go to a neighbor’s house, for school, or to get to a business meeting. People
also walk for recreation and health benefits or for the enjoyment of being outside. Some pedestrians must
walk to transit or other destinations if they wish to travel independently. It is a public responsibility to provide
a safe, secure, and comfortable system for all people who walk.
PEDESTRIAN PROBLEMS
◉ Accidents Circumstances - Pedestrian accidents occurs in a variety of ways; the most common type involves
pedestrian crossing or entering the street at or between intersections.
1. Darting: It is used to indicate the sudden appearance of a pedestrian from behind a vehicle or other sight
obstruction.
2. Dashing: It refers to the running pedestrians.
Special Problems
1. Age: Children under 15 years of age from the largest group of pedestrian victims and have the highest in- jury
rate per population in their age group, the elderly have the highest fatality rate because of the lower probability of
their recovery from injuries.
2. Intoxication and Drug effects: Alcohol and drugs impair the behavior of pedestrians to the extent that they may
be a primary cause of accident.
3. Dusk and Darkness: Special pedestrian safety problems arise during the hours of dusk and darkness, when it is
most difficult for motorists to see pedestrians. 30
DESIGN PRINCIPLE OF PEDESTRIAN FACILITIES
◉ Width: The minimum clear width of a pedestrian access route shall be 1220 mm exclusive of the width of
curb. It varies according to pedestrian flow rate.
◉ Cross slope: The cross slope of the pedestrian access route shall be maximum 1:48.
◉ Surfaces: Surface should be firm, stable, slip resistance and prohibit openings & avoid service elements i.e.
manholes etc. A buffer zone of 1.2 to 1.8 m (4 to 6 ft) is desirable and should be provided to separate
pedestrians from the street. The buffer zone will vary according to the street type. In downtown or
commercial districts, a street furniture zone is usually appropriate.
DESIGN PRINCIPLE OF PEDESTRIAN FACILITIES
31
Pedestrian body ellipse
Pedestrian walking space requirement​
ORIGIN AND DESTINATION STUDIES :
In a transportation study, it is often necessary to know the exact origin and destination of the trips. The information
yielded by O-D survey includes land-use of the zones of origin and destination, household characteristics of the trip
making family, time of the day when journeys are made, trip purpose and mode of travel.
Origin is defined as the place where the trip begins and destination is defined as the place where the trip ends.
Origin-Destination (OD) studies are an important tool for transportation Professionals.
OD studies are conducted to understand the pattern of the movement of Persons and goods in a particular area of
interest during a particular period of time.
To regulate movement of heavy vehicles
To locate new bridge as per traffic demands
The origin and destination study is carried out mainly to know the origin and destination of various vehicles.
In this study the data collected are, number of vehicles, their origin and destination number of passengers in each
vehicle, route
This study is carried out To establish preferential routes for various categories of vehicles
To location of new proposed roads
To location of parking palaces
To locate expressway
32
METHOD OF ORIGIN & DESTINATION SURVEY
1)ROAD SIDE INTERVIEW SURVEYS
2)HOME-INTERVIEW SURVEYS
3)TELEPHONE SURVEYS
4)TAXI SURVEYS
5)POST CARD QUESTIONNAIRE SURVEYS
6)REGISTRATION NUMBER SURVEYS
7)TAG SURVEYS
8)PUBLIC TRANSPORT SURVEYS
9) COMMERCIAL VEHICAL SURVEYS
◉ ROAD SIDE INTERVIEW METHOD
In this method interview stations are previously decided on the roadway. The vehicles are stopped at the interview
stations by a group of persons and the answers to prescribed questionnaire are collected on the spot. The
information to be collected are :
a)Place and Time of Origin b)Place and Time of Destination c)Route d)Purpose of The Trip e)Types of
Vehicles f)Number of Passengers in Each Vehicle
Data is collected quickly in short duration. The vehicles are stopped for interview and there isdelay to the vehicular
movement. 33
◉ HOME-INTERVIEW SURVEY :
a)In this method random sample of 0.5 to 10% of the population is selected and the residence are visited by the
trained person who collect the travel data from each member of the household.
b)Detailed information regarding the trips made by the members is obtained on the spot.
c)The data collected may be useful either for planning the road network and other roadway facilities.
◉ TELEPHONE SURVEY :
This method interview are conduct with computer assisted telephone interview technology.
A complete system might include automatic dialling of next household to the interviewer to ask the next question.
Automatic skipping and branching within the list of questions depending on the answer to the previous question
,immediate logic checks on answer provided.
This method is Time-saving.
The information response is not good and accurate.
◉ POST CARD SURVEYS:
In this method reply-paid questionnaires are handed over to each of the drivers at the survey points
and requesting them to complete the information and return by post.
This method are simpler and cheaper than many others.
It might not lead to good or satisfactory responses.
34
TRAFFIC FLOW CHARACTERISTICS AND STUDIES :
Traffic Flow (q):- The rate at which vehicles pass at a fix point (vehicles per hour)= N(3600/t).
Traffic Density (k):- No. of vehicles(N) over a stretch of roadway(L) i.e. vehicles per kilometres = N/L
Time Headway :- Time interval between the passage of the fronts of the successive vehicles at a specified point.
Average Time Headway= Average travel time per unit distance x average space headway.
Space Headway :- Distance between front of successive vehicles.
◉ Flow density space mean speed
q = K x V
◉ Density = 1/ space headway
K = 1 / hs
◉ Space mean speed = flow x Space headway
V = q x hs
◉ Density = flow x time per unit distance
K = q x t
Traffic Flow (q) ,Traffic Density (k)
35
Traffic Control Devices & Regulation
◉ Intersection
◉ Traffic Signal
◉ Traffic Sign
◉ Road Marking
Intersection
◉ Intersection is the area where two or more roads meet or cross.
◉ At the intersection there are through, turning and crossing traffic movements.
◉ The movement of traffic are handed depending upon the type of intersection.
◉ There are two type of Intersection.
Intersection at Grade
Grade Separated Intersection
1.Intersection at Grade
◉ When all the roads meets at about the same level allowing traffic movements like crossing, weaving, merging
& diverging are called 1Q”Intersection At Grade”.
36
Diverging: It is a traffic operation when the vehicles moving in one direction is separated into different streams
according to their destinations.
Merging: Merging is the opposite of diverging. Merging is referred to as the process of joining the traffic coming
from different approaches and going to a common destination into a single stream.
Weaving: Weaving is the combined movement of both merging and diverging movements in the same direction.
◉ The point where the possible path of two vehicles intersect is called “Conflict Point”.
◉ The area containing all possible conflict points is termed as “Conflict Area”.
◉ If the relative speed & angle of approach of two vehicle is more, it increases the possibility of collision
between the vehicle and these conflict point are termed as “Major Conflict Point”. Example- Crossing &
Weaving Conflict.
◉ If the relative speed & angle of approach of two vehicle is less, it decreases the possibility of collision between
the vehicle and these conflict point are termed as “Minor Conflict Point”. Example- Merging & Diverging
Conflict.
◉ IRC do not consider Diverging Conflict.
37
Requirements of Intersection at Grade
Basic requirements of Intersection at Grade are:
◉ At the intersection the area of conflict should be as small as possible.
◉ The relative speed and particularly the angle of approach of vehicle should
be small.
◉ Adequate visibility should be available for vehicles approaching the
intersection
◉ Sudden change of path should be avoided.
◉ Proper sign should be installed.
◉ Good lighting at night is desired.
Type of Intersection at Grade
At Grade Intersection are further of following types.
Unchannelized Intersections
◉ In this entire intersection area is paved and there is no restriction to the
vehicles to use any part of this intersection area.
◉ It is very easy to construct but has most complex traffic operation over it
resulting in large conflict area.
◉ It is suitable to be provided for low traffic volume. 38
Channelized Intersections
◉ Channelized intersection is achieved by introducing islands into the intersection area, thus reducing the
total conflict area available in the unchannelized intersection.
◉ It is very useful as traffic control devices for intersection at grade and when the direction of the flow is to
be changed.
◉ It is comparatively difficult to construct.
39
Rotary Intersection
◉ It is an enlarged road intersection where all converging
vehicles are forced to move round a large central island in
clockwise direction before they can weave out of traffic flow
into their respective directions.
Design Factors For Rotary Intersection
Design Speed
◉ Vehicle approaching at grade intersection have
to considerable slow down their speed as compared to
design speed of that particular road however there is
no need for vehicle to stop at rotary.
◉ For rural area design speed 40kmph.
◉ For urban area design speed 30kmph.
40
Shape of Rotary Island
◉ The shape of central island depends on the number and layout of the Intersecting roads.
◉ When two equally important roads cross at roughly right angles ie all the four radiating are
placed symmetrically, Circular shape is suitable.
◉ The island may be elongated to accommodate in layout where more than four intersecting road are there
termed as elliptical shape
◉ Tangential shape of rotary is preferred when traffic in one direction is significant compared to traffic in other
direction.
◉ Turbine shape force reduction in speed of vehicles entering the rotary but creates the problem at night of head
light glare.
41
Radius of Curve at Entry
Radius at entry depends on various factors like design speed, super elevation and coefficient of lateral friction. The
entry to rotary is not straight but small curvature is introduced which force the driver to reduce the speed.
e+f = v2/gR = V2/127R
e=0
Hence, Radius of the entry curve is as follows:
Radius of Curve at Exit
Exit radius should be higher than entry radius and radius of rotary island so that vehicle discharge from the rotary at
a higher rate.
IRC recommends radius of exit curve to be 1.5→2 time radius of entry curve.
Rexit = (1.5 to 2)× Rentry
Radius of Central Island
IRC recommends radius of central island to be 1.33 time radius of entry curve.
RC.I = 1.33× Rentry
42
Type of
Road
Design
Speed V(kmph)
Radius (m)
Rural 40 20-35
Urban 30 15-25
Width of Carriageway At Exit & Entry
As per IRC width at entry and exit for different lane of approach road are as follows.
For Rural Road For Urban Road
43
No of lanes Width of Carriage Way at entry & exit (m),e1
2 6.5
3 7
4 8
6 13
No of lanes Width of Carriage Way at entry & exit (m),e1
2 7
3 7.5
4 10
6 15
Width of non-weaving section
The width of non-weaving section of the rotary should be equal to the widest single entry into the rotary and
should generally be less than the width of the weaving section(W>e2).
Width & Length of Weaving Section
The width of non-weaving section (e2)of the rotary should be equal to the widest single entry into the rotary and
should generally be less than the width of the weaving section(W).
The width of weaving section (W) of the rotary should be one traffic lane wider than mean width of the entry &
non weaving section, i.e
W= e+3.5 m
Length of Weaving Section
L ≥ 4W
Capacity Of Rotary
The practical capacity of rotary is dependent on the min capacity of the individual weaving section and is given by
following expression,
Qp=PCU/hours.
Where,
e= (e1+e2)/2 = average width of entry (e1) & width of non- weaving section (e2)
L= Length of weaving section
W= width of weaving section
Note
e/W = 0.4 → 1.0
W/L= 0.12 → 0.4
p= Weaving Ratio
Where,
a = Left turning traffic moving along left extreme lane
b = Crossing/Weaving traffic turning towards right while entering to the rotary
c = Crossing/Weaving traffic turning towards left while leaving rotary
d = Right turning traffic moving along right extreme lane 44
◉ Conditions to apply the above formula of capacity of rotary are:
6 m ≤ width of weaving section (w) ≤ 18m
e/W = (0.4 – 1)
W/L = 0.12 – 0.4
p = (0.4 – 1)
L = 18 – 90m
45
2.Grade Separated Intersection -Grade separation structures that permit the cross flow of traffic at different levels
without interruptions.
Transfer of route at grade separation or turning facilities are provided by “INTERCHANGE” which may be of
following types.
Interchange can also be classified on the basis of shape as follows
◉ Diamond interchange
◉ Trumpet interchange
◉ Partial Cloverleaf interchange
◉ Full Cloverleaf interchange
46
Advantages of Grade Separation
◉ There is increased safety for turning traffic and by indirect interchange ramp even right turn movement is
quite easy and safe.
◉ There is overall increase in comfort and convenience to the road users.
◉ Stage constructions of additional ramps are possible after the grade separation structure between main
roads are constructed.
Disadvantages of Grade Separation
◉ It is very costly to provide complete grade separation and interchange facilities.
◉ Construction of grade separation is difficult and undesirable in the area where there is limited right of
way.
◉ In flat or plain terrain, grade separation may introduce undesirable sags in the vertical alignment.
47
Traffic Sign
◉ A traffic sign is a device that is installed on a fixed or portable support and conveys a specific message using
words or symbols. Traffic signs should be set in such a way that they are easily seen and recognized by road
users.
Classification of Signs
◉ Traffic sign are divided into 3 categories.
◉ Regulatory/Mandatory Signs
◉ Warning Sings
◉ Informatory Sign
◉ There are three basic types of traffic sign: signs that give orders, signs that warn and signs that give information.
Each type has a different shape. Circles give orders, Triangles warn and Rectangles inform.
◉ A further guide to the function of a sign is its color. Blue circles give a mandatory instruction, such
as “Compulsory Turn Left” etc. Blue rectangles are used for information signs. All triangular signs are red.
◉ There are a few exceptions to the shape and color rules, to give certain signs greater prominence.
Examples are the “STOP” and “GIVE WAY”.
48
Regulatory / Mandatory Signs
◉ Regulatory or Mandatory signs are used to educate road users of specific laws and regulations in
order to ensure traffic safety and flow. Violating these signs is a criminal offence.
◉ Shape → Circular (Few exceptions to the shape and colour rules. Examples are the “STOP” and “GIVE
WAY”.)
◉ The Regulatory signs are classified under the following sub-heads:
◉ Stop and Give-way signs
◉ Prohibitory signs
◉ Speed Limit and Vehicle Control Signs
◉ No Parking and NO Stopping signs
◉ Compulsory Direction Control and Other Signs
◉ Restriction Ends sign
49
Warning/ Cautionary Sings
◉ These signs are used to advise road users of upcoming road conditions at a suitable distance in
advance. Warning signs are also known as cautionary signs. The warning signs are shaped like an
equilateral triangle with an upward pointing apex.
◉ Shape → Triangle
◉ The symbols are black and have a white background with a red border
50
Informatory Sign
◉ Informatory signs are provided to guide the road users about the routes, destination, direction, roadside
facilities which make travel easier, safe and pleasant.
◉ Shape → Rectangular
◉ The Informatory Sign are classified under the following sub-heads:
◉ Direction and Place Identification signs
◉ Facility Information signs
◉ Other Useful Information signs
◉ Parking sings
◉ Food Gauge
◉ IRC recommendations for the design of traffic signs:
◉ On high-speed routes, put up large signage.
◉ Use no more than three words.
◉ Reflectize of illuminate the signs to be read at night.
◉ The size of the letters on the sign and the speed of the cars will determine where the signs are placed.
◉ Two signs for different purposes should not be placed on the same sign post and should, if possible,
be separated by at least 30 meters.
◉ Location of the signs with respect to the carriageway.
51
Road Marking
◉ Road marking or traffic markings are made of lines, patterns, words, symbols or reflectors on the
pavement, kerb, sides of islands or on the fixed objects within or near the roadway. A road marking is a safety
device used on a road. Traffic markings may be called special signs intended to control, warn, guide
or regulate the traffic. The markings are made using paints in contrast with color and brightness of the
pavement or other background. Light reflecting paints are also commonly used for traffic marking. To ensure
that the markings are seen by the road users, the longitudinal lines should be at least 10 cm thick, and the
transverse lines should be made in such a way that they are visible at sufficient distance in advance to give
road users adequate time to respond.
Functions of Road Markings
◉ The main functions of the road markings are to guide the safe and smooth flow of traffic in the
following ways:
52
◉ Segregation of traffic
◉ Stop and Go
◉ Give way instruction
◉ Overtaking or not
◉ Two lanes to one lane/ lane
traffic
◉ Inter-vehicle distance
◉ Parking zone or no parking
◉ Speed indication
◉ Direction
◉ One way
◉ Pedestrian crossing
◉ Type of vehicles allowed
• Types of Road Marking
• Pavement Marking
• Kerb Marking
• Object Marking
• Reflector Unit Marking
• Pavement Marking-Pavement markings are made
generally with white color & yellow color marking
are used to indicate parking restriction. Some of the
common types of pavement marking are given
below:
• Centre Lines-These are meant to separate the
opposing streams of traffic on undivided two-way
roads.
• Lane Line-Lines are drawn to designate traffic
lanes. These are used to guide the traffic and to
properly utilize the carriageway.
• Edge Lines-Indicate carriageway edge of rural road
which have no kerb stones along edge. 53
No Passing Zone Marking
◉ These are marked to indicate that overtaking is not permitted.
Turn Markings
◉ These are useful near intersection to designate proper lateral placement of vehicles before turning to the
different directions.
Stop Line
◉ These are meant for vehicles to stop near the pedestrian crossing, signalized intersection etc. where the
vehicles have to stop and proceed.
Crosswalk Lines
◉ The particular places where pedestrian are to cross the pavement are properly marked by the pavement
markings. The width of pedestrian crossing may be between 2.0 and 4.0 m depending on local requirements.
54
Road Delineators
• Road delineators is provide visual
assistance to drivers about the
alignment of a road ahead, especially
at night.
• Reflectors are used on delineators for
better nigh visibility.
Three types of Road delineators
• Roadway Indicators
• Hazard Markers
• Object Markers
55
Traffic Signals
Traffic signals are control devices which could alternately direct the traffic to stop and proceed at intersections using
red and green traffic light signals.
The main requirement of traffic signals are
◉ It should draw the attention of road user.
◉ It should provide meaning & time to respond.
◉ It should have minimum waste of time.
Type of Traffic Signals
◉ The signals are classified into the following types:
◉ Traffic Control Signals
○ Fixed-time Signal
○ Manually Operated Signal
○ Traffic Actuated (automatic) Signal
◉ Pedestrian Signal
◉ Special traffic Signal
Traffic Control Signals
◉ Traffic Control Signals have three colored light glows facing each direction of traffic flow. The Red light is meant
for “Stop“, Green light indicates “GO” and the Amber light allows the clearance time for the vehicles which
enter the intersection area by the end of green time.
56
Traffic control signals are of three types:
◉ Fixed-time Signal
In Fixed Time Signal the timing of each phase of the cycle is predetermined base on the traffic studies. The main
drawback of this is that some times the traffic flow on one road may be almost nil and traffic on cross road may be
quite heavy but signal operates with fixed timings.
◉ Traffic Actuated (automatic) Signal
Traffic actuated signals are those in which the timings of phase and cycle are changed according to traffic demand.
◉ Semi-actuated Signal is a signal whose timing (cycle length, green time, etc.) is affected when vehicles are
detected (by video, pavement embedded inductance loop detectors, etc.) on some, but not all, approaches.
This mode of operation is usually found where a low-volume road intersects a high-volume road. In such
cases, green time is allocated to the major street until vehicles are detected on the minor street: the the green
indication is briefly allocated to the minor street and then returned to the major street.
◉ Fully Actuated Signal is a signal whose timing (cycle length, green time, etc.) is completely influenced by the
traffic volumes, when detected, on all of the approaches. Fully actuated signals are most commonly used at
intersections of two major streets.
◉ Manually Operated Signal
These signals are operated manually and not commonly used. In these types of signals, the traffic police watches
the traffic demand from a suitable point during the peak hours at the intersection and varies the timings of these
phases and cycle accordingly.
57
Pedestrian Signal
◉ It is used to give the right of way to pedestrians to cross a road when the vehicular traffic shall be stopped by
stop signal.
Special Traffic Signal
◉ Special traffic signal such as “FLASHING BEACONS” are meant to Warn the traffic. When signal is flashing red
then the vehicles shall stop before entering the nearest crosswalk at an intersection.
◉ While flashing yellow signals are caution signals meant to signify that drivers may proceed with caution.
58
Pedestrian Signal
Special Traffic Signal
Important Terminology of Traffic Signals
1.Cycle-A signal cycle is one complete rotation through all the indications provided. (Red, Green, Amber)
2.Cycle Length -It is the time in seconds that it takes a signal to complete one full cycle of indication ie. the time
interval between the starting of green for one approach till next time the green starts.
3.Interval-It indicates the change from one stage to another. There are two types of interval:
Change Interval: It is also called yellow time and it indicates the interval between green and red Signal.
Clearance Interval: It is also known as all red time and is included after each yellow interval indicating a period
during which all signal phases shows red and it is used for clearing of vehicles at the intersections.
4.Green Time-It is provided to allow traffic flow through the intersection. It is designed on the basic of traffic
volume of given road. It is the actual time duration the green signals is turned on.
5.Red Time-It is provided to stop the traffic flow on the intersection. It is designed on the basic of traffic volume of
cross road. It is the actual time duration the red signals is turned on.
6.Amber Time-It is clearance time provided after the green time, just for clearance of traffic so that traffic on cross
road can be started.
59
Intelligent transportation systems (ITS)
ITS technologies include state-of-the-art wireless, electronic, and automated technologies. Collectively, these
technologies have the potential to integrate vehicles (transit, trucks, and personal vehicles), system users, and
infrastructure (roads and transit). Automated and in-vehicle technologies include precision docking for buses,
automated guideways, and collision avoidance systems. Many ITS technologies can help to optimize trips (route
guidance), diminish unnecessary miles traveled, increase other mode use, reduce time spent in congestion, reduce
dependence on foreign oil, and improve air quality. Furthermore, when ITS technologies are applied to system
management (transit and highways) and vehicle design, they can reduce fuel consumption by
◉ facilitating optimal route planning and timing;
◉ smoothing accelerations/decelerations and stop-and-go driving
◉ reducing congestion;
◉ enabling pricing and demand management strategies;
◉ increasing the attractiveness of public transportation mode use;
◉ adjusting vehicle transmission for varying road conditions and terrain;
◉ facilitating small platoons of closely spaced vehicles (i.e., safer vehicles could enable weight reduction without
compromising occupant safety).
60
Although ITS technologies are still in the early phase of deployment, many have shown the potential to reduce
energy use. During the past 10 years or so, fuel consumption impacts of the following ITS technologies have
been studied:
(1) traffic signal control,
(2) traffic management and surveillance (e.g., ramp metering),
(3) incident management,
(4) electronic toll collection (ETC),
(5) traveler information,
(6) transit management,
(7) commercial vehicle operations (CVO),
(8) vehicle control technologies.
They are the focus of this article. Nevertheless, ITS impacts, including benefits, unintended consequences, and
aggregate effects, are still not well understood. The field of intelligent transportation systems, energy
consumption impacts, current measurement tools, and early findings are discussed in this article.
61
◉ bus rapid transit (BRT) Seeks to improve bus service by reducing travel time and providing enhanced rider
information; exclusive rights-of-way, bus lanes, adjusting stop locations, wider doors, preboarding payment,
and supportive land use policies contribute to BRT improvements
◉ electronic toll collection (ETC) Enables the instant payment of highway tolls when a vehicle passes through a
toll station via an electronic roadside antenna (or reader) and a pocket-sized tag containing a radio
transponder (typically placed inside a vehicle’s windshield); the toll tag transponder transmits radio
frequencies to the toll reade
◉ traveler information Provides the traveling public with information regarding available modes, optimal routes
◉ commercial vehicle operations (CVO) The application of electronic and wireless intelligent transportation
systems technologies to address a range of trucking industry concerns; CVO approaches include border
crossing clearance and safety via electronic clearance and manifesting, automatic vehicle location, vehicle-
tofleet management center communications, on-board safety diagnostics to enable more effective roadside
safety insp
◉ intelligent transportation systems (ITS) A wide range of technologies—including electronics, information
processing, wireless communications, and controls—aimed at improving safety, efficiency, and convenience of
the overall surface transportation network
◉ transit management Consists of four key areas: (1) transit vehicle tracking, (2) fare payment, (3) traveler
information, and (4) personalized public transportation alternatives; transit vehicle tracking includes
communication
62
Road drainage
◉ Road drainage includes the removal or control of surface water and subsurface water away from the road
surface and the sub grade that support it, one part of the rainwater flows to the ground or road surface, while
the other part flows into the ground and reaches the groundwater table, raising its level.
◉ It includes interception and diversion of water from the road surface and sub grade.
Purpose of road drainage:
◉ Road drainage maintains the surface of the road and its foundation as dry as possible with water.
◉ It maintain the stability and durability of the road.
◉ A good drainage system is required to maintain highway transportation at a minimal cost.
Requirements of a Good Drainage System
A good drainage system should prevent the following ill-effects of excess surface water and of ground water on the
pavement and on the subgrade:
1.Reduction of the strength of the pavement.
2. Spoiling the pavement surface by the formation of pot-holes and ruts.
3. Seeping of surface water through the pavement layers, shoulders and the sides into the subgrade.
4. Reduction in the bearing power of the subgrade through continued presence of water.
5. Volume changes in the subgrade and consequent settlements and deleterious effects.
63
6. Soil erosion around the pavement.
7. Slope failures in the case of cuttings and embankments for the roads.
8. Capillarity and frost action, weakening the subgrade.
TYPES OF ROAD DRAINAGE
1.SURFACE DRAINAGE:
◉ A system in which road surface water is collected and disposed within the roadway, it is called surface
drainage.
◉ This system prevents surface water flowing from the surface of the pavement to the shoulders into the sub-
grade of the road pavement or any other layer.
◉ Functions of surface drainage:
◉ To stop the drainage of water from the road surface.
◉ To keep the road surface dry with water.
◉ The flow of water collected by gravity to a nearby natural stream or river.
◉ To increase the stability of all types of pavement
64
1.Side gutter:
◉ The drain provides a parallel to the roadway so that collecting and disposing of surface water is called a side
gutter.
◉ Surface drainage is efficiently done by providing a side gutter or side drain in the embankment and cuttings.
◉ The section of the side gutter is normally trapezoidal or triangular in cutting.
◉ Side drains are usually provided parallel to roads, the design depth of side drains is low and the road is
subjected to light traffic.
Function of side gutter:
◉ The main function of the side gutters is to collect surface water.
◉ These drains eventually connect with the natural stream i.e. river.
◉ This side gutter can be cheap, easily constructed, and maintained but it gives an unpleasant look due to the
deep ditch, so is undesirable where traffic is heavy.
65
2.Catch water drains:
◉ Additional gutters or road drainage are provided parallel to the road at high levels for the collection and
disposal of surface water are known as water drains.
◉ Since the sloping land has a higher water content, it acquires a higher velocity as it approaches the gutter.
◉ This can cause the ground to sink and the drain can also be damaged, therefore water drains are provided
exclusively on sloping ground which goes near the roadside drain.
Functions of catch water drains:
◉ The catchwater drain accepts a large amount of surface water flow and also breaks the continuity.
◉ In this way, the flow reduces the velocity of the water thus prevents erosion, landslides and thereby
protecting the side gutter.
◉ It also helps to reduce the size.
◉ If surface water flowing from high-level land to the road is large, it is desirable to take this water at regular
intervals then this water flow through the embankment of the road through a pipe drain.
66
DRAINAGE OF CITY OR URBAN ROADS
◉ The surface drainage of city or urban roads is radically different than
that of the rural highways. In urban roads, the land width is limited and
the open drains cannot be provided as they are unsightly, occupy
more space, and serve as a source of danger to the traffic. The
underground drains or sewers are, therefore, an essential requirement
of street construction and are not so often necessary on rural
highways.
◉ Following are the two commonly adopted ways of providing drainage
to the urban roads:
(1) Catch basins
(2) Inlets.
1. Catch basins:
◉ A catch basin is a structure in the form of a chamber which is provided
along the sewer line to admit clear rain water free from silt, grit
debris, etc into the combined sewer Is provision on the sewer line serves
the following two objects.
◉ It prevents the entry of silt, grit, debris, etc contained in the rain water,
◉ It prevents the escape of sewer gas. 67
2. Inlets:
An inlet is an opening through which a stormwater is
admitted and conveyed to the stormwater sewer. The inlets
are located or placed by the sides of roads at a distance
of about 30 m to 60 m. The inlets are so located that storm
water is collected in a short period and there is no flooding
or accumulation of a huge quantity of storm water on the
roads. The inlets are connected to nearby manholes by
pipeline
68
2.SUB-SURFACE DRAINAGE
◉ When the system drains water from the pavement under which it is collected and removed, it is called
subsurface drainage.
◉ Sub-surface drainage is used exclusively to control the moisture of all types of road sub-grades.
◉ if the moisture that accumulates in the sub-soil is excessive, the road structure weakens therefore it is more
necessary to control the moisture of the road sub-grade.
Functions of sub-surface drainage:
◉ To control the moisture of road sub-grades.
◉ Also maintains the carrying capacity of subgrade soil by preventing water ingress into it.
◉ To reduce capillary growth, water sometimes rises to a sub-grade from groundwater due to
◉ This can be controlled by introducing a cut-off layer of granular material or impermeable bituminous layer.
69
ADVANTAGES & DISADVANTAGES OF ROAD DRAINAGE
◉ Excess water that accumulation above the ground can create an environment that encourages mosquitoes
to breed.
◉ Stationary water can make the soil dirty that cause corrosion. A drainage system can solve this problem
by removing toxins from your yard.
DISADVANTAGES OF ROAD DRAINAGE:
◉ A higher initial cost is required.
◉ Repair works are costly and inconvenient.
70
Thanks!
71
◉ Traffic Engineering and Management (iitb.ac.in)
◉ NPTEL :: Civil Engineering - Traffic Engineering & Management
◉ Traffic Engineering- Traffic Studies And Analysis- Traffic Volume Study & Traffic
Speed Studies | ESE NOTES
◉ Traffic Control Devices & Regulation – Traffic Sign & Road Marking
(https_esenotes.com)
72

TRAFFIC ENGINEERING & HIGHWAY DRAINAGE_.pdf

  • 1.
    Unit 5: TRAFFIC ENGINEERING& HIGHWAY DRAINAGE by, Ms. Priya Sarita Mane
  • 2.
    Content ◉ Traffic Engineering:Fundamentals of traffic flow, Road User and Vehicular characteristics. Traffic Studies: Volume studies, speed studies, parking studies, origin-destination studies and accident studies. ◉ Traffic management and Safety: Traffic control devices, channelization, traffic signal, junctions, intelligent transportation system, Design of Rotary Intersection and traffic Signal. ◉ Highway drainage- Necessity, surface draining and sub drainage 2
  • 3.
    INTRODUCTION ◉ Before highwayis opened to traffic, careful thought must be given to conveying to drivers information concerning its proper use. Such information is given traffic control devices. ◉ Engineer must also recognize that despite their best efforts to promote well-designed traffic control systems, vehicles will occasionally go out of control and possibly crash. Every effort must be made to prevent traffic accident from occurring and, failing that, to minimize the injuries and economic losses from those crashes that do occur. Traffic System Components ◉ Road users-drivers, pedestrians, bicyclists, and passengers ◉ Vehicles- private and commercial ◉ Streets and highways ◉ Traffic control devices ◉ The general environment 3
  • 4.
    Road User Characteristics ◉Physical: Vision, hearing, strength and General reaction to traffic situation. ◉ Mental: Knowledge, skill, experience, intelligence. ◉ Psychological: Fear, anger, impatience, maturity. ◉ Environmental: Facilities to the traffic, atmospheric condition and locality. Breaking Characteristics At least two of the following three parameters are needed during the breaking test in order to determine skid resistance of pavement. initial speed (u m/s) length of skid distance (L meter) Time of break application (t sec) ⇒ Retardation v-u = at (v=o) -u= at -a= u/t 4 ⇒ Skid Resistance v2 = u2 +2aL (v=0) u2= -2aL Δ KE = workdone
  • 5.
    Dimension Length of vehicleaffects turning radius, extra widening, parking design etc. (Maximum length 18 meter) Width of vehicle affects lane width, shoulder width and parking design. (Maximum width 2.44 meter) Height of vehicle affects height of bridges, height of pole, etc. (Maximum height 4.75 meter) Weight of Loaded Vehicle Weight affects design gradient & thickness of pavement. Power of Vehicle It affects limiting & design value of gradient. Speed of Vehicle It affect all geometrical element & traffic control devices. 5 Vehicle Categories AASHTO (American Association of State Highway and Transportation Officials)- Four main categories : ▫Passenger cars-all passenger cars, SUVs, minivans, vans, and pickup trucks. ▫Buses-intercity motor coaches, transit buses, school buses, and articulated buses ▫Trucks-single-unit trucks, tractor-trailer, and tractor-semi-trailer combination vehicles ▫Recreational vehicles-motor homes, cars with various types of trailers (boat, campers, motorcycles, etc.)
  • 6.
    Traffic Studies ◉ TrafficVolume Study ◉ Traffic Speed Studies ◉ Traffic Flow Characteristics & Capacity Study ◉ Origin and Destination (O & D) Study ◉ Parking Study ◉ Accident Studies 6
  • 7.
    Volume studies 7 • Numberof vehicle crossing the particular section of road is per unit time is called Traffic Volume. It is expressed in veh/day, veh/hr, veh/min. • PCU (Passenger Car Unit) • Under mixed traffic condition, It is difficult to find traffic volume, traffic density etc hence all class of vehicle are converted into a standard vehicle unit which is called PCU. Class of Vehicle PCU Car, Tempo 1 Motar Cycle 0.5 Cycle Rickshaw 1.5 Bus, Truck 3 Horse Drawn Vehicle 4 Small Bullet Car 6 Large Bullet Car 8
  • 8.
    Measurements of Traffic Volume ◉Manual Method In manual counts trained persons are posted at each lag of an intersection to count and record the number of trucks or buses, cars etc. ◉ Mechanical Method Radar (Radio Detection & Ranging) CCTV Cameras Magnetic Detector Pressure Sensitive Detectors ◉ Presentation Of Traffic Volume Data Annual Average Daily Traffic (AADT) Annual Average Hourly Traffic (AAHT) Annual Average Week Day Traffic (AAWT) Average Daily Traffic (ADT) Trend Chart 30th Highest Hourly Volume Volume Flow Diagram at Intersection Variation Chart 8
  • 9.
    9 Traffic Volume Datacan be expressed in following different ways- Annual Average Daily Traffic (AADT) AADT= veh/day. Annual Average Hourly Traffic (AAHT) AAHT= veh/hr. Annual Average Week Day Traffic (AAWT) AAWT= veh/day. NOTE: AAWT>AADT, as on weekends traffic volume is considerably reduced. Average Daily Traffic (ADT) ADT= veh/day. NOTE: ADT>AADT Trend Chart Traffic volume data can be represented in form of Trend chart over period of years, which is useful in estimating the rate of growth of traffic that can be used for planning future expansion, design and regulation. If from trend chart rate of growth of traffic volume is computed to be r%, then future traffic in given by A=P(1+r)n A= future traffic volume P= present traffic volume n= no of years. Note: Average rate of growth of traffic is consider 5-7.5%.
  • 10.
    10 30th Highest HourlyVolume • It has been observed that 30th highest hourly volume gives a satisfactory results in terms of performance & it is economical in nature. • 30th highest hourly volume is exceeded only 29 times in a years & all other traffic data will lie lesser than that. • IRC consider this traffic volume as Design Hourly Volume. Volume Flow Diagram at Intersection Volume flow diagram at intersection either drawn to a certain scale or indicating traffic volume can be used find the details of crossing & turning traffic. These data are required for design of Intersection.
  • 11.
    11 Variation Chart Variation chartsshows the hourly, daily and seasonal variations. It helps in deciding the facilities and regulations needed during peak traffic hours. Periodic Volume Count ⇒In order to find certain traffic data, such as AADT, ADT etc. it is necessary to count traffic for long duration of time(may be for years or months). ⇒Counting traffic for long duration of time, involves cost & effort which is not feasible practically. ⇒Hence to make reasonable estimate of certain traffic data concept of expansion factor can be used in Periodic Volume Count. ⇒In periodic volume count, expansion factors are used as follows.
  • 12.
    12 Peak Hour Factor(PHF) It is defined as the ratio between the number of vehicles counted during the peak hour and four times the number of vehicles counted during the highest 15 consecutive minutes. Peak hour factor is a measure of the variation in demand during the peak hour.
  • 13.
    Traffic Speed Studies Speedis the rate of travel expressed in kmph or m/s . Over a particular route, the actual speed of vehicle may vary. Speed of vehicle depends upon several factors such as geometric features, traffic conditions, time, place, driver and environment. • Types of Speed • Spot Speed • Average Speed • Time Mean Speed • Space Mean Speed • Journey Speed • Running Speed 13
  • 14.
    14 Spot Speed It isan instantaneous speed of vehicle at particular instant of time or section of road. It is measured by: Enoscope, Pressure Contact Tube, Loop Detector. Average Speed It is average speed of traffic calculate on the basic of spot speed of so many vehicle. It can be considered in two different ways. 1.Time Mean Speed 2.Space Mean Speed Time Mean Speed Arithmetic mean of spot speed of all vehicle is called Time Mean Speed. Space Mean Speed It is harmonic mean of spot speed of all vehicle. Note: Vt>Vs Journey Speed Running Speed Running Time = Journey Time – Delay
  • 15.
    15 Generally there aretwo type of speed studies carried out. Spot Speed Study Speed And Delay Study 1.Spot Speed Study Spot speed studies cannot be used to find density because measurements are done at one point only. Spot speed studies are generally carried out for the following reasons: • In accident studies • To calculate the traffic capacity • Planning of traffic regulations • Decide the speed trends. Representation Of Spot Speed Data • Speed Distribution Table • Frequency Distribution Curve • Cumulative Speed of Vehicle Speed Distribution Table From the spot speed data of the selected sample, frequency distribution tables are prepared for various speed range and no of vehicle in such range. The arithmetic mean is taken as average speed. Speed Rang (kmph) No of Speed / Frequency Observed % Frequency 0-10 5 1.25 10-20 8 2 20-30 10 2.5 30-40 17 4.25 40-50 30 7.5 50-60 46 11.5 60-70 200 50 70-80 52 13 80-90 32 8
  • 16.
    16 Frequency Distribution Curve Curveplotted between average values of each speed group on the x-axis and the frequency of vehicles in that group on y-axis is known as frequency distribution curve of the spot speed. •A frequency distribution curve of spot speed is plotted with speed of vehicle or avg. value of each speed group of vehicle on the X- axis and the percentages of vehicle in that group on the Y- axis. This graph is called speed distribution curve. 98th percentile speed • It is the speed at or below which 98% of vehicle are moving and only 2% exceeds this limit. • As per IRC this speed is considered as design speed for Geometric design. 85th percentile speed • It is the upper safe movement for vehicle movement. • This is adopted for safe speed limit. 15th Percentile Speed • It is the lower safe limit to avoid congestion. • Minimum speed on Major highway. 50th percentile speed • It is considered as median speed.
  • 17.
    2. Speed AndDelay Study We know that spot speed study cannot give the density of traffic. Hence speed & delay studies are carried out over a long distance and hence it is possible to determine density of traffic. This study gives the running speeds, overall speeds, fluctuation in speed and delay between two stations. There are various methods of carrying out speed and delay study. Floating Car Method License Plate Method Interview Technique Elevated Observations Floating Car Method This method is used only for two lane two road. In this method a test vehicle is driven over a given length of road. Speed of text vehicle should be approximately same as speed of traffic. A group of four observers sitting in test vehicle records various details. Observer 1: 1st observer will be record total journey time and total cumulative delay time using 2 stop watches. Observer 2: Location & Reasons for congestion will be noted by 2nd observer. Observer 3: Number of vehicle overtaking the test vehicles as well as overtaken by test vehicle will be noted by 3rd observer. Observer 4: 4th observer counts total number of vehicles in opposite direction on adjacent length. 17
  • 18.
    18 According to thisMethod Where, tw= Average journey time when the test vehicle is running with the flow. ta= Average journey time when the test vehicle is running against the flow. ny= Average no of vehicle overtaking the test vehicle – Average no of vehicle overtaken by the test vehicle. ny= overtaking – overtaken. {this can be +ve, -ve or even zero} na= Average no of vehicle counted in the direction of stream when the test vehicle travels in the opposite direction. {na is measured by 4th observer of opposite direction of test vehicle}
  • 19.
    PARKING STUDIES ◉ Parkingis one of the major problems that is created by the increasing road traffic. It is an impact of transport development. ◉ The availability of less space in urban areas has increased the demand for parking space especially in areas like Central business district. ◉ This affects the mode choice also. This has a great economical impact. PARKING STATISTICS ◉ Parking accumulation ◉ Parking volume ◉ Parking load ◉ Average Parking duration ◉ Parking turnover ◉ Parking index PARKING ACCUMULATION It is defined as the number of vehicles parked at a given instant of time. expressed by accumulation curve. Plotting the number of bays occupied with respect to time. 19
  • 20.
    Parking volume: ◉ Parkingvolume is the total number of vehicles parked at a given duration of time PARKING LOAD,AVERAGE ◉ Parking load gives the area under the accumulation curve. ◉ It is expressed as vehicle hours. PARKING DURATION ◉ It is the ratio of total vehicle hours to the number of vehicles parked. ◉ Parking duration = parking load/parking volume PARKING TURNOVER ◉ It is the ratio of number of vehicles parked in a duration to the number of parking bays available. ◉ Parking turnover = parking volume/No.of bays available PARKING INDEX ◉ Parking index is also called occupancy or efficiency. It is defined as the ratio of number of bays occupied in a time duration to the total space available. ◉ Parking index = parking load/ parking capacity *100 20
  • 21.
    TYPES OF PARKINGSTUDIES On street : ◉ Parallel parking ◉ 30˚ angle parking ◉ 45˚ angle parking ◉ 60˚ angle parking ◉ Right angle parking Off street : ◉ Mechanical car parking ◉ Multistory car parking ◉ Roof car parking ◉ Surface car parking ◉ Underground parking 21 PARALLEL PARKING The vehicles are parked along the length of the road. The length available to park N number of vehicles, L = N/5.9 30° PARKING The vehicles are parked at 30° with respect to the road alignment. In this case, more vehicles can be parked compared to parallel parking. Delay caused to the traffic is also minimum in this type of parking •L =0.58+5N
  • 22.
    45° PARKING As theangle of parking increases, more number of vehicles can be parked. Hence compared to parallel parking and thirty degree parking, more number of vehicles can be accommodated in this type of parking. L = 3.54 N+1.77 60° PARKING The vehicles are parked at 60° to the direction of road. More number of vehicles can be accommodated in this parking type. L=2.89N+2.16 RIGHT ANGLE PARKING 90° parking, the vehicles are parked perpendicular to the direction of the road. Although it consumes maximum width kerb, length required is very little. L= 2.5N 22
  • 23.
    OFF- STREET PARKING Inmany urban centers, some areas are exclusively allotted for parking which will be at some distance away from the main stream of traffic. Such a parking is referred to as off-street parking. 23
  • 24.
    ACCIDENT STUDIES The problemof accident is a very acute in highway transportation due to complex flow pattern of vehicular traffic, presence of mixed traffic along with pedestrians. Traffic accident leads to loss of life and property. Thus the traffic engineers have to undertake a big responsibility of providing safe traffic movements to the road users and ensure their safety. Road accidents cannot be totally prevented but by suitable traffic engineering and management the accident rate can be reduced to a certain extent. For this reason systematic study of traffic accidents are required to be carried out. Proper investigation of the cause of accident will help to propose preventive measures in terms of design and control. ◉ OBJECTIVES OF ACCIDENT STUDIES 1. To study the causes of accidents and suggest corrective measures at potential location 2. To evaluate existing design 3. To compute the financial losses incurred To support the proposed design and provide economic justification to the improvement suggested by the traffic engineer 5. To carry out before and after studies and to demonstrate the improvement in the problem. ◉ CAUSES OF ROAD ACCIDENTS 1. Road Users - Excessive speed and rash driving, violation of traffic rules, failure to perceive traffic situation or sign or signal in adequate time, carelessness, fatigue, alcohol,sleep etc. 2. Vehicle - Defects such as failure of brakes, steering system, tyre burst,lighting system . 3. Road Condition - Skidding road surface, pot holes, ruts. 24
  • 25.
    4. Road design- Defective geometric design like inadequate sight distance, inadequate width of shoulders, improper curve design, improper traffic control devices and improper lighting. 5. Environmental factors -unfavorable weather conditions like mist, snow, smoke and heavy rainfall which restrict normal visibility and makes driving unsafe. 6. Other causes -improper location of advertisement boards, gate of level crossing not closed when required etc.. ACCIDENT STATISTICS ◉ The statistical analysis of accident is carried out periodically at critical locations or road stretches which will help to arrive at suitable measures to effectively decrease accident rates. It is the measure (or estimates) of the number and severity of accident. ◉ The places of accidents are marked on the map and the points of their clustering (BLACK SPOT) are determined. ACCIDENT ANALYSIS ◉ The accident data collection is the first step in the accident study. The data collection of the accidents is primarily done by the police. Motorist accident reports are secondary data which are filed by motorists themselves. The data to be collected should comprise all of these parameters: ◉ General - Date, time, person involved in accident, classification of accident like fatal, serious, minor ◉ Location - Description and detail of location of accident 25
  • 26.
    ◉ Details ofvehicle involved - Registration number, description of vehicle, loading detail, vehicular defects ◉ Nature of accident - Details of collision, damages, injury and casualty ◉ Road and traffic condition - Details of road geometry, surface characteristics, type of traffic, traffic density etc.. ◉ Primary causes of accident - Details of various possible cases (already mentioned)which are the main causes of accident. ◉ Accident cost - Financial losses incurred due to property damage, personal injury and casualty These data collected need proper storing and retrieving for the following purpose. 1. Identification of location of points at which unusually high number of accident occur. 2. Detailed functional evaluation of critical accident location to identify the causes of accidents. 3. Development of procedure that allows identification of hazards before large number of accidents occurs. 4. Development of different statistical measures of various accident related factors to give insight into general trends, common casual factors, driver profiles, etc. 26
  • 27.
    ACCIDENT INVESTIGATION 1. Reporting ◉Motorist accident report ◉ Police accident report 2. At Scene-Investigation 3. Technical Preparation 4. Professional Reconstruction 5. Cause Analysis ACCIDENT DATA ANALYSIS 1. Accident Rate per Kilometer 2. Accident involvement Rate 3. Death rate based on population 4.Death rate based on registration 5. Accident Rate based on vehicle-kms of travel 27
  • 28.
    SPEED STUDIES ◉ SpotSpeed - Instantaneous speed of a vehicle at a specified location. ◉ Average Speed - Average of the spot speeds of all vehicles passing a given point on the highway. ◉ Running Speed - Average speed maintained by a vehicle over a given course while the vehicle is in motion. Running speed= Length of course / Running time = Length of course / (Journey time- Delays) ◉ Journey speed- Also known as overall travel speed It is the effective speed between two points. It is the distance between two points divided by the total time taken by the vehicle to complete the journey, including all delays. Journey speed = Distance/ Total journey Time (including Delays). ◉ Running speed- It is the average speed maintained by a vehicle over a particular stretch of road, while the vehicle is in motion; this is obtained by dividing the distance covered by the time during which the vehicle is actually in motion. 28
  • 29.
    TYPES OF SPEEDSTUDY ◉ Spot speed study ◉ Speed and delay study Use of spot speed study The use in planning traffic control and in traffic regulation. To use in geometric design for redesigning the existing highway. To use in accident studies. To study the traffic capacity. Spot speed study The methods available for measuring spot speed can be grouped as Those observations that require time taken by a vehicle to cover a known distance. It consist of 1) long base methods- vehicles are timed over a long distance. 2) Short base methods- vehicles are timed over a Short distance, say about 2m. Radar Speedometer which automatically records- instantaneous speed Photographic method Enoscope 29
  • 30.
    PEDESTRAIN STUDY ◉ Peoplewalk for many reasons: to go to a neighbor’s house, for school, or to get to a business meeting. People also walk for recreation and health benefits or for the enjoyment of being outside. Some pedestrians must walk to transit or other destinations if they wish to travel independently. It is a public responsibility to provide a safe, secure, and comfortable system for all people who walk. PEDESTRIAN PROBLEMS ◉ Accidents Circumstances - Pedestrian accidents occurs in a variety of ways; the most common type involves pedestrian crossing or entering the street at or between intersections. 1. Darting: It is used to indicate the sudden appearance of a pedestrian from behind a vehicle or other sight obstruction. 2. Dashing: It refers to the running pedestrians. Special Problems 1. Age: Children under 15 years of age from the largest group of pedestrian victims and have the highest in- jury rate per population in their age group, the elderly have the highest fatality rate because of the lower probability of their recovery from injuries. 2. Intoxication and Drug effects: Alcohol and drugs impair the behavior of pedestrians to the extent that they may be a primary cause of accident. 3. Dusk and Darkness: Special pedestrian safety problems arise during the hours of dusk and darkness, when it is most difficult for motorists to see pedestrians. 30
  • 31.
    DESIGN PRINCIPLE OFPEDESTRIAN FACILITIES ◉ Width: The minimum clear width of a pedestrian access route shall be 1220 mm exclusive of the width of curb. It varies according to pedestrian flow rate. ◉ Cross slope: The cross slope of the pedestrian access route shall be maximum 1:48. ◉ Surfaces: Surface should be firm, stable, slip resistance and prohibit openings & avoid service elements i.e. manholes etc. A buffer zone of 1.2 to 1.8 m (4 to 6 ft) is desirable and should be provided to separate pedestrians from the street. The buffer zone will vary according to the street type. In downtown or commercial districts, a street furniture zone is usually appropriate. DESIGN PRINCIPLE OF PEDESTRIAN FACILITIES 31 Pedestrian body ellipse Pedestrian walking space requirement​
  • 32.
    ORIGIN AND DESTINATIONSTUDIES : In a transportation study, it is often necessary to know the exact origin and destination of the trips. The information yielded by O-D survey includes land-use of the zones of origin and destination, household characteristics of the trip making family, time of the day when journeys are made, trip purpose and mode of travel. Origin is defined as the place where the trip begins and destination is defined as the place where the trip ends. Origin-Destination (OD) studies are an important tool for transportation Professionals. OD studies are conducted to understand the pattern of the movement of Persons and goods in a particular area of interest during a particular period of time. To regulate movement of heavy vehicles To locate new bridge as per traffic demands The origin and destination study is carried out mainly to know the origin and destination of various vehicles. In this study the data collected are, number of vehicles, their origin and destination number of passengers in each vehicle, route This study is carried out To establish preferential routes for various categories of vehicles To location of new proposed roads To location of parking palaces To locate expressway 32
  • 33.
    METHOD OF ORIGIN& DESTINATION SURVEY 1)ROAD SIDE INTERVIEW SURVEYS 2)HOME-INTERVIEW SURVEYS 3)TELEPHONE SURVEYS 4)TAXI SURVEYS 5)POST CARD QUESTIONNAIRE SURVEYS 6)REGISTRATION NUMBER SURVEYS 7)TAG SURVEYS 8)PUBLIC TRANSPORT SURVEYS 9) COMMERCIAL VEHICAL SURVEYS ◉ ROAD SIDE INTERVIEW METHOD In this method interview stations are previously decided on the roadway. The vehicles are stopped at the interview stations by a group of persons and the answers to prescribed questionnaire are collected on the spot. The information to be collected are : a)Place and Time of Origin b)Place and Time of Destination c)Route d)Purpose of The Trip e)Types of Vehicles f)Number of Passengers in Each Vehicle Data is collected quickly in short duration. The vehicles are stopped for interview and there isdelay to the vehicular movement. 33
  • 34.
    ◉ HOME-INTERVIEW SURVEY: a)In this method random sample of 0.5 to 10% of the population is selected and the residence are visited by the trained person who collect the travel data from each member of the household. b)Detailed information regarding the trips made by the members is obtained on the spot. c)The data collected may be useful either for planning the road network and other roadway facilities. ◉ TELEPHONE SURVEY : This method interview are conduct with computer assisted telephone interview technology. A complete system might include automatic dialling of next household to the interviewer to ask the next question. Automatic skipping and branching within the list of questions depending on the answer to the previous question ,immediate logic checks on answer provided. This method is Time-saving. The information response is not good and accurate. ◉ POST CARD SURVEYS: In this method reply-paid questionnaires are handed over to each of the drivers at the survey points and requesting them to complete the information and return by post. This method are simpler and cheaper than many others. It might not lead to good or satisfactory responses. 34
  • 35.
    TRAFFIC FLOW CHARACTERISTICSAND STUDIES : Traffic Flow (q):- The rate at which vehicles pass at a fix point (vehicles per hour)= N(3600/t). Traffic Density (k):- No. of vehicles(N) over a stretch of roadway(L) i.e. vehicles per kilometres = N/L Time Headway :- Time interval between the passage of the fronts of the successive vehicles at a specified point. Average Time Headway= Average travel time per unit distance x average space headway. Space Headway :- Distance between front of successive vehicles. ◉ Flow density space mean speed q = K x V ◉ Density = 1/ space headway K = 1 / hs ◉ Space mean speed = flow x Space headway V = q x hs ◉ Density = flow x time per unit distance K = q x t Traffic Flow (q) ,Traffic Density (k) 35
  • 36.
    Traffic Control Devices& Regulation ◉ Intersection ◉ Traffic Signal ◉ Traffic Sign ◉ Road Marking Intersection ◉ Intersection is the area where two or more roads meet or cross. ◉ At the intersection there are through, turning and crossing traffic movements. ◉ The movement of traffic are handed depending upon the type of intersection. ◉ There are two type of Intersection. Intersection at Grade Grade Separated Intersection 1.Intersection at Grade ◉ When all the roads meets at about the same level allowing traffic movements like crossing, weaving, merging & diverging are called 1Q”Intersection At Grade”. 36
  • 37.
    Diverging: It isa traffic operation when the vehicles moving in one direction is separated into different streams according to their destinations. Merging: Merging is the opposite of diverging. Merging is referred to as the process of joining the traffic coming from different approaches and going to a common destination into a single stream. Weaving: Weaving is the combined movement of both merging and diverging movements in the same direction. ◉ The point where the possible path of two vehicles intersect is called “Conflict Point”. ◉ The area containing all possible conflict points is termed as “Conflict Area”. ◉ If the relative speed & angle of approach of two vehicle is more, it increases the possibility of collision between the vehicle and these conflict point are termed as “Major Conflict Point”. Example- Crossing & Weaving Conflict. ◉ If the relative speed & angle of approach of two vehicle is less, it decreases the possibility of collision between the vehicle and these conflict point are termed as “Minor Conflict Point”. Example- Merging & Diverging Conflict. ◉ IRC do not consider Diverging Conflict. 37
  • 38.
    Requirements of Intersectionat Grade Basic requirements of Intersection at Grade are: ◉ At the intersection the area of conflict should be as small as possible. ◉ The relative speed and particularly the angle of approach of vehicle should be small. ◉ Adequate visibility should be available for vehicles approaching the intersection ◉ Sudden change of path should be avoided. ◉ Proper sign should be installed. ◉ Good lighting at night is desired. Type of Intersection at Grade At Grade Intersection are further of following types. Unchannelized Intersections ◉ In this entire intersection area is paved and there is no restriction to the vehicles to use any part of this intersection area. ◉ It is very easy to construct but has most complex traffic operation over it resulting in large conflict area. ◉ It is suitable to be provided for low traffic volume. 38
  • 39.
    Channelized Intersections ◉ Channelizedintersection is achieved by introducing islands into the intersection area, thus reducing the total conflict area available in the unchannelized intersection. ◉ It is very useful as traffic control devices for intersection at grade and when the direction of the flow is to be changed. ◉ It is comparatively difficult to construct. 39
  • 40.
    Rotary Intersection ◉ Itis an enlarged road intersection where all converging vehicles are forced to move round a large central island in clockwise direction before they can weave out of traffic flow into their respective directions. Design Factors For Rotary Intersection Design Speed ◉ Vehicle approaching at grade intersection have to considerable slow down their speed as compared to design speed of that particular road however there is no need for vehicle to stop at rotary. ◉ For rural area design speed 40kmph. ◉ For urban area design speed 30kmph. 40
  • 41.
    Shape of RotaryIsland ◉ The shape of central island depends on the number and layout of the Intersecting roads. ◉ When two equally important roads cross at roughly right angles ie all the four radiating are placed symmetrically, Circular shape is suitable. ◉ The island may be elongated to accommodate in layout where more than four intersecting road are there termed as elliptical shape ◉ Tangential shape of rotary is preferred when traffic in one direction is significant compared to traffic in other direction. ◉ Turbine shape force reduction in speed of vehicles entering the rotary but creates the problem at night of head light glare. 41
  • 42.
    Radius of Curveat Entry Radius at entry depends on various factors like design speed, super elevation and coefficient of lateral friction. The entry to rotary is not straight but small curvature is introduced which force the driver to reduce the speed. e+f = v2/gR = V2/127R e=0 Hence, Radius of the entry curve is as follows: Radius of Curve at Exit Exit radius should be higher than entry radius and radius of rotary island so that vehicle discharge from the rotary at a higher rate. IRC recommends radius of exit curve to be 1.5→2 time radius of entry curve. Rexit = (1.5 to 2)× Rentry Radius of Central Island IRC recommends radius of central island to be 1.33 time radius of entry curve. RC.I = 1.33× Rentry 42 Type of Road Design Speed V(kmph) Radius (m) Rural 40 20-35 Urban 30 15-25
  • 43.
    Width of CarriagewayAt Exit & Entry As per IRC width at entry and exit for different lane of approach road are as follows. For Rural Road For Urban Road 43 No of lanes Width of Carriage Way at entry & exit (m),e1 2 6.5 3 7 4 8 6 13 No of lanes Width of Carriage Way at entry & exit (m),e1 2 7 3 7.5 4 10 6 15 Width of non-weaving section The width of non-weaving section of the rotary should be equal to the widest single entry into the rotary and should generally be less than the width of the weaving section(W>e2). Width & Length of Weaving Section The width of non-weaving section (e2)of the rotary should be equal to the widest single entry into the rotary and should generally be less than the width of the weaving section(W). The width of weaving section (W) of the rotary should be one traffic lane wider than mean width of the entry & non weaving section, i.e W= e+3.5 m Length of Weaving Section L ≥ 4W
  • 44.
    Capacity Of Rotary Thepractical capacity of rotary is dependent on the min capacity of the individual weaving section and is given by following expression, Qp=PCU/hours. Where, e= (e1+e2)/2 = average width of entry (e1) & width of non- weaving section (e2) L= Length of weaving section W= width of weaving section Note e/W = 0.4 → 1.0 W/L= 0.12 → 0.4 p= Weaving Ratio Where, a = Left turning traffic moving along left extreme lane b = Crossing/Weaving traffic turning towards right while entering to the rotary c = Crossing/Weaving traffic turning towards left while leaving rotary d = Right turning traffic moving along right extreme lane 44
  • 45.
    ◉ Conditions toapply the above formula of capacity of rotary are: 6 m ≤ width of weaving section (w) ≤ 18m e/W = (0.4 – 1) W/L = 0.12 – 0.4 p = (0.4 – 1) L = 18 – 90m 45
  • 46.
    2.Grade Separated Intersection-Grade separation structures that permit the cross flow of traffic at different levels without interruptions. Transfer of route at grade separation or turning facilities are provided by “INTERCHANGE” which may be of following types. Interchange can also be classified on the basis of shape as follows ◉ Diamond interchange ◉ Trumpet interchange ◉ Partial Cloverleaf interchange ◉ Full Cloverleaf interchange 46
  • 47.
    Advantages of GradeSeparation ◉ There is increased safety for turning traffic and by indirect interchange ramp even right turn movement is quite easy and safe. ◉ There is overall increase in comfort and convenience to the road users. ◉ Stage constructions of additional ramps are possible after the grade separation structure between main roads are constructed. Disadvantages of Grade Separation ◉ It is very costly to provide complete grade separation and interchange facilities. ◉ Construction of grade separation is difficult and undesirable in the area where there is limited right of way. ◉ In flat or plain terrain, grade separation may introduce undesirable sags in the vertical alignment. 47
  • 48.
    Traffic Sign ◉ Atraffic sign is a device that is installed on a fixed or portable support and conveys a specific message using words or symbols. Traffic signs should be set in such a way that they are easily seen and recognized by road users. Classification of Signs ◉ Traffic sign are divided into 3 categories. ◉ Regulatory/Mandatory Signs ◉ Warning Sings ◉ Informatory Sign ◉ There are three basic types of traffic sign: signs that give orders, signs that warn and signs that give information. Each type has a different shape. Circles give orders, Triangles warn and Rectangles inform. ◉ A further guide to the function of a sign is its color. Blue circles give a mandatory instruction, such as “Compulsory Turn Left” etc. Blue rectangles are used for information signs. All triangular signs are red. ◉ There are a few exceptions to the shape and color rules, to give certain signs greater prominence. Examples are the “STOP” and “GIVE WAY”. 48
  • 49.
    Regulatory / MandatorySigns ◉ Regulatory or Mandatory signs are used to educate road users of specific laws and regulations in order to ensure traffic safety and flow. Violating these signs is a criminal offence. ◉ Shape → Circular (Few exceptions to the shape and colour rules. Examples are the “STOP” and “GIVE WAY”.) ◉ The Regulatory signs are classified under the following sub-heads: ◉ Stop and Give-way signs ◉ Prohibitory signs ◉ Speed Limit and Vehicle Control Signs ◉ No Parking and NO Stopping signs ◉ Compulsory Direction Control and Other Signs ◉ Restriction Ends sign 49
  • 50.
    Warning/ Cautionary Sings ◉These signs are used to advise road users of upcoming road conditions at a suitable distance in advance. Warning signs are also known as cautionary signs. The warning signs are shaped like an equilateral triangle with an upward pointing apex. ◉ Shape → Triangle ◉ The symbols are black and have a white background with a red border 50
  • 51.
    Informatory Sign ◉ Informatorysigns are provided to guide the road users about the routes, destination, direction, roadside facilities which make travel easier, safe and pleasant. ◉ Shape → Rectangular ◉ The Informatory Sign are classified under the following sub-heads: ◉ Direction and Place Identification signs ◉ Facility Information signs ◉ Other Useful Information signs ◉ Parking sings ◉ Food Gauge ◉ IRC recommendations for the design of traffic signs: ◉ On high-speed routes, put up large signage. ◉ Use no more than three words. ◉ Reflectize of illuminate the signs to be read at night. ◉ The size of the letters on the sign and the speed of the cars will determine where the signs are placed. ◉ Two signs for different purposes should not be placed on the same sign post and should, if possible, be separated by at least 30 meters. ◉ Location of the signs with respect to the carriageway. 51
  • 52.
    Road Marking ◉ Roadmarking or traffic markings are made of lines, patterns, words, symbols or reflectors on the pavement, kerb, sides of islands or on the fixed objects within or near the roadway. A road marking is a safety device used on a road. Traffic markings may be called special signs intended to control, warn, guide or regulate the traffic. The markings are made using paints in contrast with color and brightness of the pavement or other background. Light reflecting paints are also commonly used for traffic marking. To ensure that the markings are seen by the road users, the longitudinal lines should be at least 10 cm thick, and the transverse lines should be made in such a way that they are visible at sufficient distance in advance to give road users adequate time to respond. Functions of Road Markings ◉ The main functions of the road markings are to guide the safe and smooth flow of traffic in the following ways: 52 ◉ Segregation of traffic ◉ Stop and Go ◉ Give way instruction ◉ Overtaking or not ◉ Two lanes to one lane/ lane traffic ◉ Inter-vehicle distance ◉ Parking zone or no parking ◉ Speed indication ◉ Direction ◉ One way ◉ Pedestrian crossing ◉ Type of vehicles allowed
  • 53.
    • Types ofRoad Marking • Pavement Marking • Kerb Marking • Object Marking • Reflector Unit Marking • Pavement Marking-Pavement markings are made generally with white color & yellow color marking are used to indicate parking restriction. Some of the common types of pavement marking are given below: • Centre Lines-These are meant to separate the opposing streams of traffic on undivided two-way roads. • Lane Line-Lines are drawn to designate traffic lanes. These are used to guide the traffic and to properly utilize the carriageway. • Edge Lines-Indicate carriageway edge of rural road which have no kerb stones along edge. 53
  • 54.
    No Passing ZoneMarking ◉ These are marked to indicate that overtaking is not permitted. Turn Markings ◉ These are useful near intersection to designate proper lateral placement of vehicles before turning to the different directions. Stop Line ◉ These are meant for vehicles to stop near the pedestrian crossing, signalized intersection etc. where the vehicles have to stop and proceed. Crosswalk Lines ◉ The particular places where pedestrian are to cross the pavement are properly marked by the pavement markings. The width of pedestrian crossing may be between 2.0 and 4.0 m depending on local requirements. 54
  • 55.
    Road Delineators • Roaddelineators is provide visual assistance to drivers about the alignment of a road ahead, especially at night. • Reflectors are used on delineators for better nigh visibility. Three types of Road delineators • Roadway Indicators • Hazard Markers • Object Markers 55
  • 56.
    Traffic Signals Traffic signalsare control devices which could alternately direct the traffic to stop and proceed at intersections using red and green traffic light signals. The main requirement of traffic signals are ◉ It should draw the attention of road user. ◉ It should provide meaning & time to respond. ◉ It should have minimum waste of time. Type of Traffic Signals ◉ The signals are classified into the following types: ◉ Traffic Control Signals ○ Fixed-time Signal ○ Manually Operated Signal ○ Traffic Actuated (automatic) Signal ◉ Pedestrian Signal ◉ Special traffic Signal Traffic Control Signals ◉ Traffic Control Signals have three colored light glows facing each direction of traffic flow. The Red light is meant for “Stop“, Green light indicates “GO” and the Amber light allows the clearance time for the vehicles which enter the intersection area by the end of green time. 56
  • 57.
    Traffic control signalsare of three types: ◉ Fixed-time Signal In Fixed Time Signal the timing of each phase of the cycle is predetermined base on the traffic studies. The main drawback of this is that some times the traffic flow on one road may be almost nil and traffic on cross road may be quite heavy but signal operates with fixed timings. ◉ Traffic Actuated (automatic) Signal Traffic actuated signals are those in which the timings of phase and cycle are changed according to traffic demand. ◉ Semi-actuated Signal is a signal whose timing (cycle length, green time, etc.) is affected when vehicles are detected (by video, pavement embedded inductance loop detectors, etc.) on some, but not all, approaches. This mode of operation is usually found where a low-volume road intersects a high-volume road. In such cases, green time is allocated to the major street until vehicles are detected on the minor street: the the green indication is briefly allocated to the minor street and then returned to the major street. ◉ Fully Actuated Signal is a signal whose timing (cycle length, green time, etc.) is completely influenced by the traffic volumes, when detected, on all of the approaches. Fully actuated signals are most commonly used at intersections of two major streets. ◉ Manually Operated Signal These signals are operated manually and not commonly used. In these types of signals, the traffic police watches the traffic demand from a suitable point during the peak hours at the intersection and varies the timings of these phases and cycle accordingly. 57
  • 58.
    Pedestrian Signal ◉ Itis used to give the right of way to pedestrians to cross a road when the vehicular traffic shall be stopped by stop signal. Special Traffic Signal ◉ Special traffic signal such as “FLASHING BEACONS” are meant to Warn the traffic. When signal is flashing red then the vehicles shall stop before entering the nearest crosswalk at an intersection. ◉ While flashing yellow signals are caution signals meant to signify that drivers may proceed with caution. 58 Pedestrian Signal Special Traffic Signal
  • 59.
    Important Terminology ofTraffic Signals 1.Cycle-A signal cycle is one complete rotation through all the indications provided. (Red, Green, Amber) 2.Cycle Length -It is the time in seconds that it takes a signal to complete one full cycle of indication ie. the time interval between the starting of green for one approach till next time the green starts. 3.Interval-It indicates the change from one stage to another. There are two types of interval: Change Interval: It is also called yellow time and it indicates the interval between green and red Signal. Clearance Interval: It is also known as all red time and is included after each yellow interval indicating a period during which all signal phases shows red and it is used for clearing of vehicles at the intersections. 4.Green Time-It is provided to allow traffic flow through the intersection. It is designed on the basic of traffic volume of given road. It is the actual time duration the green signals is turned on. 5.Red Time-It is provided to stop the traffic flow on the intersection. It is designed on the basic of traffic volume of cross road. It is the actual time duration the red signals is turned on. 6.Amber Time-It is clearance time provided after the green time, just for clearance of traffic so that traffic on cross road can be started. 59
  • 60.
    Intelligent transportation systems(ITS) ITS technologies include state-of-the-art wireless, electronic, and automated technologies. Collectively, these technologies have the potential to integrate vehicles (transit, trucks, and personal vehicles), system users, and infrastructure (roads and transit). Automated and in-vehicle technologies include precision docking for buses, automated guideways, and collision avoidance systems. Many ITS technologies can help to optimize trips (route guidance), diminish unnecessary miles traveled, increase other mode use, reduce time spent in congestion, reduce dependence on foreign oil, and improve air quality. Furthermore, when ITS technologies are applied to system management (transit and highways) and vehicle design, they can reduce fuel consumption by ◉ facilitating optimal route planning and timing; ◉ smoothing accelerations/decelerations and stop-and-go driving ◉ reducing congestion; ◉ enabling pricing and demand management strategies; ◉ increasing the attractiveness of public transportation mode use; ◉ adjusting vehicle transmission for varying road conditions and terrain; ◉ facilitating small platoons of closely spaced vehicles (i.e., safer vehicles could enable weight reduction without compromising occupant safety). 60
  • 61.
    Although ITS technologiesare still in the early phase of deployment, many have shown the potential to reduce energy use. During the past 10 years or so, fuel consumption impacts of the following ITS technologies have been studied: (1) traffic signal control, (2) traffic management and surveillance (e.g., ramp metering), (3) incident management, (4) electronic toll collection (ETC), (5) traveler information, (6) transit management, (7) commercial vehicle operations (CVO), (8) vehicle control technologies. They are the focus of this article. Nevertheless, ITS impacts, including benefits, unintended consequences, and aggregate effects, are still not well understood. The field of intelligent transportation systems, energy consumption impacts, current measurement tools, and early findings are discussed in this article. 61
  • 62.
    ◉ bus rapidtransit (BRT) Seeks to improve bus service by reducing travel time and providing enhanced rider information; exclusive rights-of-way, bus lanes, adjusting stop locations, wider doors, preboarding payment, and supportive land use policies contribute to BRT improvements ◉ electronic toll collection (ETC) Enables the instant payment of highway tolls when a vehicle passes through a toll station via an electronic roadside antenna (or reader) and a pocket-sized tag containing a radio transponder (typically placed inside a vehicle’s windshield); the toll tag transponder transmits radio frequencies to the toll reade ◉ traveler information Provides the traveling public with information regarding available modes, optimal routes ◉ commercial vehicle operations (CVO) The application of electronic and wireless intelligent transportation systems technologies to address a range of trucking industry concerns; CVO approaches include border crossing clearance and safety via electronic clearance and manifesting, automatic vehicle location, vehicle- tofleet management center communications, on-board safety diagnostics to enable more effective roadside safety insp ◉ intelligent transportation systems (ITS) A wide range of technologies—including electronics, information processing, wireless communications, and controls—aimed at improving safety, efficiency, and convenience of the overall surface transportation network ◉ transit management Consists of four key areas: (1) transit vehicle tracking, (2) fare payment, (3) traveler information, and (4) personalized public transportation alternatives; transit vehicle tracking includes communication 62
  • 63.
    Road drainage ◉ Roaddrainage includes the removal or control of surface water and subsurface water away from the road surface and the sub grade that support it, one part of the rainwater flows to the ground or road surface, while the other part flows into the ground and reaches the groundwater table, raising its level. ◉ It includes interception and diversion of water from the road surface and sub grade. Purpose of road drainage: ◉ Road drainage maintains the surface of the road and its foundation as dry as possible with water. ◉ It maintain the stability and durability of the road. ◉ A good drainage system is required to maintain highway transportation at a minimal cost. Requirements of a Good Drainage System A good drainage system should prevent the following ill-effects of excess surface water and of ground water on the pavement and on the subgrade: 1.Reduction of the strength of the pavement. 2. Spoiling the pavement surface by the formation of pot-holes and ruts. 3. Seeping of surface water through the pavement layers, shoulders and the sides into the subgrade. 4. Reduction in the bearing power of the subgrade through continued presence of water. 5. Volume changes in the subgrade and consequent settlements and deleterious effects. 63
  • 64.
    6. Soil erosionaround the pavement. 7. Slope failures in the case of cuttings and embankments for the roads. 8. Capillarity and frost action, weakening the subgrade. TYPES OF ROAD DRAINAGE 1.SURFACE DRAINAGE: ◉ A system in which road surface water is collected and disposed within the roadway, it is called surface drainage. ◉ This system prevents surface water flowing from the surface of the pavement to the shoulders into the sub- grade of the road pavement or any other layer. ◉ Functions of surface drainage: ◉ To stop the drainage of water from the road surface. ◉ To keep the road surface dry with water. ◉ The flow of water collected by gravity to a nearby natural stream or river. ◉ To increase the stability of all types of pavement 64
  • 65.
    1.Side gutter: ◉ Thedrain provides a parallel to the roadway so that collecting and disposing of surface water is called a side gutter. ◉ Surface drainage is efficiently done by providing a side gutter or side drain in the embankment and cuttings. ◉ The section of the side gutter is normally trapezoidal or triangular in cutting. ◉ Side drains are usually provided parallel to roads, the design depth of side drains is low and the road is subjected to light traffic. Function of side gutter: ◉ The main function of the side gutters is to collect surface water. ◉ These drains eventually connect with the natural stream i.e. river. ◉ This side gutter can be cheap, easily constructed, and maintained but it gives an unpleasant look due to the deep ditch, so is undesirable where traffic is heavy. 65
  • 66.
    2.Catch water drains: ◉Additional gutters or road drainage are provided parallel to the road at high levels for the collection and disposal of surface water are known as water drains. ◉ Since the sloping land has a higher water content, it acquires a higher velocity as it approaches the gutter. ◉ This can cause the ground to sink and the drain can also be damaged, therefore water drains are provided exclusively on sloping ground which goes near the roadside drain. Functions of catch water drains: ◉ The catchwater drain accepts a large amount of surface water flow and also breaks the continuity. ◉ In this way, the flow reduces the velocity of the water thus prevents erosion, landslides and thereby protecting the side gutter. ◉ It also helps to reduce the size. ◉ If surface water flowing from high-level land to the road is large, it is desirable to take this water at regular intervals then this water flow through the embankment of the road through a pipe drain. 66
  • 67.
    DRAINAGE OF CITYOR URBAN ROADS ◉ The surface drainage of city or urban roads is radically different than that of the rural highways. In urban roads, the land width is limited and the open drains cannot be provided as they are unsightly, occupy more space, and serve as a source of danger to the traffic. The underground drains or sewers are, therefore, an essential requirement of street construction and are not so often necessary on rural highways. ◉ Following are the two commonly adopted ways of providing drainage to the urban roads: (1) Catch basins (2) Inlets. 1. Catch basins: ◉ A catch basin is a structure in the form of a chamber which is provided along the sewer line to admit clear rain water free from silt, grit debris, etc into the combined sewer Is provision on the sewer line serves the following two objects. ◉ It prevents the entry of silt, grit, debris, etc contained in the rain water, ◉ It prevents the escape of sewer gas. 67
  • 68.
    2. Inlets: An inletis an opening through which a stormwater is admitted and conveyed to the stormwater sewer. The inlets are located or placed by the sides of roads at a distance of about 30 m to 60 m. The inlets are so located that storm water is collected in a short period and there is no flooding or accumulation of a huge quantity of storm water on the roads. The inlets are connected to nearby manholes by pipeline 68
  • 69.
    2.SUB-SURFACE DRAINAGE ◉ Whenthe system drains water from the pavement under which it is collected and removed, it is called subsurface drainage. ◉ Sub-surface drainage is used exclusively to control the moisture of all types of road sub-grades. ◉ if the moisture that accumulates in the sub-soil is excessive, the road structure weakens therefore it is more necessary to control the moisture of the road sub-grade. Functions of sub-surface drainage: ◉ To control the moisture of road sub-grades. ◉ Also maintains the carrying capacity of subgrade soil by preventing water ingress into it. ◉ To reduce capillary growth, water sometimes rises to a sub-grade from groundwater due to ◉ This can be controlled by introducing a cut-off layer of granular material or impermeable bituminous layer. 69
  • 70.
    ADVANTAGES & DISADVANTAGESOF ROAD DRAINAGE ◉ Excess water that accumulation above the ground can create an environment that encourages mosquitoes to breed. ◉ Stationary water can make the soil dirty that cause corrosion. A drainage system can solve this problem by removing toxins from your yard. DISADVANTAGES OF ROAD DRAINAGE: ◉ A higher initial cost is required. ◉ Repair works are costly and inconvenient. 70
  • 71.
  • 72.
    ◉ Traffic Engineeringand Management (iitb.ac.in) ◉ NPTEL :: Civil Engineering - Traffic Engineering & Management ◉ Traffic Engineering- Traffic Studies And Analysis- Traffic Volume Study & Traffic Speed Studies | ESE NOTES ◉ Traffic Control Devices & Regulation – Traffic Sign & Road Marking (https_esenotes.com) 72