Download as PDF, PPTX

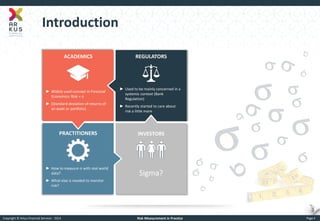

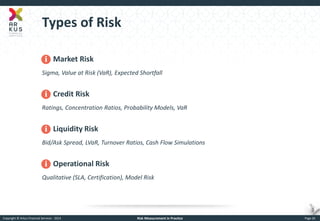
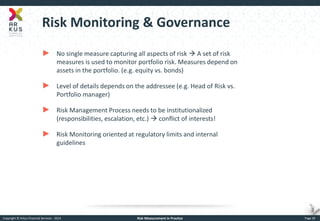

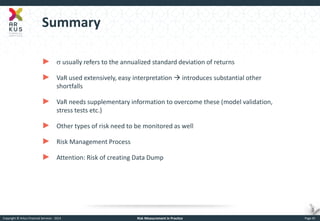


The document provides an overview of risk measurement in financial economics, focusing on the measurement of volatility (sigma), Value at Risk (VaR), and various risk types including market, credit, liquidity, and operational risk. It discusses methods for calculating volatility and VaR, as well as the importance of robust risk monitoring and governance practices. Overall, it emphasizes that no single measure captures all risks, necessitating a diverse set of risk assessment tools.


![Topic 4[1] finance](https://cdn.slidesharecdn.com/ss_thumbnails/topic41-131107182635-phpapp02-thumbnail.jpg?width=640&height=640&fit=bounds)


