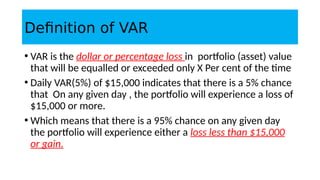
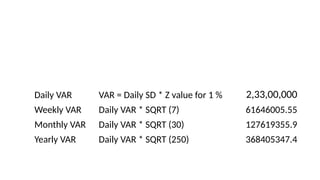
1. Value at Risk (VaR) is a measure of the maximum potential loss of a portfolio over a given period of time and at a given confidence level.
2. VaR was introduced in the 1990s as a tool to measure risk in financial portfolios and determine adequate capital levels. It has since become widely used by financial institutions.
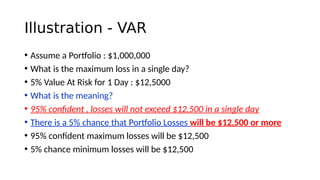
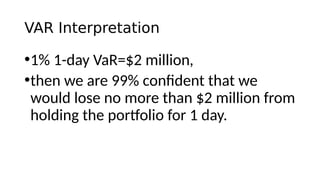
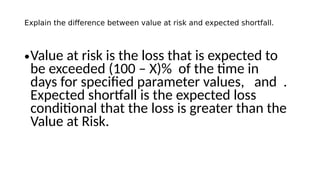
3. VaR estimates the loss of a portfolio that will not be exceeded with a given probability, usually 95%, over a specific time period like one day. For example, a one day, 95% VaR of $1 million means there is a 5% probability of losing more than $1 million on a given day.