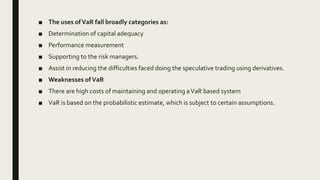
Value at Risk (VaR) is a statistical technique used to measure and quantify the level of financial risk within a firm, portfolio, or position over a specific time frame. It aims to quantify, with a single number, the maximum potential loss that could occur over a given time period at a given confidence level. There are different approaches to calculating VaR such as variance-covariance, historical simulation, and Monte Carlo simulation. VaR is widely used by banks and other financial institutions to monitor and control their risk exposure and capital adequacy. However, it does have some weaknesses as the results can vary depending on the underlying assumptions and there are costs associated with maintaining a VaR system.
GIÁO ÁN DẠY THÊM (KẾ HOẠCH BÀI BUỔI 2) - TIẾNG ANH 8 GLOBAL SUCCESS (2 CỘT) N...
Value at risk
1. Value at Risk (VaR)
By
Dr. Deepika Krishnan
Assistant Professor
School of Management
Presidency University, Bangalore
2. ■ Risk Management
■ There is significant developments in risk management that how to measure the risk and then
incorporate the same into a single variable.
■ The notion of risk capital has become the standard of choice among regulators and bankers.
■ Therefore, value at Risk (VaR) technique has become a standard method, in the derivatives
market assisting the senor management to understand the risk exposure of a particular
derivative asset.
■ Derivative is a contract, which derives its value from the prices, or index of prices of
underlying securities.
3. ■ Value at Risk (VaR) technique has become a standard method, in the derivatives market assisting the
senior management to understand the risk exposure of a particular derivative asset or securities .
■ There is no standard approach which can be exclusively used for measuring the VaR in a firm, funds or
portfolio.
■ It is important to note that VaR is sensitive to the assumptions made and the approach followed by the
expert.
■ Approaches:
■ The Variance-Covariance Approach
■ Historical Simulation Approach
■ Monte Carlo Simulation Approach
4. ■ Value at Risk (VaR)
■ The VaR is a statistical concept it is an attempt to answer a question, “the most that can be
lost with a given degree of confidence”.
■ Value at Risk can be used by any entity to measure its risk exposure.
■ It is used most often by commercial and investment banks to capture the potential loss in
value of their traded portfolios from adverse market movements over a specified period
■ In 1995, J.P. Morgan provided public access to data on the variances of and covariances
across various security and asset classes
■ Allowed software makers to develop software to measure risk. It titled the service
“RiskMetrics” and used the term Value at Risk to describe the risk measure that emerged
from the data.
■ VaR has becomes the established measure of risk exposure in financial service firms and has
even begun to find acceptance in non-financial service firms also.
5. ■ The Value at Risk measures the potential loss in value of a risky asset or portfolio over a
defined period for a given confidence interval.
■ In other words, what maximum amount one can lose from this particular set of holdings:
within the next specified period (a day or week or month or quarter), at a particular pre-
determined confidence interval.
■ The commonly used confidence level is 95% confidence level. However, other confidence
levels are also used, such as 90% and 99% confidence levels. It is based on Standard Normal
Distribution, where Z value is the z-score.
Confidence Interval ZValue
90% 1.645
95% 1.960
99% 2.576
6.
7. ■ The VaR calculation is aimed at making a statement of the following form:
– “We are X per cent certain that we will not lose more than V rupees in the next N
days” where V is VaR of the portfolio, X is the confidence level and N is the time
horizon.
■ Further, it is important to note that the probability assigned in VaR is not associated
with any particular event, rather it could cover any event that could cause such a loss.
■ It means the loss might be caused by changes of prices of fundamental risk factors like
changes in foreign exchange rates, interest rates, commodity price fluctuations, changes
in stock prices, changes in volatility, etc.
■ It is concluded that VaR is based on 3 elements…….
■ VaR = Market Value x Sensitivity x Volatility
■ Here, market value signifies the current market price of the stock. Sensitivity is the
standard deviation and volatility denotes the z score under normal distribution (90%,
95% or 99% confidence interval)
8. ■ Parameters of VaR
■ Following are the important parameters which would should be considered for measuring the VaR:
1) Time Horizon: The liquidity position of the markets is important factor for deciding the time horizon. Time
taken to liquidate a position is generally varies from one market to other. The firm can estimate VaR based on
shorter and longer holding period like one day, one month, one week or one year.
2) Confidence Interval: The confidence interval refers to the percentage of time the firm should not loose than
the VaR amount. VaR is computed at different confidence interval like 90%, 95% or 99%. The confidence
interval is based on mean and standard deviation.
3) Data Series: The nature of data requires for estimation of VaR is an important issue. Both longer and shorter
period are frequently used in such estimation.
4) Mapping: While calculating VaR, an important parameter to be used as instrument. The representative
approach for such instrument known as mapping. It means estimating VaR requires that each individual
position gets associated to its relevant market factors.
For example, a long position in Indian Treasury Bond is equivalent to a long position on the rupee exchange
rate, a short position on Indian rupee, etc.
9. ■ Computation of VaR -Variance-Covariance approach
■ Several approaches have been suggested by the experts to measure VaR. This approach is advanced by J.P.
Morgan’s risk metrics model.
■ This is also known as the ‘delta-normal method’.
■ This method uses the volatility of risk factors in the past and correlation between changes in their values.
■ The major assumption in this approach is that the returns for each of the assets are normally distributed. The
formula used here is:
■ Portfolio VaR = wi
2
σi
2
+ wj
2
σj
2
+ 2wiwjρij
■ Were,
𝑤𝑖 = The weight for stock 1
𝑤𝑗 = The weight for stock 2
𝑤𝑧 = The weight for stock 3 (example)
𝜎𝑖 = The standard deviation for stock 1 returns
𝜎𝑗 = The standard deviation for stock 2 returns
𝜌𝑖𝑗 = The covariance for the two stocks returns
10. ■ Illustration 1
■ Ram wants to calculate VaR for an investment in SBI. The price for SBI stock is Rs. 300
per unit, its standard deviation for monthly returns is 10%, and he would like a 90%
confidence level for the greatest monthly losses for this stock. (z score=1.645 under 90%
confidence level)
■ Solution
■ VaR = Market Value x Sensitivity x Volatility
■ = 300 x 0.10 x 1.645
■ = 49.35
■ This means that 90% of the time, Ram will not have a monthly loss greater than 49.35
per share.
■ 49.35 per unit is the maximum loss will be faced by Ram.
11. ■ Illustration 2
Assuming that agent Rs. 1,00,000 portfolio contains Rs. 60,000 worth of Stock X and Rs. 40,000 worth of stock Y. Computing the
VaR of the same with 90% confidence level over the coming: Day, Month and Year. Given: 𝑤𝑖 =0.60, 𝑤𝑗 =0.40, 𝜎𝑖 = 0.016284, 𝜎𝑗
= 0.015380, 𝜌𝑖𝑗= -0.19055. (1.645 is the Z-score value at 90% confidence level).
Solution:
Portfolio VaR = wi
2
σi
2
+ wj
2
σj
2
+ 2wiwjρij
= √ 0.60^2 x 0.016284^2 + 0.4^2 x 0.015380^2 + 2 x 0.6 x 0.4 x -0.19055 x 0.016284 x 0.015380
=0.01144627
=1.144627%
■ The portfolio VAR over agent DAY, VaR = (1,00,000)(1.645)(0.01144627) =1.88291
■ The portfolio VAR over agent MONTHV VaR = (100000)(1.645)(0.01144627√22) =8831.638
■ The portfolio VAR over an YEAR, VaR = (100000)(1.645)(0.01144627√252) =29890.29
■ Note:
■ √22 signifies trading day in a month
■ √252 signifies trading day in a year
■ VaR = Market Value x Sensitivity x Volatility
12. ■ The uses ofVaR fall broadly categories as:
■ Determination of capital adequacy
■ Performance measurement
■ Supporting to the risk managers.
■ Assist in reducing the difficulties faced doing the speculative trading using derivatives.
■ Weaknesses ofVaR
■ There are high costs of maintaining and operating aVaR based system
■ VaR is based on the probabilistic estimate, which is subject to certain assumptions.