Most construction companies operating in the global construction industry would undertake international projects to maximize their profitability through benefitting from the new attractive markets and reducing the dependence upon local markets. As a result of the nature of construction works the company and project's conditions actually include massive risks and uncertainty. So the risk sensitivity of projects costs should be assessed in a realistic manner. The comprehensive risk assessment method was introduced as a decision making supporting tool to be employed for international constructive projects through applying a risk model that will aid the procedures of evaluating risks and prioritizing such projects and assessing risk contingency value. Both the Analytic Hierarchy Process (AHP), applied for evaluating risk factors weight (likelihood), and FUZZY LOGIC approach, applied for evaluating risk factors influence (Risk consequences) employing software aids such as EXECL and MATLAB software, were used for developing the risk model. The reliability of the developed software has been verified by applications on a real construction projects. The proposed methodology and decision support tool have been proved to be reliable for the estimation of cost overrun resulting from risk on basis of actual final reports of projects. Six actual case studies from different countries were chosen to determine the highest risk factors and to implement the designed models, test their results and evaluate risk cost impact. The proposed models result showed that: the highest and lowest risk contingency percentage of 48 % and 16 % were in Project no (5), (6) respectively in Egypt. On the other hand, the projects no (1, 2, 4,7) in Saudi Arabia, UAE, Libya and Jordan, the risk contingency of 29%, 39%, 20% and 28% respectively. The actual results are close to those of the proposed program.
EFFECTIVE RISK MANAGEMENT IN CONSTRUCTION PROJECTSvivatechijri
Risk management is a step to make construction projects more efficient and practical such that
uncertainties should be identified before occurring and changing into crisis and a balance should be made
between threats and opportunities. Accordingly, construction industry is one of the most important and job
creating industries in all countries. Compared to other economic-industrial sectors, construction management is
highly influenced by the perception and employment of risk management concept. Additionally, there are
abundant risks in such activities since Construction projects activities are very complex and various. Hence, it
seems necessary to evaluate the proper use of risk management in various stages of Construction projects life
cycle. In this regard, the present study attempts to describe Construction projects life cycle step by step and
analyse the way of using risk management from designing stage to reviewing and supporting stage. The risk
management framework for construction projects can be improved by combining qualitative and quantitative
methodologies to risk analysis. The research work includes visiting and inspecting various construction sites,
analysing the field, collection of data, interpretation of data; using matrix method of risk calculation calculating
risk and providing effective measures to overcome it.
Time delay and cost escalation in construction worksvivatechijri
The objective of the present study was to measure the effects of delay in construction projects like cost-overrun, time-overrun, litigation and project abandonment. Data on the study variables has been collected through a structured questionnaire. Statistical tool One-Way ANOVA has been applied for data analysis and inference. It is found that delay in construction projects significantly lead to cost overrun, time overrun, litigation and project abandonment. The findings of the study also provide significant insights to the construction industry so that they may formulate strategies in order to avoid delay and its consequences. Moreover, the recommendations and limitations are discussed in the conclusion part of the study.
A study of various factors affecting risk management techniques in constructi...eSAT Journals
Abstract
Risk management is an important step which should not be neglect or ignore in every project. Because of various risk involved in construction, it is difficult to maintain time, cost and quality as planned. Project undertaken in the construction sector are widely complex and have often significant budgets, and thus reducing the risk associated should be a priority for each project manager. The main purpose of this paper is to identify the key risk factors that affect construction project. Questionnaires has been prepared incorporating of 50 difference questions after which questionnaire survey was conducted where the questions has been focused based on (component of questionnaire) the respondents were selected based on their susceptibility to the risk. The data was analyzed using the Statistical package for social sciences (SPSS) version 21. The result shows that the inadequate planning in construction project, poor adoption of site safety, supply and use of defective materials and poor resources management in construction project are all among the forefront key risk factors which affect construction project, meanwhile, effective recommendations have been developed to increases the efficiency, speedy and minimises risk and abortive work in construction project.
Keywords: Construction Industries, Construction Projects, Risks Management, Techniques
EFFECTIVE RISK MANAGEMENT IN CONSTRUCTION PROJECTSvivatechijri
Risk management can be directly related to the successful project completion as it is very much
essential. Project management literature describes a detailed and widely accepted risk management process,
which is constructed basically from four iterative phases: risk identification, risk estimation, risk response
planning and execution, often managing the risk management process is included. Construction project planning is
an essential element in the management and execution of construction projects which involves the definition of
work tasks and their interactions as well as the assessment of required resource sand expected activity durations.
The study, therefore, examined the awareness of professionals in construction industry of the various types of
planning techniques and tools used on construction sites, Questionnaires were administered on selected building
professionals (Project Managers, Engineers, Architects), and Contractors and Sub-contractors directly involved
in construction work on sites in planning and the use of planning tools and techniques as major tools for successful
project execution
EFFECTIVE RISK MANAGEMENT IN CONSTRUCTION PROJECTSvivatechijri
Risk management is a step to make construction projects more efficient and practical such that
uncertainties should be identified before occurring and changing into crisis and a balance should be made
between threats and opportunities. Accordingly, construction industry is one of the most important and job
creating industries in all countries. Compared to other economic-industrial sectors, construction management is
highly influenced by the perception and employment of risk management concept. Additionally, there are
abundant risks in such activities since Construction projects activities are very complex and various. Hence, it
seems necessary to evaluate the proper use of risk management in various stages of Construction projects life
cycle. In this regard, the present study attempts to describe Construction projects life cycle step by step and
analyse the way of using risk management from designing stage to reviewing and supporting stage. The risk
management framework for construction projects can be improved by combining qualitative and quantitative
methodologies to risk analysis. The research work includes visiting and inspecting various construction sites,
analysing the field, collection of data, interpretation of data; using matrix method of risk calculation calculating
risk and providing effective measures to overcome it.
Time delay and cost escalation in construction worksvivatechijri
The objective of the present study was to measure the effects of delay in construction projects like cost-overrun, time-overrun, litigation and project abandonment. Data on the study variables has been collected through a structured questionnaire. Statistical tool One-Way ANOVA has been applied for data analysis and inference. It is found that delay in construction projects significantly lead to cost overrun, time overrun, litigation and project abandonment. The findings of the study also provide significant insights to the construction industry so that they may formulate strategies in order to avoid delay and its consequences. Moreover, the recommendations and limitations are discussed in the conclusion part of the study.
A study of various factors affecting risk management techniques in constructi...eSAT Journals
Abstract
Risk management is an important step which should not be neglect or ignore in every project. Because of various risk involved in construction, it is difficult to maintain time, cost and quality as planned. Project undertaken in the construction sector are widely complex and have often significant budgets, and thus reducing the risk associated should be a priority for each project manager. The main purpose of this paper is to identify the key risk factors that affect construction project. Questionnaires has been prepared incorporating of 50 difference questions after which questionnaire survey was conducted where the questions has been focused based on (component of questionnaire) the respondents were selected based on their susceptibility to the risk. The data was analyzed using the Statistical package for social sciences (SPSS) version 21. The result shows that the inadequate planning in construction project, poor adoption of site safety, supply and use of defective materials and poor resources management in construction project are all among the forefront key risk factors which affect construction project, meanwhile, effective recommendations have been developed to increases the efficiency, speedy and minimises risk and abortive work in construction project.
Keywords: Construction Industries, Construction Projects, Risks Management, Techniques
EFFECTIVE RISK MANAGEMENT IN CONSTRUCTION PROJECTSvivatechijri
Risk management can be directly related to the successful project completion as it is very much
essential. Project management literature describes a detailed and widely accepted risk management process,
which is constructed basically from four iterative phases: risk identification, risk estimation, risk response
planning and execution, often managing the risk management process is included. Construction project planning is
an essential element in the management and execution of construction projects which involves the definition of
work tasks and their interactions as well as the assessment of required resource sand expected activity durations.
The study, therefore, examined the awareness of professionals in construction industry of the various types of
planning techniques and tools used on construction sites, Questionnaires were administered on selected building
professionals (Project Managers, Engineers, Architects), and Contractors and Sub-contractors directly involved
in construction work on sites in planning and the use of planning tools and techniques as major tools for successful
project execution
International Journal of Engineering Research and DevelopmentIJERD Editor
Electrical, Electronics and Computer Engineering,
Information Engineering and Technology,
Mechanical, Industrial and Manufacturing Engineering,
Automation and Mechatronics Engineering,
Material and Chemical Engineering,
Civil and Architecture Engineering,
Biotechnology and Bio Engineering,
Environmental Engineering,
Petroleum and Mining Engineering,
Marine and Agriculture engineering,
Aerospace Engineering.
Recently, Construction IQ conducted an online survey on construction project risk management. Some valuable statistics emerged from the results. Have a look at what your colleagues and peers in the industry had to say…
Insights on Research Techniques towards Cost Estimation in Software Design IJECEIAES
Software cost estimation is of the most challenging task in project management in order to ensuring smoother development operation and target achievement. There has been evolution of various standards tools and techniques for cost estimation practiced in the industry at present times. However, it was never investigated about the overall picturization of effectiveness of such techniques till date. This paper initiates its contribution by presenting taxonomies of conventional cost-estimation techniques and then investigates the research trends towards frequently addressed problems in it. The paper also reviews the existing techniques in well-structured manner in order to highlight the problems addressed, techniques used, advantages associated and limitation explored from literatures. Finally, we also brief the explored open research issues as an added contribution to this manuscript.
AN INTEGRATED PROJECT EVALUATION TOOL FOR PFI SEAPORT PROJECTSFredy Kurniawan
The evaluation of the financial viability for seaport projects is a critical activity for bidders and governments under traditional procurement or through private finance initiative (PFI). The aim of this research is to assist government agencies in
evaluating bids and making decision efficiently for seaport development projects through the use of an integrated project evaluation tool. The proposed tool is expected to integrate the results of the financial model and the risk sharing strategy. The
integrated project evaluation tool can be mutually used by the government agency and the sponsor(s). This paper discusses the proposed tool to be tested in future study. The research strategy uses literature review, questionnaire surveys, interviews, and document analyses in order to develop the proposed tool. The tool will be tested through case studies and experts’ opinion to validate its applicability and effectiveness. The main conclusion of this paper is that the knowledge gap between the sponsor(s) and the government agency can be improved if the government agency is provided with efficient tools that consider both the financial and the risk factors
affecting a new project.
The infrastructure construction sectors are usually complex. Zero risk construction projects are only an
assumption. The objective of this paper is to identify the risks factor associated with the urban infrastructure
construction projects causing delay. The research found that those risks are directly associated to clients,
contractors, sub-contractors that would cause delay in the construction work. Other factors are also
identified such as project, financial, political, technical, market risk, managerial, resource risk, and force
majeure. All risk factors affect the time, cost and quality performance of the construction project. From risk
management perspective, it is the process on which identifies the risks and analyzed with qualitatively and
quantitatively. All associated risks can treat by various mitigation processes and then mitigating method are
monitored to control the risks. Risk management distinguishes between success and failure of a project.
So, Nepal could use it effectively to meet its growing need of infrastructure and job opportunity
P
A
P
E
R
S
72 September 2009 ■ Project Management Journal ■ DOI: 10.1002/pmj
INTRODUCTION ■
A
ccording to the United Kingdom’s Royal Academy of Engineering, bil-
lions of pounds are wasted every year on new information technology
(IT) systems. Troubled public-sector IT projects such as the National
Health Service (NHS) National Programme for IT, the Child Support
Agency systems, and HM Revenue and Customs’ Tax Credits IT system have
attracted considerable negative press. They have overrun, cost millions of
pounds more than was budgeted, and, in some cases, have been cancelled
before their costs spiral even further out of control. Terms such as “nightmare”
and “disaster” tend to be attached to such projects. IT projects (the provision
of a service to implement systems and solutions, including a variety of hard-
ware and software products; (Howard, 2001) seem to be more problematic
than other types of projects, with a particularly high rate of failure (McGrew &
Bilotta, 2000; The Standish Group International, 2007; Whittaker, 1999).
Despite well-established best practice project management processes, project
managers appear to be ineffective in the light of such failure.
Organizations such as the Project Management Institute (PMI) and the
United Kingdom’s Association for Project Management (APM) promote best-
practice project management standards. As part of these standards, project risk
management is defined as the systematic process of identifying, analyzing, and
responding to risks. Risk is any project-related event, or managerial behavior,
that is not definitely known in advance but has the potential of adverse conse-
quences on a project objective (PMI, 2004). Project risk management claims to
enable project managers to effectively manage risk and minimize the adverse
influence of risk on the project outcome. However, we have found that IT proj-
ect managers often do not apply a process to manage risks. The reasons for this
vary. Nevertheless, the evidence behind this phenomenon is very scarce, often
descriptive, and inchoate. The purpose of this study was to investigate whether
best practice standards are applied, and if they are not, what reasons led the IT
project manager to decide not to actively approach and manage project risks.
The results show that IT project managers primarily face the problem of
cost justification. Facing costs and time constraints and the uncertainty of
the success of project risk management, they often decided not to actively
manage risks. However, with the benefit of hindsight, we see that such a
decision often turns out to be fatal. Not surprisingly, in projects where proj-
ect risk management is not used, a greater degree of risks materialize than in
those projects where the IT project manager does actively manage risks.
Project Risk Management
Risks may potentially endanger the ability of the project manager to meet
the predefined project objectives, such as scope, time, and cost; tasks may
The .
PORM: Predictive Optimization of Risk Management to Control Uncertainty Probl...IJECEIAES
Irrespective of different research-based approaches toward risk management, developing a precise model towards risk management is found to be a computationally challenging task owing to critical and vague definition of the origination of the problems. This research work introduces a model called as PROM i.e. Predictive Optimization of Risk Management with the perspective of software engineering. The significant contribution of PORM is to offer a reliable computation of risk analysis by considering generalized practical scenario of software development practices in Information Technology (IT) industry. The proposed PORM system is also designed and equipped with better risk factor assessment with an aid of machine learning approach without having more involvement of iteration. The study outcome shows that PORM system offers computationally cost effective analysis of risk factor as assessed with respect to different quality standards of object oriented system involved in every software projects.
A NEW MATHEMATICAL RISK MANAGEMENT MODEL FOR AGILE SOFTWARE DEVELOPMENT METHO...ijseajournal
This paper proposes a new mathematical model for estimating the cost of explicit Agile software
development risk management with its Impact Benefit s (savings/profits). This is necessitated by the fact
that despite the increase in the need for managing risks explicitly in medium-to-large scale agile software
development projects presently, there are no known ways to estimate explicit risk management
costs/benefits. With the proposed model, explicit risk management procedures alongside with risk
management estimation techniques is made known to Stakeholders who will be able to make the right
decisions on risk management costs and its impacts as well as when to utilise implicit or explicit risk
management. The proposed system proves to be feasible and dependable and is evidently capable of
enhancing the agile methods for use for all sizes of software projects while still maintaining the swiftness of
the agile process.
Insights of effectivity analysis of learning-based approaches towards softwar...IJECEIAES
Software defect prediction is one of the essential sets of operation towards mitigating issues of risk management in software development known to contribute towards enhancing the quality of software. There is evolution of various methodologies towards resolving this issue while learning-based methodology is witnessed to be the most dominant contributor. The problem identified is that there are yet many unsolved queries associated with practical viability of such learning-based approach adoption in software quality management. Proposed approaches discussed in this paper contributes towards mitigating this challenge by introducing a simplified, compact, and crisp analysis of effectiveness associated with learning-based schemes. The paper presents its major findings of effectivity analysis of machine learning, deep learning, hybrid, and other miscellaneous approaches deployed for fault prediction followed by highlighting research trend. The major findings infer that feature selection, data imbalance, interpretability, and in adequate involvement of context are prime gaps in existing methods. The paper also contributes towards research gap as well as essential learning outcomes of present review work.
Conceptual Cost Estimate of Libyan Highway Projects Using Artificial Neural N...IJERA Editor
It is well known that decisions at early stages of a construction project have great impact on subsequent project performance. Conceptual cost estimate is a challenging task that is done with limited information at the early stages of a project life where many factors affecting the project costs are still unknown. The objective of this paper is to support decision makers in predicting the conceptual cost of highway construction projects in Libya. Initially, the factors that significantly influence highway construction are identified. Then, an artificial neural network model is developed for predicting the cost. The network is trained and tested with a total of 67 projects historical data. Training of the model is administered via back-propagation algorithm. The model is coded ad implemented using MATLAB® to facilitate its use. An optimization module is also added to the Neural Network model with the objective of minimizing the error of the predicted cost. The model is then validated and the results show better predictions of conceptual cost of highway projects in Libya.
Risk management framework in Agile software development methodologyIJECEIAES
In software projects that use the Agile methodology, the focus is on development in small iterations to allow both frequent changes and client involvement. This methodology affects the risks that may happen in Agile software projects. Hence, these projects need a clear risk management process to reduce risks and address the problems before they arise. Most software production methodologies must use a framework for risk management, but currently, there is no such framework for the Agile methodology. Therefore, we present a risk management framework for projects that use the Agile methodology to help the software development process and increase the likelihood of the project’s success. The proposed framework states the necessary measures for risk management according to the ISO31000 standard at each stage of the Agile methodology. We evaluated the proposed framework in two running software projects with an Agile methodology by a number of expert experts. The results show that using our proposed framework increases the average positive risk reaction score by 49%.
RISK MANAGEMENT IN CONSTRUCTION PROJECTS AS PER INDIAN SCENARIOIAEME Publication
Construction industry is highly risk prone, with complex and dynamic project
environments creating an atmosphere of high uncertainty and risk. The industry is
vulnerable to various technical, sociopolitical and business risks. The track record
to cope with these risks has not been very good in construction industry. As a
result, the people working in the industry bear various failures, such as, failure of
abiding by quality and operational requirements, cost overruns and uncertain delays
in project completion. In light of this, it can be said that an effective systems of risk
assessment and management for construction industry remains a challenging task
for the industry practitioners. The aim of the this research is to identify and evaluate
current risks and uncertainties in the construction industry through extensive
literature survey and aims to make a basis for future studies for development of a
risk management framework to be adopted by prospective investors, developers and
contractors
Efficient Indicators to Evaluate the Status of Software Development Effort Es...IJMIT JOURNAL
Development effort is an undeniable part of the project management which considerably influences the
success of project. Inaccurate and unreliable estimation of effort can easily lead to the failure of project.
Due to the special specifications, accurate estimation of effort in the software projects is a vital
management activity that must be carefully done to avoid from the unforeseen results. However numerous
effort estimation methods have been proposed in this field, the accuracy of estimates is not satisfying and
the attempts continue to improve the performance of estimation methods. Prior researches conducted in
this area have focused on numerical and quantitative approaches and there are a few research works that
investigate the root problems and issues behind the inaccurate effort estimation of software development
effort. In this paper, a framework is proposed to evaluate and investigate the situation of an organization in
terms of effort estimation. The proposed framework includes various indicators which cover the critical
issues in field of software development effort estimation. Since the capabilities and shortages of
organizations for effort estimation are not the same, the proposed indicators can lead to have a systematic
approach in which the strengths and weaknesses of organizations in field of effort estimation are
discovered
Similar to Risk Contingency Evaluation in International Construction Projects (Real Case Studies) (20)
Lithological Investigation at Tombia and Opolo Using Vertical Electrical Soun...IJLT EMAS
Vertical electrical soundings (VES) was carried out in Opolo and Tombia all in Yenagoa local government area, Bayelsa state, Nigeria to understand the resistivity distribution of its subsurface which serves as a tool in investigating subsurface lithology. All VES sounding were stacked together to generate 1D pseudo tomogram and was subsequently interpreted. The interpreted VES curve results shows that Opolo consists of three layers within the depth of investigation. Sandy clay with mixture of silt make up the first layer (Top layer) with resistance value ranging from 24-63Ωm. The second layer is made up of thick clay with very low resistivity values ranging from 3-19Ωm. The third layer is sandyclay with its resistance value ranging from 26-727Ωm.Tombia also reveals that the area is in three layers within the depth of investigation. Sandy clay with a mixture of fine sand made up the first layer (Top soil) with its resistance values ranging from 40-1194Ωm. The second layer is made up of fine sand with resistivity value ranging from 475-5285Ωm. The third layer is made up of sandy clay/sand with its resistance value ranging from 24-28943Ωm.The results of the 1D pseudo tomogram also reveals that Tombia and Opolo consists of three layers within the depth of investigation and pseudo tomograms serves as a basis tool for interpreting lithology and identifying lithological boundaries for the subsurface
Public Health Implications of Locally Femented Milk (Nono) and Antibiotic Sus...IJLT EMAS
The study is to determine the PH and moisture content
of Nono sold in Port Harcourt , the prevalence of Pseudomonas
aeruginosa in Fura da nono and finally the antibiotic resistance
pattern of Pseudomonas aeruginosa isolated from the fermented
products. nono samples were purchased from Borikiri in
portharcourt township. A total of 20 samples were assessed to
determine their microbiological quality and to conduct antibiotic
susceptibility test. Moisture content and pH of the samples were
also assessed. Enumeration of the total viable bacterial count
(TVBC), Total coliform count (TCC) and Total Pseudomonal
count (TPC) were also assessed to determine the sanitary quality
of the product. The PH ranges between 2.99 to 3.89 while the
moisture content ranges between 80% to 88%. The result
obtained from the microbial culture indicated that a wide array
of microorganism were present in Fura da nono including species
of Bacilu, klebsiella, Pseudomonas Staphylococcus aureus,
Streptococcus, Lactobacillus and Escherichia coli.. The highest
TVBC, TCC and TPC were 9.8x10³
cfu/ml, 10x103
cfu/ml and
9.7x10³
cfu/ml respectively. Antibiotic susceptibility was
conducted using 12 broad spectrum antibiotics and compared
against a standard provided by the Clinical laboratory standard
institute (CLSI). Gentamycin, Ofloxacin and Levofloxacin
recorded 100% resistance , while Cotrimoxazole, Ciprofloxacin,
Vancomycin, Nitrofurantoin, Norfloxacin and Azithromycin
recorded 100% susceptibility as indicated by the complete clear
zone of inhibition.It was discovered that the absence of
regulatory agencies like National Agency for Food Drug
Administration and Control (NAFDAC) in the regulation of the
quality of the product was the cause of the high contamination,
since there were no quality control measures in its production
line .It was recommended that NAFDAC should provide a
standard operating procedure for local food producers and
should include them in their scope for regulation.
Bioremediation Potentials of Hydrocarbonoclastic Bacteria Indigenous in the O...IJLT EMAS
Hydrocarbon pollution Remediation by Enhanced
Natural Attenuation method was adopted to remediate the
hydrocarbon impacted site in Ogoniland Rivers State, Nigeria .
The research lasted for 6 months. Samples were collected at
monthly intervals . samples were collected intermittently
between Feb 2019 to July 2019 . Mineral salt medium containing
crude oil was used as a sole source of carbon and energy for the
isolation of hydrocarbonoclastic bacteria. Samples were
collected from the four (4) local government that made up
Ogoniland and they includes Khana(k), Gokana (G),Tai (T),
Eleme (E) and transported immediately to the laboratory for
analysis. The microbial and physicochemical properties of the
soil samples varied with the different local government areas.
Seven bacteria genera were isolated from the samples from the
four locations, viz, Pseudomonas, Lactobacter, Micrococcus,
Arthrobacter, Bacillus, Brevibacterium and Mycobacterium
were isolated and identified. the seven isolate were indigenous in
the study area. Nutrient were added to identified plots of
hydrocarbon pollution polluted site within the four local
government and they were able degrade hydrocarbon within a
short of period of time. Reassessment of physicochemical
parameter impacted site was used to judge the bioremediation
potentials of microorganism
Comparison of Concurrent Mobile OS CharacteristicsIJLT EMAS
It is challenging for the mobile industry to supply the best features of the devices with its increasing customer requirements. Among the progress of technologies, the mobile industry is the fastest growing; as it keeps pace with rapidly changing market demands. This paper compares between the currently available mobile devices based on its user interface, security, memory utilization, processor, and device architecture. The mobile products launched from 2015-19 are used for comparison. Current results after comparison with earlier study found that many mobile devices and features became obsolete in a short time span supporting the aggressive growth of mobile industry.
Design of Complex Adders and Parity Generators Using Reversible GatesIJLT EMAS
This paper shows efficient design of an odd and even parity generator, a 4-bit ripple carry adder, and a 2-bit carry look ahead adder using reversible gates. Number of reversible gates used, garbage output, and percentage usage of outputs in implementing each combinational circuit is derived. The CLA used 10 reversible gates with 14 garbage outputs, with 50% percentage performance usage.
Design of Multiplexers, Decoder and a Full Subtractor using Reversible GatesIJLT EMAS
This paper shows an effective design of combinational circuits such as 2:1, 4:1 multiplexers, 2:4 decoder and a full subtractor using reversible gates. This paper also evaluates number of reversible gates used and garbage outputs in implementing each combinational circuit.
Multistage Classification of Alzheimer’s DiseaseIJLT EMAS
Alzheimer’s disease is a type of dementia that destroys
memory and other mental functions. During the progression of
the disease certain proteins called plaques and tangles get
deposited in hippocampus which is located in the temporal lobe
of brain. The disease is not a normal part of aging and gets
worsen over time. Medical imaging techniques like Magnetic
Resonance Imaging (MRI), Computed Tomography (CT) and
Positron Emission Tomography (PET) play significant role in the
disease diagnosis. In this paper, we propose a method for
classifying MRI into Normal Control (NC), Mild Cognitive
Impairment (MCI) and Alzheimer’s Disease(AD). An overall
outline of the methodology includes textural feature extraction,
feature reduction process and classification of the images into
various stages. Classification has been performed with three
classifiers namely Support Vector Machine (SVM), Artificial
Neural Network (ANN) and k-Nearest Neighbours (k-NN)
Design and Analysis of Disc Brake for Low Brake SquealIJLT EMAS
Vibration induced due to friction in disc brake is a
theme of major interest and related to the automotive industry.
Squeal noise generated during braking action is an indication of
a complicated dynamic problem which automobile industries
have faced for decades. For the current study, disc brake of 150
cc is considered. Vibration and sound level for different speed
are measured. Finite element and experimentation for modal
analysis of different element of disc brake and assembly are
carried out. In order to check that precision of the finite element
with those of experimentation, two stages are used both
component level and assembly level. Mesh sensitivity of the disc
brake component is considered. FE updating is utilized to reduce
the relative errors between the two measurements by tuning the
material. Different viscoelastic materials are selected and
constrained layer damping is designed. Constrained layer
damping applied on the back side of friction pads and compared
vibration and sound level of disc brake assembly without
constrained layer damping with disc brake assembly having
constrained layer. It was observed that there were reduction in
vibration and sound level. Nitrile rubber is most effective
material for constrained layer damping.
The aim of this article is to device strategies for
establishing and managing tomato processing industry, which
aims to enhance the taste experiences on different tomato
products for the people. Management needed for a successful
business is analyzed in each and every aspect. The five important
steps in management- planning, organizing, staffing, leading and
controlling are applied in management of the industry. Planning-
In the planning process, activities required to achieve desired
goals are thought about. This process involves the creation and
maintenance of a plan, those include psychological aspects that
require conceptual skills. Organizing- Organizing is a systematic
processing in order to attain objectives of structuring,
integrating, co-ordinating task, and activities. Staffing- Staffing is
the process of acquiring, deploying, and retaining a workforce of
sufficient quantity and quality to create positive impacts on the
organization’s effectiveness. Leading- Communicating,
motivating, inspiring and encouraging employees are key aspects
of process of leading, task of which is towards a higher level of
productivity of organization. Controlling- Controlling measures
the deviation of actual performance from the standard
performance, discovers the causes of such deviations and helps in
taking corrective actions.
This paper deals with the functioning of a Propylene
Recovery Unit (PRU) in a chemical industry and the various
Managerial and Human Resource considerations that need to be
accounted for, in this process. This report discusses various
aspects that are to be considered, before initializing the setup of
PRU, ranging from a Management perspective. Mission and
objective was decided and subsequently the managerial model
was developed. Propylene is an indispensible raw material that
has a variety of end use. A detailed analysis pertaining to
propylene demand in the market along with major sources has
been incorporated in this paper. Emphasis has been placed on
the type of departmentation required. Managerial aspects of
various functions ranging from warehousing to quality control
have also been taken into consideration. Delegations of functional
departments have been defined to prevent redundancy of duties
and major managerial functions of Planning, Organizing,
Staffing, Leading and Controlling has also been discussed.
Internal and External factors that affect the company have been
analyzed through SWOT Analysis and MBO strategies are also
broadly classified. Finally, Total Quality Management and
strategies for adoption of Lean Manufacturing as also touched
upon briefly.
This business model is intended to provide an online
platform connecting the general public customers with the
producers of groceries and food products such as fruits,
vegetables, meat and dairy products. The producers are selected
based on their production methods and their quality. The model
obtains the demand from the customers and the supply is found
from the producers. The prices of the products are fixed
according to the supply and demand. The customers' orders can
be classified into two different categories: 1. Bulk orders and 2.
Recipe based. The orders are obtained in a bulk quantity or for a
certain period of time and the products are delivered
periodically as per the customer's need. This model eliminates
the requirements of conventional storage units and also controls
the quality of the products using scientific devices. This model
reduces the wastage of resources as it enables the customer to
estimate their requirements using the help of recipe based
ordering system and also keeps the price constant for the bulk
orders.
Home textile exports are market driven, which implies that they deal with what the foreign market wants and how the home textile exporter could fulfil it, or product driven, where they deal with what the exporter has to offer and how can an appropriate strategy be applied to find the targeted buyers in the foreign market. The requisites of these are that the exporter must know the export plan, production procedure and export documentations. Exporter also must know his/her operational capacity, organizational nature and structure. An attempt is made in this project to understand and examine the nature and structure of the organization of the S3P exports.
Almost 80% of the population are coffee lovers.
Kaffinite sunshine café is guaranteed to become the daily
necessity for all the coffee addicts. A place with good ambience
where people can escape from their daily stress and cherish with
a morning cup of coffee. Our café offers home style delicious
breakfast and snacks. We focus on finding the most aromatic
and exotic coffee beans. We have our branches in many cities of
Tamil Nadu. We have a romantic ambience which attracts youth.
Our café has spectacular interior designs with stupendous taste
of coffee. We have attached our menu which contains multicuisines
at attractive prices. In this paper, we have done SWOT
analysis of our café to know our strengths and weaknesses. We
have also analyzed our opportunities and threats from the
external environment
Management of a Paper Manufacturing IndustryIJLT EMAS
This project focuses on how a paper manufacturing industry looks like and how it operates. For better understanding purpose, we have taken a hypothetical situation here. We have discussed on various factors that are to be considered before constructing a plant. For example, what kind of proprietorship is suitable for this case? We have developed a SWOT Analysis for the plant, thinking about the pros and cons. This project can be a guide for a person who is willing to start up a new manufacturing plant. This report can be used to streamline your approach to planning by outlining the responsibilities of plant managers and external factors, as well as identifying appropriate resources to assist you with the construction of plant.
Application of Big Data Systems to Airline ManagementIJLT EMAS
The business world is in the midst of the next
revolution following the IT revolution – the Big Data revolution.
The sheer volume of data produced is a major reason for the big
data revolution. Aviation and aerospace are typical areas that
can apply big data systems due to the scale of data produced, not
only by the plane sensors and passengers, but also by the
prospective passengers. Data that need to be considered include,
but are not limited to, aircraft sensor data, passenger data,
weather data, aircraft maintenance data and air traffic data.
This paper aims at identifying areas in aviation where big data
systems can be utilized to enhance operational performances
improve customer relations and thereby aiding the ultimate goal
of increased profits at reduced costs. An improved management
model built on a strong big data infrastructure will reduce
operation costs, improve safety, bring down the cost and time
spent on maintenance and drastically improve customer
relations.
Impact of Organisational behaviour and HR Practices on Employee Retention in ...IJLT EMAS
I. INTRODUCTION
Roads are constituted as the most significant component of
India‟s Logistics Industry, accounting for 60 percent of
the total freight movement in the country. A majority of
players in this industry are small entrepreneurs running their
family businesses. As a result, Man Power Development
Investments that pay off in the longer term, have been
minimised respectively. Moreover, these businesses are
typically controlled severely by the proprietor and his / her
family and consequently, making it unattractive for the
professionals. Poor working conditions, Low pay scales
relative to alternate careers, poor or non-existent Manpower
Policies and prevalence of unscrupulous practices have added
to the segment's woes for seeking employment. Thus, it could
be rightly stated that the Transportation, Logistics,
Warehousing and Packaging Sector is considered an
unattractive career option and fails to attract and retain skilled
manpower. Many Organizations have failed to recognize that
Human Resources play an important role in gaining an
immense advantage in today‟s highly competitive Global
Business Environment. While all aspects of managing Human
Resources is important, Employee Retention continues to be
an essential part of Human Resource Management activity
that help the Organizations to achieve their goals and
objectives.
Sustainable Methods used to reduce the Energy Consumption by Various Faciliti...IJLT EMAS
The purpose of this article is to identify the energy
challenges faced by airports especially with regards to the energy
consumed by the terminal building and suggest suitable energy
conservation techniques based on what has already been
implemented in few airports around the world.
We have identified the various facilities and systems which are
responsible for a major share of the consumption of energy by
airport terminals and we have suggested measures to effectively
overcome these problems.
OVERVIEW OF THE COMPANY
Cake Walk sweets and savories
Cake Walk is India‟s No. 1 confectionery and cake
manufacturer with its products exported to over 20 countries
around the world. They are dedicated to the art of producing
innovative and delicious products for sweet lovers of all ages.
Cake Walk‟s products offer tantalizing experiences that sparks
the imagination in people who eat their candy. Of course, this
has been Cake Walk‟s goal since their inception in 1947.
Today, Cake Walk Candy continues to make some of the best
candy in India. They also are a responsible business venture
and contribute positively to the society with their “Learn to
bake” initiative to encourage households to earn by starting
their own small-scale businesses. Cake Walk products can be
enjoyed by kids and adults alike, and their products come in
an array of flavors, shapes and sizes.
Every individual in our planet is busy in his / her own
world these days. The busy schedules and work preoccupations
of many people hinder them from spending nominal amount of
time with their families.
To address this concern, we have come up with our MACH
Tours and Travels, our motto being, “Breaching the
Boundaries!” which aims at not only giving its customers the best
and most comfortable tour, but also an enjoyable and
memorable experiences.
We differ from our competitors in various ways. For a start, we
emphasize that our profit is not in the income from this business,
but in the satisfaction of our customers. Added to that, we focus
on improving the ease of travel, the luxury of trip, the quality of
time spent and the worth of pay.
There is a variety of customers we come across: some will want
their trip to be extravagant, while some require it to be cost
effective; some need a long vacation, while some choose just a
weekend away.
Our mission: In order to meet the desires of this large range of
people and to include all the factors of a hearty holiday, we have
devised our strategies and planned our processes, thus, setting us
apart from the others.
Our vision: As the main priority, a year from now, we target on
contenting as many customers as possible through our services.
The following sections of this document includes our roles in
planning, decision making, staffing, leading and communicating
in which we highlight various aspects of our organization,
including the pros and cons of travelling with us.
The purpose of this paper is to highlight the general
terms and definitions that falls under the ‘common set’ in the
intersection of the sets Meteorology and Aerospace Engineering.
It begins with the universal explanations for the meteorological
phenomena under the ‘common set’ followed by the
categorization of clouds and their influences on the aerial
vehicles, the instrumentation used in Aeronautics to determine
the required Meteorological quantities, factors affecting aviation,
effects of aviation on the clouds, and the corresponding protocols
involved in deciphering the ‘common set’ elements.
It also talks about the relation between airport construction and
Geology prior to concluding with the uses and successes of
Meteorology in the field of Aerospace.
Hybrid optimization of pumped hydro system and solar- Engr. Abdul-Azeez.pdffxintegritypublishin
Advancements in technology unveil a myriad of electrical and electronic breakthroughs geared towards efficiently harnessing limited resources to meet human energy demands. The optimization of hybrid solar PV panels and pumped hydro energy supply systems plays a pivotal role in utilizing natural resources effectively. This initiative not only benefits humanity but also fosters environmental sustainability. The study investigated the design optimization of these hybrid systems, focusing on understanding solar radiation patterns, identifying geographical influences on solar radiation, formulating a mathematical model for system optimization, and determining the optimal configuration of PV panels and pumped hydro storage. Through a comparative analysis approach and eight weeks of data collection, the study addressed key research questions related to solar radiation patterns and optimal system design. The findings highlighted regions with heightened solar radiation levels, showcasing substantial potential for power generation and emphasizing the system's efficiency. Optimizing system design significantly boosted power generation, promoted renewable energy utilization, and enhanced energy storage capacity. The study underscored the benefits of optimizing hybrid solar PV panels and pumped hydro energy supply systems for sustainable energy usage. Optimizing the design of solar PV panels and pumped hydro energy supply systems as examined across diverse climatic conditions in a developing country, not only enhances power generation but also improves the integration of renewable energy sources and boosts energy storage capacities, particularly beneficial for less economically prosperous regions. Additionally, the study provides valuable insights for advancing energy research in economically viable areas. Recommendations included conducting site-specific assessments, utilizing advanced modeling tools, implementing regular maintenance protocols, and enhancing communication among system components.
Immunizing Image Classifiers Against Localized Adversary Attacksgerogepatton
This paper addresses the vulnerability of deep learning models, particularly convolutional neural networks
(CNN)s, to adversarial attacks and presents a proactive training technique designed to counter them. We
introduce a novel volumization algorithm, which transforms 2D images into 3D volumetric representations.
When combined with 3D convolution and deep curriculum learning optimization (CLO), itsignificantly improves
the immunity of models against localized universal attacks by up to 40%. We evaluate our proposed approach
using contemporary CNN architectures and the modified Canadian Institute for Advanced Research (CIFAR-10
and CIFAR-100) and ImageNet Large Scale Visual Recognition Challenge (ILSVRC12) datasets, showcasing
accuracy improvements over previous techniques. The results indicate that the combination of the volumetric
input and curriculum learning holds significant promise for mitigating adversarial attacks without necessitating
adversary training.
Welcome to WIPAC Monthly the magazine brought to you by the LinkedIn Group Water Industry Process Automation & Control.
In this month's edition, along with this month's industry news to celebrate the 13 years since the group was created we have articles including
A case study of the used of Advanced Process Control at the Wastewater Treatment works at Lleida in Spain
A look back on an article on smart wastewater networks in order to see how the industry has measured up in the interim around the adoption of Digital Transformation in the Water Industry.
Event Management System Vb Net Project Report.pdfKamal Acharya
In present era, the scopes of information technology growing with a very fast .We do not see any are untouched from this industry. The scope of information technology has become wider includes: Business and industry. Household Business, Communication, Education, Entertainment, Science, Medicine, Engineering, Distance Learning, Weather Forecasting. Carrier Searching and so on.
My project named “Event Management System” is software that store and maintained all events coordinated in college. It also helpful to print related reports. My project will help to record the events coordinated by faculties with their Name, Event subject, date & details in an efficient & effective ways.
In my system we have to make a system by which a user can record all events coordinated by a particular faculty. In our proposed system some more featured are added which differs it from the existing system such as security.
Saudi Arabia stands as a titan in the global energy landscape, renowned for its abundant oil and gas resources. It's the largest exporter of petroleum and holds some of the world's most significant reserves. Let's delve into the top 10 oil and gas projects shaping Saudi Arabia's energy future in 2024.
Cosmetic shop management system project report.pdfKamal Acharya
Buying new cosmetic products is difficult. It can even be scary for those who have sensitive skin and are prone to skin trouble. The information needed to alleviate this problem is on the back of each product, but it's thought to interpret those ingredient lists unless you have a background in chemistry.
Instead of buying and hoping for the best, we can use data science to help us predict which products may be good fits for us. It includes various function programs to do the above mentioned tasks.
Data file handling has been effectively used in the program.
The automated cosmetic shop management system should deal with the automation of general workflow and administration process of the shop. The main processes of the system focus on customer's request where the system is able to search the most appropriate products and deliver it to the customers. It should help the employees to quickly identify the list of cosmetic product that have reached the minimum quantity and also keep a track of expired date for each cosmetic product. It should help the employees to find the rack number in which the product is placed.It is also Faster and more efficient way.
Risk Contingency Evaluation in International Construction Projects (Real Case Studies)
1. International Journal of Latest Technology in Engineering, Management & Applied Science (IJLTEMAS)
2nd
Special Issue on Engineering and Technology | Volume VI, Issue VIS, June 2017 | ISSN 2278-2540
www.ijltemas.in Page 1
Risk Contingency Evaluation in International
Construction Projects (Real Case Studies)
Hesham Abd El Khaleka
, Remon F. Aziz b
, Hamada Kamelc
a
Professor of Construction Engineering and Management, Faculty of Engineering, Alexandria University, Egypt
b
Associate Professor of Construction Engineering and Management, Faculty of Engineering, Alexandria University, Egypt
c
PhD Candidate, Faculty of Engineering, Alexandria University, Egypt (Corresponding Author)
Abstract: - Most construction companies operating in the global
construction industry would undertake international projects to
maximize their profitability through benefitting from the new
attractive markets and reducing the dependence upon local
markets. As a result of the nature of construction works the
company and project’s conditions actually include massive risks
and uncertainty. So the risk sensitivity of projects costs should be
assessed in a realistic manner.
The comprehensive risk assessment method was introduced as a
decision making supporting tool to be employed for international
constructive projects through applying a risk model that will aid
the procedures of evaluating risks and prioritizing such projects
and assessing risk contingency value. Both the Analytic
Hierarchy Process (AHP), applied for evaluating risk factors
weight (likelihood), and FUZZY LOGIC approach, applied for
evaluating risk factors influence (Risk consequences) employing
software aids such as EXECL and MATLAB software, were used
for developing the risk model.
The reliability of the developed software has been verified by
applications on a real construction projects. The proposed
methodology and decision support tool have been proved to be
reliable for the estimation of cost overrun resulting from risk on
basis of actual final reports of projects.
Six actual case studies from different countries were chosen to
determine the highest risk factors and to implement the designed
models, test their results and evaluate risk cost impact.
The proposed models result showed that: the highest and lowest
risk contingency percentage of 48 % and 16 % were in Project
no (5), (6) respectively in Egypt. On the other hand, the projects
no (1, 2, 4,7) in Saudi Arabia, UAE, Libya and Jordan, the risk
contingency of 29%, 39%, 20% and 28% respectively. The
actual results are close to those of the proposed program.
Keywords: Risk Management, International construction, risk
factors, Analytic hierarchy process (AHP), FUZZY LOGIC
approach, MATLAB software and Validation process.
I. INTRODUCTION
isks result in cost overrun and delays of schedules in
many projects. The risk management effectiveness
becomes a major aspect in project management [15]. The
exact impact of qualitative decision factors on the project risk
cannot be determined using subjective judgment, yet it can
only help in constraining or excluding possible strategies in
order to improve the qualitative decision. Making the decision
to participate in an international construction project required
a thorough study of many simultaneous dimensions; e.g.,
project revenues maximization, project risks allocation and
minimization, funds availability, etc. Thus in order to assess
the factors influencing the company‘s analysis a multi factor
decision making methodology should be applied [4, 13, 1, 10].
Such decisions are extremely complex due to the fact that they
are deeply affected by many parameters and most of the
parameters are subjective and non- quantifiable ones. Dias
(1995) tackled the issue of evaluating infrastructure projects
from the contractors‘ position, and managed to identify to
main objectives of a risk model: 1. To provide a logical,
reliable and consistent process to facilitate a company‘s
decision to carry on with a project by the means of analyzing
different parameters, 2. To allow performing a sensitivity
analysis so companies will be able to assess different
scenarios; e.g., risk mitigation strategies. [4,13, 6, 7].
This study describes a tool representing a system capable of
finding the correlations between such decision factors, as well
as, the impact every factor introduces to the total project risk.
It deploys a modeling technique operates on the basis of
Analytical Hierarchy Process (AHP), Fuzzy logic. Statistic
methods were used to verify the model and the results were
compared to the actual ones from projects‘ final reports.
II. BACKGROUND
Construction projects are influenced by uncertain environment
because of their extremely huge sizes (physical, required
manpower and fiscal value), complex designs and external
elements involvement. According to such uncertainties facing
the projects, many changes in the projects‘ scopes take place
during the execution phase. If such changes were not
controlled properly; goals like time, cost and quality may
never be accomplished. [16].
Of the essential elements required for any managerial work is
the ability of situations analysis and decision making. The
process of making decisions includes a number of tasks;
planning, finding alternatives, defining priorities, selecting the
R
2. International Journal of Latest Technology in Engineering, Management & Applied Science (IJLTEMAS)
2nd
Special Issue on Engineering and Technology | Volume VI, Issue VIS, June 2017 | ISSN 2278-2540
www.ijltemas.in Page 2
best policy, allocating resources, identifying requirements,
anticipating outcomes, designing systems, evaluating
performance, securing system stability and settling conflicts.
[20, 21, 22, 23]. The Decision Support System (DSS) is
defined in early definitions as a system aiming to support
managerial decision makers in semi-structured decision
situations. DSS is intended to be associated to decision
makers, in order to expand their abilities and not to substitute
decision makers‘ judgment [4]. A DSS is an interactive,
flexible, and adaptable Computer Based Information System
(CBIS) that utilizes decision rules, models, and model base
coupled with a comprehensive database [6, 7, 11, 19]. The
decision makers often hesitate in alternative selection due to
the complicated nature of construction engineering. Fuzzy risk
assessment is a promising tool that measures risk ratings if the
risk consequences are not clear and their definition is based on
subjective judgment and not objective data. In addition to that
Fuzzy is an optimum technique to handle the uncontrolled
factors such as; location, manpower, equipment, weather,
unpredictable circumstances, time- based situations and rules
[14].
Therefore, Fuzzy logic and computation is employed in many
engineering tasks such as risk evaluation, risk pricing
algorithm, construction time- cost trade off and the building
elements‘ whole life costs. The following sections shall
specify examples for applying fuzzy theory in construction
industry:
Hyun-Ho et al., (2004) managed to develop a risk assessment
method for underground construction projects. The main tool
of this method was a risk analysis software. The risk analysis
software was based on an uncertainty model built by fuzzy
concept. The fuzzy-based uncertainty model was designed to
examine the uncertainty range of degrees related to: 1. The
probability parameter estimations, and 2. Subjective
judgments. They also concluded that the proposed method for
risk assessment shall provide both the insurance companies
and contractors with process and tools that are of flexible and
easy to follow nature and shall improve the ability to model
uncertainty. [8] As for Sou-Sen et al. they proposed an
optimal construction time-cost trade-off method concerned
with the time period of the uncertain activity and the time-
cost trade off. The uncertainties of activity durations were
modeled using the Fuzzy set theory. The method showed the
perfect balance of time and cost in the presence different risk
levels according to decision makers [25].
a generic elemental whole life costing model was developed
by Wang et al. (2004). The model used the fuzzy logic model.
Experts‘ linguistic data were used to model the correlation
between the context of application and the cost items. As
Fuzzy logic approach uses experts‘ knowledge, this model
proved that fuzzy manages to resolve the problem of lacking
data and uncertain future events prediction.
Dikmen I et al (2007) developed a Fuzzy based model rating
approach which is used to estimate cost overrun risk in
international projects during the bidding stage. The step-wise
procedure was developed for this approach and this procedure
was applied during the development of the fuzzy risk rating
tool. [5]
Cardona and Carreño (2004) [2] proposed fuzzy linguistic
values that represent factors risk performance, such linguistic
values are the same as a fuzzy set that have a membership
function of the bell function. They also suggested that
effectiveness obtained by the defuzzification of the linguistic
values has the same as a function of the Sigmoidal. Therefore,
the risk effectiveness is nonlinear; as a result of complexity.
[2]
QammazA (2007) proposed ―Structure of the International
Construction Project Risk (ICPRR) Software Application, an
application that was composed using "Oracle Forms"[28].
(Dias, 1995), (Salman A, 2003) and (Zayed ,2008) introduced
risk models on both company and project levels based on
equation (1) that represent the probability multiplied by
consequences. They used a questionnaire for identifying the
expected risk performance of each factors and liner equation
for assessing risk effectiveness [4, 27, 24]. Salman A, 2003
[24] managed to prove that the risk consequences drive the
action as the model results are very sensitive for any variation
in risk effectiveness more than importance weight. The
conclusion derived upon this was that the value scores are the
driving forces of this model rather than the importance
weights [24], therefore this paper applied fuzzy logic in order
to evaluate risk performance and nonlinear Function
(sigmoidal function) to evaluate risk effectiveness.
III. STUDY OBJECTIVES
The current study has the following goals:
(1)- Determine main risk and uncertainty factors and their
sub-factors influencing projects on both company
level and project level in international projects.
(2)- determine risk and uncertainty values for each factor
using evaluation model based on analytic hierarchy
process (AHP), determine the risk performance for
each factor based on developed program based on (
fuzzy logic approach) instead of depending on
questionnaire applied in the previous methods
(3)- Determine the value score (effectiveness) of each of
the risk factors using nonlinear function.
(4)- Design flexible assessment model in order to
measure the cost impact of risk and proposed
appropriate risk contingency value.
(5)- Applying the proposed model in real construction
projects to assess the proposed risk contingency
value and compare the proposed risk contingency
value with its actual risk value.
IV. STUDY METHOD
3. International Journal of Latest Technology in Engineering, Management & Applied Science (IJLTEMAS)
2nd
Special Issue on Engineering and Technology | Volume VI, Issue VIS, June 2017 | ISSN 2278-2540
www.ijltemas.in Page 3
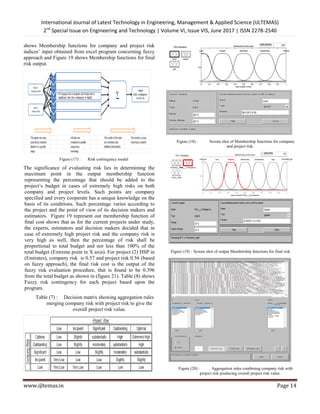
This research had different method stages to accomplish its
goals in determining the risk index (R). Fig. 1 shows these
stages and their correlation. The stages are described in detail
across the whole paper and can be briefly listed as follows:
Stage 1: Literature Review:
This stage of the study revolved about exploring the previous
decision making supporting systems in the field of risk
assessment, as well as, the components of risk models.
Stage 2: Analytical study.
A stage consisting of:
(1). Exploring the risk evaluation models for both the
company level and project level. (developing a Risk
hierarchy model)
(2). Two risk index (R) models, on both the company and
project levels, were developed in order to evaluate the
impact of risk sources and uncertainty on construction
project based on equation (1) probability theory which is
adapted from Dias [4].
Final project Risk Index (R) = Risk Index for Company
level (R1) * Risk Index for project level (R2)
Risk Index 1, 2 =Likelihood X Consequence
∑ ( ) ( )Equation (1)
R : Risk index of construction
projects.
R1 : Risk index of projects in company
level.
R2 : Risk index of projects in project
level.
Wi (xi) : Weight for each risk area i using
Eigen value method.
Ei (xi) : Effect score for each risk area (xi).
Xi : Different risk areas i.
I : 1, 2, 3,. . .. . .. . .. . ., n.
N : Number of risk areas.
(3). Two models composed to define the risk index (R) and
the risks factors distributed among two levels (company
level and project level). Each model includes two parts:
risk factors weights (W) and their value score (E).
AHP will be used for determining risk factors weights;
while four different approaches shall be used for
assessing the risk impact, these are; Dias approach [4],
Value curve approach according to Zayed T [27], New
approach according to Salman [24] and proposed model
using Fuzzy logic approach to evaluate Expected risk
performance and sigmoidal function to evaluate risk
factors effectiveness.
Figure (1) : Study method flowchart.
(4). A new software, deploying excel sheet, was developed
for the purpose of evaluating the risk factors weights
busing AHP concepts and Eigen value method. Also,
excel software will receive Expected Risk Performance
(P Expected) value from fuzzy program in order to calculate
risk effectiveness using sigmoidal function hence the
overall risk can be determined through equation no (1) on
both level of the company and the project.
Stage 3: Case studies (Verification, validation and application
processes).
(1). The study used six case studies to verify the suggested
model using questionnaire as a data collecting tool, to
collect data about sources of risk in international
4. International Journal of Latest Technology in Engineering, Management & Applied Science (IJLTEMAS)
2nd
Special Issue on Engineering and Technology | Volume VI, Issue VIS, June 2017 | ISSN 2278-2540
www.ijltemas.in Page 4
construction projects, as well as, risk factors from a study
group.
(2). Validation was undertaken in order to assess different
methods through comparing their results and applying four
statistical evaluation methods.
(3). The proposed model will be applied to assess the
suggested risk contingency value in real construction
projects and match the proposed risk contingency value
with its actual risk value from its close out reports of the
projects.
V. MODELS DEVELOPED THROUGH RESEARCH
Four models were developed throughout research stages.
Table 1 shows the description and the objectives of each
model. Hierarchy risk models on both company and project
levels are displayed in fig.2, 3, 4 that will be used throughout
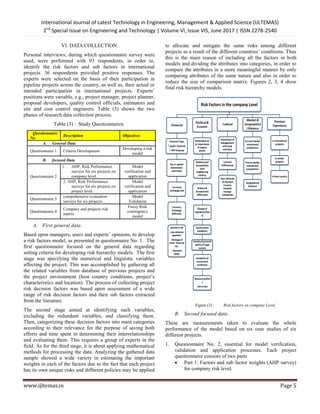
the study to evaluate the projects risk. The main Hierarchy
risk model shown in figure (2) represents level 1 which is
divide into two main groups company and project, each class
divided into main categories representing main risk factors
divided to sub factors as shown in figures (3,4).
Table (1) : Developed models which were used through study
stages.
Model
No
Description Objectives
Module
1
Hierarchy Risk
model factors
Building risk model factors for both company and
project level
Module
2
Expected risk
performance
based on fuzzy
logic approach
Identifying Expected risk performance using
MATLAB software instead of using questionnaire
in the previous methods
Module
3
Overall Excel
sheet model
Receive output results from expected performance
FUZZY program, calculate each risk factor
effectiveness using sigmoidal function, solving
AHP matrices and calculate final project risk index
Module
4
Fuzzy risk
contingency
model
Receive output results of risk indexes for both
company and project risk contingency using
MATLAB software
Figure (2) : Risk hierarchy model in company and project Levels.
In order to assess the risk sources impact, as well as, the
uncertainty in a construction project from contractor‘s
(company) point of view a risk index (R) model was designed.
The model offers a logical, reliable and consistent method for
evaluating and prioritizing potential projects, in addition to,
facilitating decision making on company‘s party. The various
risk sources and uncertainty of the project are characterized
through the risk index (R) which is based on equation 1. The
R-index includes two parts, these are; weights of risk factors
and sub-factors and their impact score. AHP developed by
Saaty shall determine Weights of risk areas [20, 21, 22, 23],
while, the impact score shall be assessed using utility function
for previous approaches and fuzzy logic approach for the
suggested model. Four approaches are used in developing risk
worth score (Impact) of the risk factors; these approaches are
shown in table 2.
Table (2) : Performance and Effectiveness evaluation
approaches.
Approach
Performance
evaluation
Effectiveness
evaluation
Diaz Approach
Questionnaire-
based
Diaz value curve
P2=100 Approach
Questionnaire-
based
According to Zayed
value curve P2 = 100
P2 Only Approach
Questionnaire-
based
According to Salman,
A. value curve P2 =
100
Proposed model based
on Fuzzy Logic and
Sigmoidal function
Approach
Based on Fuzzy
Logic
Sigmoidal function
Diaz Value Curve deploys two points P1, P2‘s to describe
the value curve. P1 is the minimum risk performance
level, P2 the maximum risk performance level. These
questionnaire- abstracted two points; feature the generic
form of a value curves through dividing the performance
scale into three regions [4].
P2= 100 Value Curve. The performance value of P1 was
always zero in P2 =100 approach in contrast of Dias and
loannon approach. This is the result of considering all
project‘s decision factors significant and influencing the
outcome of the total project‘s risk. Even in case of
minimum impact of the decision, its performance should
be taken into consideration in evaluating according to
Zayed approach [27].
P2 Only Value Curve. P2 Only Approach‖ which shall
deploy P2 value provided by the respondents as the
maximum performance and P1 shall be neglected. [24].
Suggested Model to Assess Expected Risk Performance
According to Fuzzy Logic
Applying Fuzzy Logic and MATLAB software, the new
suggested model to evaluate the Expected Risk
Performance will be deployed and shall be explained in
the following sections (section 7, 8).
5. International Journal of Latest Technology in Engineering, Management & Applied Science (IJLTEMAS)
2nd
Special Issue on Engineering and Technology | Volume VI, Issue VIS, June 2017 | ISSN 2278-2540
www.ijltemas.in Page 5
VI. DATA COLLECTION
Personal interviews; during which questionnaire survey were
used, were performed with 93 respondents, in order to,
identify the risk factors and sub factors in international
projects. 36 respondents provided positive responses. The
experts were selected on the basis of their participation in
pipeline projects across the country, as well as, their actual or
intended participation in international projects. Experts‘
positions were variable, e.g.; project manager, project planner,
proposal developers, quality control officials, estimators and
site and cost control engineers. Table (3) shows the two
phases of research data collection process.
Table (3) : Study Questionnaires.
Questionnaire
No
Description Objectives
A. General Data
Questionnaire 1 Criteria Development
Developing a risk
model
B. focused Data
Questionnaire 2
1. AHP, Risk Performance
surveys for six projects on
company level.
Model
verification and
application
2. AHP, Risk Performance
surveys for six projects on
project level.
Model
verification and
application
Questionnaire 3
comprehensive evaluation
surveys for six projects
Model
Validation
Questionnaire 4
Company and projects risk
matrix
Fuzzy Risk
contingency
model
A. First general data.
Based upon managers, users and experts‘ opinions, to develop
a risk factors model, as presented in questionnaire No. 1. The
first questionnaire focused on the general data regarding
setting criteria for developing risk hierarchy models. The first
stage was specifying the numerical and linguistic variables
affecting the project. This was accomplished by gathering all
the related variables from database of previous projects and
the project environment (host country conditions, project‘s
characteristics and location). The process of collecting project
risk decision factors was based upon assessment of a wide
range of risk decision factors and their sub factors extracted
from the literature.
The second stage aimed at identifying such variables,
excluding the redundant variables, and classifying them.
Then, categorizing these decision factors into main categories
according to their relevance for the purpose of saving both
efforts and time spent in determining their interrelationships
and evaluating them. This requires a group of experts in the
field. As for the third stage, it is about applying mathematical
methods for processing the data. Analyzing the gathered data
sample showed a wide variety in estimating the important
weights in each of the factors due to the fact that each project
has its own unique risks and different policies may be applied
to allocate and mitigate the same risks among different
projects as a result of the different countries‘ conditions. Thus
this is the main reason of including all the factors in both
models and dividing the attributes into categories, in order to
compare the attributes in a more meaningful manner by only
comparing attributes of the same nature and also in order to
reduce the size of comparison matrix. Figures 2, 3, 4 show
final risk hierarchy models.
Figure (3) : Risk factors on company Level.
B. Second focused data.
These are measurements taken to evaluate the whole
performance of the model based on six case studies of six
different projects.
1. Questionnaire No. 2, essential for model verification,
validation and application processes. Each project
questionnaire consists of two parts
Part 1: Factors and sub factor weights (AHP survey)
for company risk level.
6. International Journal of Latest Technology in Engineering, Management & Applied Science (IJLTEMAS)
2nd
Special Issue on Engineering and Technology | Volume VI, Issue VIS, June 2017 | ISSN 2278-2540
www.ijltemas.in Page 6
Factors and sub factor risk Performance (Impact)
for company risk level.
Part2: Factors and sub factor weights (AHP survey)
for project risk level.
Factors and sub factor risk Performance (Impact)
for project risk level.
2. Questionnaire No. 3, Holistic evaluation for both
company and project level, essential for model validation
process.
3. Questionnaire No. 4, impact of company and project Risk
on the overall project risk (Risk matrix), essential for
Risk contingency model.
Figure (4) : Risk factors on project Level
VII. SUGGESTED EXPECTED RISK PERFORMANCE
ASSESSMENT MODEL ACCORDING TO FUZZY
LOGIC
The fourth approach introduces a new model to determine the
anticipated risk factors performance as per fuzzy logic
approach, instead of questionnaire applied in the previous
method, in addition to, determining risk factors effectiveness
according sigmoidal function instead of linear functions
deployed in previous methods. The reason for using Fuzzy
logic is that it is conceptually easy to understand because the
mathematical concepts behind fuzzy reasoning are very
simple. It is also flexible with any given system and it is
capable of modeling nonlinear functions of arbitrary
complexity. Fuzzy logic can be developed basing on experts‘
experience, as contrasting to neural networks that take training
data and generate opaque, impenetrable models, fuzzy logic
relies on the experience of people who already understand the
system. Fuzzy logic is based on natural language. The basis
for fuzzy logic is the same as for human communication. [16],
[29].
7.1 Modeling a Fuzzy Problem:
The first Fuzzy model was developed in order to evaluate
expected risk performance. Input data were two elements
(minimum risk performance and maximum risk performance).
The inputs are crisp (non- fuzzy) numbers limited to a specific
range provided through questionnaire No. 1. All the results
were evaluated in parallel by fuzzy reasoning using 10 rules
system. The results of the rules were combined and
defuzzified, the result is a crisp number representing the
output expected risk performance.
Figure (5) : Expected Risk Performance model (Pexp)
7.2 Fuzzy Inference Process:
Fuzzy inference is the process of the mapping formulation
from given input into output using fuzzy logic. Such mapping
offers the basis upon which decisions making or patterns
discerning can rely.
In the Fuzzy Logic, there are five parts of the fuzzy inference
process: [1,2].
7. International Journal of Latest Technology in Engineering, Management & Applied Science (IJLTEMAS)
2nd
Special Issue on Engineering and Technology | Volume VI, Issue VIS, June 2017 | ISSN 2278-2540
www.ijltemas.in Page 7
1. Step 1. Fuzzifying Inputs: That is to fuzzify the input
variables and to determine the membership function
of the input and output variables, for example; figure
6 shows the input and output Membership functions.
2. Step 2. Fuzzy Operator application: applying the
fuzzy operator (AND or OR) to the antecedent.
3. Step 3. Applying implication method. Implication
from the antecedent to the consequent.
4. Step 4. Aggregate All Outputs. Aggregation of the
consequents across the rules.
5. Step 5. Defuzzified Process.
Figure (6) : Membership functions of input variables
VIII. SYSTEM DEVELOPING USING MATLAB
SOFTWARE
A new model was provided to determine expected risk
factors performance, thus representing best estimation of risk
impact according to fuzzy logic approach instead of
questionnaire used in previous method
Membership functions for fuzzy sets are defined,
representing the performance levels for the input factors (P1,
P2) and are used in information processing, P1 represent
Minimum Risk Performance that is, representing maximum
Ineffective risk performance and P2 represents maximum
risk performance that is, representing maximum effective
risk performance. These two points were explained by
experts in the questionnaire method.
The performance values of the factors are provided on the x-
axis and the membership degree for each level of performance
is shown on the y-axis, where 1 is the total membership and 0
is the non-membership. Equation No. 2 presents Membership
functions as represented by bell function, as proposed by [6].
( )
| |
Equation 2
Where the parameter b is usually positive.
Figure 7 shows input Membership Function for point P1
and another input P2 and output Membership Function for
the same membership function. The Rule Editor
represented with ...and then.... As for the rule variables,
they are considered as independent of each other in order
to simplify the procedure. The steps followed to develop
the program based on fuzzy approach using MATLAB
software are presented in details [1,2].
Figure (7) : Anticipated risk performance according to FUZZY
LOGIC approach using MATLAB software.( Expected risk
performance)
IX. DETERMINING RISK EFFECTIVENESS.
Equation No. 3 provides the Effectiveness of expected risk
performance value (the value Obtained by the defuzzification
of the linguistic values (PExpected)- obtained from previous
section).
Effectiveness value is the value obtained by sigmoidal
function type [2]. Figure 8 shows the Effectiveness degree of
the risk performance value according to (Carreno 2004) using
sigmoidal function type
( )
( )
Equation. (3)
Where ɑ: controls the slope at the crossing point, 0.5 of
membership and equal 0.104, X is Performance at X axis and
C =50.
According to Carreño et al (2004) in order to characterize
performance, whose shape corresponds to the sigmoidal
8. International Journal of Latest Technology in Engineering, Management & Applied Science (IJLTEMAS)
2nd
Special Issue on Engineering and Technology | Volume VI, Issue VIS, June 2017 | ISSN 2278-2540
www.ijltemas.in Page 8
function (Figure 8), the form and coverage of these
membership functions follow a non- linear behavior in a
sigmoidal form. As per figure (8) the effectiveness of the risk
is represented as a function of the performance level.
Figure (8) : Effectiveness degree of the risk performance. [6].
X. DEVELOPING AN EXCEL SPREAD SHEET
PROGRAM.
The suggested model was designed using Excel Software
Program to include the following features;
(1). The model shows all input data collected through a
pair- wise process.
(2). Designed to resolve the matrices with AHP concepts
and Eigen value method of assessing risk factors
weights.
(3). The model calculates risk performance for each risk
factor on the basis of each approach.
(4). The results obtained from fuzzy program represent
(Expected Risk Performance (P Expected) ) put in the
Excel sheet (Column 23) in order to calculate risk
effectiveness using sigmoidal function.
(5). Therefore, the total risk index can be determined
through equation No. (1), for both company and
project levels. Figure 9 shows the Excel Software
sheet, along with, the description of the properties
and functions of each column. The right lower corner
shows risk index of each approach.
(6). The main characteristic of the suggested model, that
is, that the model has no limit as for the number of
risk factors.
XI. VERIFICATION OF SUGGESTED MODEL
RESULTS
Six projects in different countries, presented in table (4), were
selected to verify model application as per study methodology
flow chart shown in figure (1), the steps are as follows.
11.1 Part 1: Assigning Risk factors weights (AHP Survey)
Respondents were asked to make a pairwise comparison
between risk factors and risk sub factors representing the
relative significance between them of the basis of the
numerical scale (1-9) using Analytical Hierarchy Process
(AHP). Figure 10 provides an example to explain the pair
wise process. The assignment of weights requires logical and
analytical thinking, so it is preferred to focus on the
respondents with good experience and knowledge as per each
case study to participate in the AHP survey questionnaire as a
guarantee that only valid and good quality data are collected.
The group members should hold brainstorming sessions
seeking consensus regarding the required tasks. In other
words, instead of asking the same questions to individual
members separately, the group shall provide only one
response which represents the democratic majority point of
view of the group [23,27].
Figure (9) : Screen shot for Excel sheet program explaining each columns
identification and demonstrate the input data and output results of the
program for risks in the Project level in the project 2.
0.00
0.20
0.40
0.60
0.80
1.00
0 50 100
effectivness
Performace
9. International Journal of Latest Technology in Engineering, Management & Applied Science (IJLTEMAS)
2nd
Special Issue on Engineering and Technology | Volume VI, Issue VIS, June 2017 | ISSN 2278-2540
www.ijltemas.in Page 9
11.2 Part 2: Allocating Performance of Risk factors.
Respondents were asked to allocate 3 points representing low
risk performance (P1), the high point of risk performance (P2)
and the Expected risk performance (P Expected) for all sub
factors on both company and project risk factors on the basis
of the numerical scale (1-9). Figure 10 provides an example
explaining Allocating Risk Performance for each risk factor.
Figure (10) : Allocating Risk Performance for each risk factor on
project level.
The performance scale has main points; these are:
Minimum Risk Performance (P1): the point at which
maximum Ineffective risk performance exists. It
reflects the risk factor impact in the condition at
which things go well (optimistic Impact).
Maximum Risk Performance (P2): the point referring
to maximum effective risk performance. It refers to
the risk factor influence when things do not go well
(pessimistic Impact).
Expected Risk Performance (P Expected): This is the
point representing best estimate of the risk impact
(most likely impact). This point was determined using
FUZZY logic in new software instead of using
questionnaire in previous methods.
Ineffective point: The point of normal risk
performance and it means that the risk is as same as
previous projects.
Extremely Ineffective: The lowest risk point in the
performance scale, with the meaning that there is no
risk at all.
Absolutely Effective: The highest risk point on the
performance scale. It is means that there is extremely
high risk.
11.3 Part 3: Assessing effectiveness of risk factors.
Expected risk performance of risk factors were evaluated
according previous approach using questionnaire and Matlab
software for proposed FUZZY model as indicated in table (2),
(Expected Risk Performance according FUZZY approach
section and System Developing using MATLAB Software
section). Effectiveness of risk factors were assessed using the
relevant utility function for the previous methods (Dias,
P2=100 and P2 Only approaches) and sigmoidal function to
evaluate effectiveness of Expected risk performance (P Expected)
obtained by the new fuzzy model [8, 28, 1, 2].
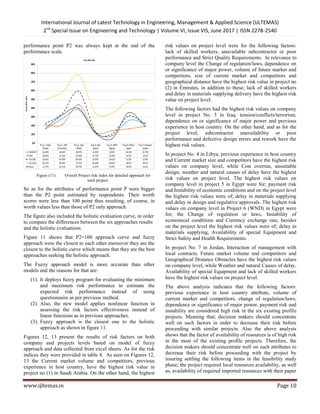
XII. RISK MODELS RESULTS AND ANALYSIS
The detailed assessment of the four (Diaz, P2 Only, P2=100
and new software on the basis of FUZZY Logic) approaches
for each project profile are shown in table 4. The calculations
of the projects‘ detailed profiles evaluation results for each
case study were undertaken in terms of the four approaches.
They were also plotted according to comprehensive
evaluations of the final risk index of the project. Figure 11
provides the results.
Table (4) : Company and project risk indexes each project
conjunction with each approach.(appendix A)
The figure shows that in P2 Only and P2=100 approaches,
most of detailed evaluations were higher than Diaz approach
evaluations. This was the result of the assumption that
performance level point P1 was kept equal zero in these two
approaches, so that any factors performance less than P1 and
bigger than zero had a worth score value and shall be included
in the evaluation of the total value of the project (eq. 1) while
in Diaz approach; the factors performance level point P1 was
considered in the evaluations so that all the factors
performance levels located behind P1 had zero worth score
resulted in zero worth value and it shall be excluded from the
equation1.
The figure also shows that ‗P2 only approach had bigger
values than P2 =100 approach, this was mentioned in P2 Only
approach. The performance level points P2 provided by
respondents were considered as extreme points of risk
performance and worth 100 points even if it was not at the
extreme end of the performance scale and all the attributes
performance levels located after this point shall have the same
worth score. While in P2 = 100 approach the attributes
10. International Journal of Latest Technology in Engineering, Management & Applied Science (IJLTEMAS)
2nd
Special Issue on Engineering and Technology | Volume VI, Issue VIS, June 2017 | ISSN 2278-2540
www.ijltemas.in Page 10
performance point P2 was always kept at the end of the
performance scale.
Figure (11) : Overall Project risk index for detailed approach for
each project.
So as for the attributes of performance point P were bigger
than the P2 point estimated by respondents. Their worth
scores were less than 100 point thus resulting, of course, in
worth values less than those of P2 only approach.
The figure also included the holistic evaluation curve, in order
to compare the differences between the six approaches results
and the holistic evaluations.
Figure 11 shows that P2=100 approach curve and fuzzy
approach were the closest to each other moreover they are the
closest to the holistic curve which means that they are the best
approaches seeking the holistic approach.
The Fuzzy approach model is more accurate than other
models and the reasons for that are:
(1). It deploys fuzzy program for evaluating the minimum
and maximum risk performance to estimate the
expected risk performance instead of using
questionnaire as per previous method.
(2). Also, the new model applies nonlinear function in
assessing the risk factors effectiveness instead of
linear functions as in previous approaches.
(3). Fuzzy approach is the closest one to the holistic
approach as shown in figure 11.
Figures 12, 13 present the results of risk factors on both
company and projects levels based on model of fuzzy
approach and data collected from excel sheets. As for the risk
indices they were provided in table 4. As seen on Figures 12,
13 the Current market volume and competitors, previous
experience in host country, have the highest risk value in
project no (1) in Saudi Arabia. On the other hand, the highest
risk values on project level were for the following factors:
lack of skilled workers, unavailable subcontractor or poor
performance and Strict Quality Requirements. In relevance to
company level the Change of regulation/laws, dependence on
or significance of major power, volume of future market and
competitors, size of current market and competitors and
geographical distance have the highest risk value in project no
(2) in Emirates, in addition to these; lack of skilled workers
and delay in materials supplying delivery have the highest risk
value on project level.
The following factors had the highest risk values on company
level in project No. 3 in Iraq: tension/conflicts/terrorism,
dependence on or significance of major power and previous
experience in host country. On the other hand, and as for the
project level; subcontractor unavailability or poor
performance and defective design errors and rework have the
highest risk values.
In project No. 4 in Libya, previous experience in host country
and Current market size and competitors have the highest risk
values on company level, while Cost overrun, unsuitable
design, weather and natural causes of delay have the highest
risk values on project level. The highest risk values on
company level in project 5 in Egypt were for; payment risk
and Instability of economic conditions and on the project level
the highest risk values were of; delay in materials supplying
and delay in design and regulative approvals. The highest risk
values on company level in Project 6 (WND) in Egypt were
for; the Change of regulation or laws, Instability of
economical conditions and Currency exchange rate, besides
on the project level the highest risk values were of; delay in
materials supplying, Availability of special Equipment and
Strict Safety and Health Requirements.
In project No. 7 in Jordan, Interaction of management with
local contracts, Future market volume and competitors and
Geographical Distance Obstacles have the highest risk values
on company level, while Weather and natural Causes of delay,
Availability of special Equipment and lack of skilled workers
have the highest risk values on project level.
The above analysis indicates that the following factors:
previous experience in host country attribute, volume of
current market and competitors, change of regulation/laws,
dependence or significance of major power, payment risk and
instability are considered high risk in the six existing profile
projects. Meaning that; decision makers should concentrate
well on such factors in order to decrease their risk before
proceeding with similar projects. Also the above analysis
shows that the factor of availability of resources is of high risk
in the most of the existing profile projects. Therefore, the
decision makers should concentrate well on such attributes to
decrease their risk before proceeding with the project by
insuring settling the following items in the feasibility study
phase; the project required local resources availability, as well
as, availability of required imported resources with their paper
11. International Journal of Latest Technology in Engineering, Management & Applied Science (IJLTEMAS)
2nd
Special Issue on Engineering and Technology | Volume VI, Issue VIS, June 2017 | ISSN 2278-2540
www.ijltemas.in Page 11
works (type, cost, import licenses, taxes, delivery time, etc.,).
Moreover, figures (12,13) show that it is worth noting that
some factors have low risk value and in another project have
high risk relevant to each project conditions.
Figure (12) : Risk attributes values on company level for each
project (Model based on fuzzy approach).
Figure (13) : Risk factors values on project level for each project
(Model based on fuzzy approach).
XIII. MODEL VALIDATION
The objective of the model validation process is to introduce
statistical methods to validate the risk evaluation model
results. Therefore, the validated results are used in estimating
the overall risk contingency using MATLAB software based
in FUZZY logic approach.
Dias and Ionone, 1996 mentioned that the use of external
criteria to objectively assess the validity of the evaluation
models is a difficult matter due to subjective nature of the
multi- attribute decision models. Thus, past research relied on
indirect approaches, such as convergent validation, predictive
validation, and axiomatic validation methods.
12. International Journal of Latest Technology in Engineering, Management & Applied Science (IJLTEMAS)
2nd
Special Issue on Engineering and Technology | Volume VI, Issue VIS, June 2017 | ISSN 2278-2540
www.ijltemas.in Page 12
13.1 Holistic Assessment.
Holistic assessment (also called 'integrated assessment')
focuses on the evaluating the whole work activities rather than
specific elements. Holistic assessment is a direct evaluation
made by the professional decision makers.
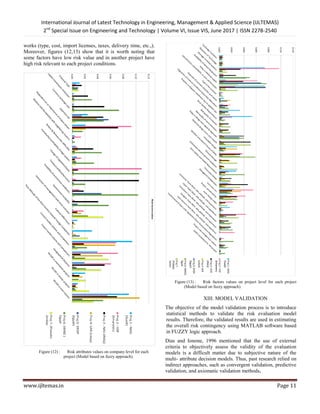
13.2Convergent Validation.
Convergent validation consists of comparing the results
obtained by a fuzzy model with the holistic one; that is a
direct evaluation undertaken by the decision makers (average,
average plus standard deviation, and average minus standard
deviation values. Figure (14) show the developed fuzzy model
results, in addition to the holistic evaluation for company and
project level risks. It is worth noting that the developed fuzzy
model results are in the range of average plus standard
deviation, and average minus standard deviation values.
Figure (14) : Convergent validation of developed fuzzy model
results for project risk.
13.3 Correlation Coefficient, R (Pearson Product Moment
Correlation):
Correlation is a technique for examining the relationship
between two quantitative, continuous variables. The quantity
r, called the linear correlation coefficient, measures the
strength and the direction of a linear relationship between two
variables. The linear correlation coefficient is sometimes
referred to as the Pearson product moment correlation
coefficient
( ) ( )( )
√ ( ) ( )
Eq. (4) [13].
The correlation estimation was performed by calculating the
Pearson‘s product- moment correlation coefficients between
the holistic approach and the four detailed approaches for
each project profile for company and project levels results; to
verify the validity of fuzzy model and in order to determine
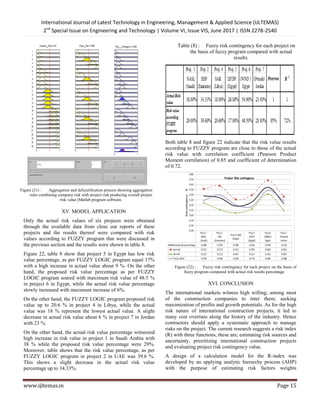
which approach was the closest to the holistic one. The results
shown in table (5) indicate that the Pearson correlation
coefficients in the four approaches proved that fuzzy
approach was the one that almost matched the holistic
approach.
Table (5) : Correlation Coefficient for each model results in
addition to the holistic evaluation.
Pearson
Coefficient
Risk
assessmen
t model
Holisti
c Diaz
P2=10
0
P2
Only
FUZZ
Y
Company
level 100%
91.6
% 98.2% 99%
98.8
%
project
level 100%
59.5
% 94%
84.8
%
94.4
%
13.4 Test factor.
Test factor validation a step applied to test the designated
model and verify its strength in predicting construction
project‘s risk. The results from the model and the holistic
evaluation were compared the test factor in model as follows:
Test Factor (TF) = RMR/RHE Equation (5), [31].
Table 4 shows the test factor results of the holistic and
detailed models evaluations in terms of the risks on the
company and project levels. They show that fuzzy approach is
the closest to the holistic which means that it is the closest
approach to match the Holistic. The previous test factor
reveals that the accuracy and robustness of FUZZY model on
company level have been tested using holistic evaluation,
which proves its strength in risk assessment (99%) in
company level and 101 % in project level as shown in table 6.
Table (6) : Test Factor for detailed approach.
Test
factor
Risk
assessme
nt model
Holisti
c
approa
ch
Diaz
approa
ch
P2=10
0
approa
ch
P2
Only
approa
ch
FUZZY
approach
Compan
y level 100% 96% 109% 165% 99%
project
level 100% 99% 105% 152% 101%
13.5 Coefficient of determination r 2
.
The coefficient of determination is a measurement of the
regression line representation of the data. In cases at which the
regression line should pass through every point on the scatter
plot, it then shall be able to explain all the variation. The
farther the line is away from the points, the less able to
explain it shall be. The coefficient of determination, r 2
gives
the proportion of the variance (fluctuation) of one variable
that is predictable from the other variable. It is a measure that
allows us to determine how certain the predictions made from
a certain model/graph are. It is useful because it gives the
proportion of the variance (fluctuation) of one variable that is
predicted from the other variable.
13. International Journal of Latest Technology in Engineering, Management & Applied Science (IJLTEMAS)
2nd
Special Issue on Engineering and Technology | Volume VI, Issue VIS, June 2017 | ISSN 2278-2540
www.ijltemas.in Page 13
The correlation was made between holistic and detailed
evaluations for the four approaches in terms of the company
Risk model results. Figures (15,16) show the correlations
between risks attributes of holistic and detailed evaluations
of the project profile for the four alternative approaches and
their regression lines showing that the trend line of fuzzy
approach is the closest one to the 45-dcgree line and the
detailed evaluations values in this approach are the closest
ones to the holistic evaluation values (correlations for Diaz,
P2=100, P2 Only, and fuzzy approaches are 0.839, 0.964,
0.980, 0.976 respectively) for Company Risk model results.
(Correlations for Diaz, P2=100, P2 Only, and fuzzy
approaches are 0.355, 0.883, 0.718, 0.890 respectively) for
project risk model results.
Figure (15) : The correlations between risks attributes holistic and
detailed evaluations of the project profile for the four alternative
approaches (company level risk).
XIV. SUGGESTED FINAL RISK VALUE (SUGGESTED
PROJECT RISK CONTINGENCY VALUE)
Cost overhead could be estimated through aggregating and
defuzzification of company‘s and project‘s final risk ratings
through such rules and these rules might differ according to
the risk attitude of experts and corporate policies, as such
policies are company specified and each company has its own
risk knowledge, thus leading to different fuzzy rules, as well
as, different risk attitudes. (Cooper et al. 2007) [33] Managed
to comply the philosophy of aggregated rules close to risk
priorities for water pipelines.
Figure (16) : The correlations between risks attributes holistic and
detailed evaluations of the project profile for the four alternative
approaches (project level risk).
figure 17 show FUZZY risk contingency model [1]. Figure 18
14. International Journal of Latest Technology in Engineering, Management & Applied Science (IJLTEMAS)
2nd
Special Issue on Engineering and Technology | Volume VI, Issue VIS, June 2017 | ISSN 2278-2540
www.ijltemas.in Page 14
shows Membership functions for company and project risk
indices‘ input obtained from excel program concerning fuzzy
approach and Figure 19 shows Membership functions for final
risk output.
Figure (17) : Risk contingency model
The significance of evaluating risk lies in determining the
maximum point in the output membership function
representing the percentage that should be added to the
project‘s budget in cases of extremely high risks on both
company and project levels. Such points are company
specified and every cooperate has a unique knowledge on the
basis of its conditions. Such percentage varies according to
the project and the point of view of its decision makers and
estimators. Figure 19 represent out membership function of
final cost shows that as for the current projects under study,
the experts, estimators and decision makers decided that in
case of extremely high project risk and the company risk is
very high as well, then the percentage of risk shall be
proportional to total budget and not less than 100% of the
total budget (Extreme point in X axis). For project (2) HSP in
(Emirates), company risk is 0.57 and project risk 0.56 (based
on fuzzy approach), the final risk cost is the output of the
fuzzy risk evaluation procedure, that is found to be 0.396
from the total budget as shown in (figure 21). Table (8) shows
Fuzzy risk contingency for each project based upon the
program.
Table (7) : Decision matrix showing aggregation rules
merging company risk with project risk to give the
overall project risk value.
Figure (18) : Screen shot of Membership functions for company
and project risk.
Figure (19) : Screen shot of output Membership functions for final risk.
Figure (20) : Aggregation rules combining company risk with
project risk producing overall project risk value.
15. International Journal of Latest Technology in Engineering, Management & Applied Science (IJLTEMAS)
2nd
Special Issue on Engineering and Technology | Volume VI, Issue VIS, June 2017 | ISSN 2278-2540
www.ijltemas.in Page 15
Figure (21) : Aggregation and defuzzification process showing aggregation
rules combining company risk with project risk producing overall project
risk value (Matlab program software.
XV. MODEL APPLICATION
Only the actual risk values of six projects were obtained
through the available data from close out reports of these
projects and the results thereof were compared with risk
values according to FUZZY program that were discussed in
the previous section and the results were shown in table 8.
Figure 22, table 8 show that project 5 in Egypt has low risk
value percentage, as per FUZZY LOGIC program equal 17%
with a high increase in actual value about 9 %. On the other
hand, the proposed risk value percentage as per FUZZY
LOGIC program soared with maximum risk value of 48.5 %
in project 6 in Egypt, while the actual risk value percentage
slowly increased with maximum increase of 6%.
On the other hand, the FUZZY LOGIC program proposed risk
value up to 20.6 % in project 4 in Libya, while the actual
value was 18 % represent the lowest actual value. A slight
decrease in actual risk value about 6 % in project 7 in Jordan
with 23 %.
On the other hand, the actual risk value percentage witnessed
high increase in risk value in project 1 in Saudi Arabia with
38 % while the proposed risk value percentage were 29%.
Moreover, table shows that the risk value percentage, as per
FUZZY LOGIC program in project 2 in UAE was 39.6 %.
This shows a slight decrease in the actual risk value
percentage up to 34.33%.
Table (8) : Fuzzy risk contingency for each project on
the basis of fuzzy program compared with actual
results.
Both table 8 and figure 22 indicate that the risk value results
according to FUZZY program are close to those of the actual
risk value with correlation coefficient (Pearson Product
Moment correlation) of 0.85 and coefficient of determination
of 0.72.
Figure (22) : Fuzzy risk contingency for each project on the basis of
fuzzy program compared with actual risk results percentage.
XVI. CONCLUSION
The international markets witness high willing; among most
of the construction companies to inter them; seeking
maximization of profits and growth potentials. As for the high
risk nature of international construction projects, it led to
many cost overruns along the history of the industry. Hence
contractors should apply a systematic approach to manage
risks on the project. The current research suggests a risk index
(R) with three functions, these are; estimating risk sources and
uncertainty, prioritizing international construction projects
and evaluating project risk contingency value.
A design of a calculation model for the R-index was
developed by an applying analytic hierarchy process (AHP)
with the purpose of estimating risk factors weights
16. International Journal of Latest Technology in Engineering, Management & Applied Science (IJLTEMAS)
2nd
Special Issue on Engineering and Technology | Volume VI, Issue VIS, June 2017 | ISSN 2278-2540
www.ijltemas.in Page 16
(likelihood) and the FUZZY LOGIC approached, in order to,
evaluate risk factors impact (Risk Consequences) with aiding
software tools such as EXCEL and MATLAB software. A
promising risk quantification tool was provided through
―FUZZY RISK ASSESSMENT‖ to quantify risk ratings; in
case of vague risk impacts and are defined by subjective
judgment and not objective data.
The present study tackled and discussed the model
components in details. It also tested the applicability of the
suggested methodology on actual cases. A selection of five
actual case studies from five different countries was chosen to
implement the developed models and test their results.
The model components were explained and discussed in detail
throughout this paper. Applicability of the proposed
methodology has been tested on real cases. Six case studies in
different countries were selected to implement the designed
models and test its results.
As shown from the risk factors results on company level using
software aids (fuzzy Logic approach model), the Current
market volume and competitors, previous experience in host
country, have the highest risk value in project no (1) in Saudi
Arabia. While lack of skilled workers, unavailable
subcontractor or poor performance and Strict Quality
Requirements were of the highest risk value on project level.
As for the company level in project No. 2 in Emirates, the
change of regulations/ laws, dependence of major power, the
size of future market and competitors, the size of current
market and competitors and geographical distance were of the
highest risk value and on the project level; the lack of skilled
workers, delay in materials supplying and cost overrun had
the highest risk value.
The following factors had the highest risk values on company
level in project No. 3 in IRAQ: tension/conflicts/terrorism,
dependence on or significance of major power and previous
experience in host country. On the other hand, and as for the
project level; subcontractor unavailability or poor
performance and defective design errors and rework have the
highest risk values.
As for the company level in project No. 4 in Libya, previous
experience in host country and Current market size and
competitors were of the highest risk value and on the project
level; Cost overrun, unsuitable design, weather and natural
causes of delay had the highest risk value.
On the other hand, the highest risk values on company level in
project 5 in Egypt were for; payment risk and Instability of
economic conditions and on the project level the highest risk
values were of; delay in materials supplying and delay in
design and regulative approvals and cost overrun.
The highest risk values on company level in Project 6 (WND)
in Egypt were for; the Change of regulation or laws,
Instability of economical conditions and Currency exchange
rate, besides on the project level the highest risk values were
of; delay in materials supplying, Availability of special
Equipment and Strict Safety and Health Requirements.
In project No.7 in Jordan Interaction of management with
local contracts, Future market volume and competitors and
Geographical Distance Obstacles have the highest risk values
on company level, while Weather and natural Causes of delay,
Availability of special Equipment and lack of skilled workers
have the highest risk values on project level.
The developed model could be useful in sorting projects on
the basis of risk, thus aiding decision making on company‘s
part in terms of the project in which they enter. The study
examined and tested a developed R model and proved its
strength in assessing risk (99%) on company level and also
(101%) on project level as shown in Test Factor section
(13.4). It can also be helpful in sorting the studied
construction projects in the bids stage to take suitable
preventive actions.
The ability to evaluate risk contingency values, was
demonstrated by the developed model, through aggregating
rules merging company risk index and project risk index by
applying fuzzy logic approach and MATLAB software.
According to the results of the suggested models, project No.
6 in Egypt had the highest risk contingency percentage of
48.5%, while the lowest risk contingency percentage 17%
where in project No. 5 in Egypt also. As for projects 1, 2, 4
and 7 in Saudi Arabia, UAE, Libya and Jordan, the risk
contingency of 29%, 39%, 20% and 28% respectively. The
actual results on the basis of the project‘s final reports were
close to those of the suggested program.
The case studies findings showed that the suggested model
can be applied in order to quantify risk ratings. The tool had
the advantage of offering a guidance for the company in terms
of the amount of risk premium which should be included in
mark- up. The study, through this model, has proved that
fuzzy logic approach that applies experts‘ knowledge
managed to overcome the lack of data and uncertainty in
predicting future events. It is expected that the model shall
offer a very wide range of application in estimating whole life
costs of public service.
REFERENCES
[1] Abdel Khalek H., Aziz R. and Kamel H., (2016). "Risk and
Uncertainty Assessment Model in Construction Projects Using
Fuzzy Logic‖. 1st International Conference on Sustainable
Construction and Project Management- ICSCPM16.Cairo. Egypt.
[2] Abdel Khalek H., Aziz R. and Kamel H., (2016). ―Uncertainty
and Risk Factors Assessment for Cross-Country Pipelines
Projects Using AHP‖. 1st International Conference on
Sustainable Construction and Project Management-
ICSCPM16.Cairo. Egypt.
[3] Abdel Khalek H., Aziz R. and Kamel H., (2016). "Risk and
Uncertainty Assessment Model in Construction Projects Using
17. International Journal of Latest Technology in Engineering, Management & Applied Science (IJLTEMAS)
2nd
Special Issue on Engineering and Technology | Volume VI, Issue VIS, June 2017 | ISSN 2278-2540
www.ijltemas.in Page 17
Fuzzy Logic‖. American Journal of Civil Engineering, Vol. 4, No.
1, 2016, pp. 24-39. doi: 10.11648/j.ajce.20160401.13. Published
online February 29, 2016
(http://www.sciencepublishinggroup.com/j/ajce), ISSN: 2330-
8729 (Print) ; ISSN: 2330-8737 (Online)
[4] Abdel Khalek H., Aziz R. and Kamel H., (2016). ―Uncertainty
and Risk Factors Assessment for Cross-Country Pipelines
Projects Using AHP‖. American Journal of Civil Engineering,
Vol. 4, No. 1, 2016, pp. 12-23. doi: 10.11648/j.ajce.20160401.12.
Published online February 23, 2016
(http://www.sciencepublishinggroup.com/j/ajce). ISSN: 2330-
8729 (Print); ISSN: 2330-8737 (Online).
[5] Antonio J., Monroy A., Gema S. and Angel L., (2011). ―Financial
Risks in Construction Projects‖. African Journal of Business
Management Vol. 5(31), Pp. 12325-12328, 7 December, 2011.
[6] Carreño M. L., Cardona O. D. and Barbat, A. H. (2004).
―Evaluation of the Risk Management Performance‖. 250th
Anniversary of The 1755 Lisbon Earthquake, 1technical
University of Catalonia, Barcelona, Spain.
[7] Deng X. And Low. (2012). ―Understanding The Critical Variables
Affecting the Level of Political Risks in International
Construction Projects‖. KSCE Journal of Civil Engineering
(2013) 17(5): 895-907.
[8] Dias A, and Ioannou P. (1996). ―Company and Project Evaluation
Model for Privately Promoted Infrastructure Projects. Journal of
Construction Engineering and Management, ASCE 1996; 122(1):
71–82. March.
[9] Dikmen I, Birgonul T and Han S. (2007). ―Using Fuzzy Risk
Assessment to Rate Cost Overrun Risk in International
Construction Projects‖. International Journal of Project
Management 25 (2007) 494–505.
[10] Enrique J., Ricardo C., Vicent E. and Jerónimo A., (2011),
Analytical Hierarchical Process (AHP) As A Decision Support
Tool In Water Resources Management, Journal Of Water Supply:
Research And Technology—Aqua (60.6 ) 2011.
[11] Garshasb A., Mostafa A. and Abas A., (2012). ―Fuzzy Adaptive
Decision Making Model for Selection Balanced Risk Allocation‖.
International Journal of Project Management 30 (2012) 511–522.
[12] Hyun- C., Hyo- C. And. Seo j., (2004). ―Risk Assessment
Methodology for Underground Construction Projects‖, ASCE
Journal of Construction Engineering and Management, 130, 258-
272.
[13] Jessica M., (2014), ―Pearson Correlation Coefficient: Formula,
Example & Significance‖. Http://Education-
Portal.Com/Academy /Lesson/Pearson-Correlation-Coefficient-
Formula-Example-Significance.Html#Lesson.
[14] John G. and Edward G. (2003). ―International Project Risk
Assessment: Methods, Procedures, and Critical Factors‖. A
Report Of The Center Construction Industry Studies The
University Of Texas At Austin.
[15] Liu Jun A, Wang Qiuzhen B, Ma Qingguo B. (2011). The Effects
of Project Uncertainty and Risk Management on IS Development
Project Performance‖. A Vendor Perspective International Journal
of Project Management 29 (2011) 923–933.
[16] Lotfi A. Zadeh. (2002). ―Fuzzy Logic Toolbox for Use with
MATLAB, User‘s Guide‖.
[17] Ludovic V, Marle F, Bocquet J, C. (2011). ―Measuring Project
Complexity Using the Analytic Hierarchy Process‖. International
Journal of Project Management 29 (2011) 718–727.
[18] Mag Malek. (2000). ―An Application of Fuzzy Modeling in
Construction Engineering‖. International Proceedings of the 36th
Annual Conference of the Associated Schools of Construction
(ASC), 287-300.
[19] Ming W., And Hui Ch. (2003). ―Risk Allocation and Risk
Handling of Highway Projects In Taiwan‖. Journal of
Management in Engineering, Asce / April 2003.
[20] Prasanta D. (2002). ―An Integrated Assessment Model For Cross
Country Pipelines‖. Environmental Impact Assessment Review,
22, (2002) 703–721.
[21] Pearson Correlation Coefficient Calculator. (2014), Http://Www.
Socscistatistics. Com/Tests /Pearson /Default2.Aspx.
[22] Pearson's Correlation Coefficient, Data Analysis, 2014, Http://
Learntech.Uwe.Ac.Uk/Da/ Default. Aspx? Pageid=1442.
[23] Prasanta D.(2010). ―Managing Project Risk Using Combined
Analytic Hierarchy Process and Risk Map‖. Applied Soft
Computing 10 (2010) 990–1000.
[24] Saaty TL. The Analytic Hierarchy Process. 1980. New York: Mc
graw- Hill, 1980.
[25] Saaty TL. Decision Making For Leaders. Belmont, California:
Life Time Leaning Publications, 1985.
[26] Saaty TL. (1990). ―How to Make a Decision: The Analytic
Hierarchy Process‖. European Journal of Operational Research,
North-Holland 1990; 48: 9±26.
[27] Saaty TL, Kearns KP. (1991). ―Analytical Planning: The
Organization of Systems‖. The Analytic Hierarchy Process Series
1991; Vol. 4RWS.
[28] Salman A. (2003). ―Study Of Applying Build Operate And
Transfer Bot Contractual System On Infrastructure Projects In
Egypt‖. PHD Thesis, Zagazig University, Faculty of Eng.
[29] Sou L., An C., And Chung Y. (2001). ―A GA_ based Fuzzy
Optimal Model For Construction Time-Cost Trade Off‖.
International Journal of Project Management, 19(1), 47-58.
[30] Wang, N., Horner and M. El-Haram. (2004). ―Fuzzy Logic
Approach To A Generic Elemental Whole Life Costing Model‖,
Twentieth Annual Conference Of Association Of Researchers In
Construction Management, Vol. 1, 383-391, Edinburgh.
[31] Zayed T, Mohamed A, Jiayin P. (2008). "Assessing Risk And
Uncertainty Inherent In Chinese Highway Projects Using AHP
―Internal Journal Of Project Management‖ 26 (2008) 408–419.
[32] Bu-Qammaz, A. S. (2007), ―risk assessment of international
construction projects using the analytic network process‖, master
of science thesis, Middle East technical university.
[33] Cooper D, Grey S, Raymond G and Walker P, 2007, ―Project Risk
Management Guidelines: Managing Risk in Large Projects and
Complex Procurements‖, John Wiley & Sons, Ltd, ISBN 0-470-
02281-7.
[34] Zayed, T, and Chang, L. (2002). "Prototype Model for Build-
Operate-Transfer Risk Assessment. Journal of Management in
Engineering / January 2002 / 7.
[35] Xiaoping D., And Pheng L., (2012). ―Understanding the Critical
Variables Affecting the Level of Political Risks in International
Construction Projects‖. KSCE Journal of Civil Engineering
(2013) 17(5):895-907.
[36] Mohamed A. and Aminah F., (2010). ―Risk management in the
construction industry using combined fuzzy FMEA and fuzzy
AHP‖. Journal of construction engineering and management,
ASCE / September 2010.
[37] Whyte, A. , 2014, Integrated Design and Cost Management for
Civil Engineers, CRC Press, Taylor & Francis Group 6000
Broken Sound Parkway NW, Suite 300, Boca Raton, FL 33487-
18. International Journal of Latest Technology in Engineering, Management & Applied Science (IJLTEMAS)
2nd
Special Issue on Engineering and Technology | Volume VI, Issue VIS, June 2017 | ISSN 2278-2540
www.ijltemas.in Page 18
2742, International Standard Book Number-13: 978-0-203-
12760-5 (eBook - PDF).
[38] Mishra, S. and Mishra, B.,(2016). ―A Study on Risk Factors
Involved in the Construction Projects‖. International Journal of
Innovative Research in Science, Engineering and Technology,
Vol. 5, Issue 2, February 2016.
[39] K., Jayasudha and B. Vidivelli. (2016). ―Analysis of major risks
in construction projects ―. vol. 11, no. 11, June 2016 ARPN
journal of engineering and applied sciences.
[40] Berenger Y. Renault and Justus N. Agumba. (2016). ―Risk
management in the construction industry: a new literature
review‖. MATEC Web of Conferences 00008 (2016) IBCC 2016.