Mineral potential mapping as a strategic planning tool in the eastern Lachlan...Kenex Ltd
The Geological Survey of New South Wales (GSNSW) is undertaking a statewide mineral potential mapping project driven by the need to provide justifiable land use planning advice to key government stakeholders and to highlight the exploration potential of the state’s major mineral systems at a regional scale. Following delivery of mineral potential data packages for the Southern New England Orogen in 2017, and the Curnamona Province and Delamerian Thomson Orogen in 2018, the eastern Lachlan Orogen was selected as the next area for a review of key mineral systems and mineral potential. The study area covers the Lachlan Orogen east of the Gilmore Fault and the study mapped the mineral potential for porphyry Cu–Au, polymetallic skarn, Kanimblan orogenic Au, Tabberabberan orogenic Au, and VAMS mineral systems.
The full report and data package can be downloaded from: https://search.geoscience.nsw.gov.au/product/9253
Mineral Potential Mapping for Pre-Competitive Data Delivery in NSW Zone 54Kenex Ltd
This presentation explores the benefits of using all available geosciences data to provide the most reliable basis for exploration decision-making and from which to develop the most appropriate and cost-effective exploration programs.
The Tampia Hill gold deposit, is located near the town of Narembeen in the Wheatbelt of Western Australia, 25 km east of Perth. Explaurum held the project from 2014 until the end of 2018 and during this period Kenex provided key services including on-site project management, interpretation of downhole wireline data, building 2D and 3D geological maps, and 3D mineral potential mapping for resource domaining and to help target grade control drilling inside the pit design. Kenex were also involved in the compilation of data over the wider area around Tampia and helping to target exploration using updated geological maps and mineral potential mapping.
Mineral potential mapping in Bundarra, QueenslandKenex Ltd
The Bundarra porphyry Cu-Au project is held by Duke Exploration Ltd, and is located in central Queensland, Australia, 110 km south-west of Mackay. The project was acquired in 2017. Kenex has completed, for Duke, detailed mineral potential mapping over the project area, in order to focus drilling funds on the most prospective areas.
The project area surrounds the Cretaceous Bundarra Granodiorite, which intrudes the Permian Back Creek Group carbonaceous shales, sandstones and marls. Numerous Cu-Au occurrences are present within or near the hornfelsed contact aureole of the granodiorite. The project has been subject to significant exploration work, including mining of high-grade ore shoots in the late 1800s to early 1900s, however, modern exploration has been sporadic, and without comprehensive follow-up of encouraging results.
All available historic data has been compiled and incorporated into a mineral potential map based on the porphyry mineral system. Maps representing all components of the porphyry mineral system including source, transport, trap and deposition have been created, resulting in binary maps which show where each characteristic is present or absent. These are then compared to known mineral occurrences, or training points. The weights of evidence technique was used for the modelling. This technique calculates the relationship of the area covered by the characteristic being tested and the number of training data points that fall within that area. For each map a contrast value ‘C’ gives a relative measure of the strength of the correlation, and a Studentised contrast value ‘StudC’ gives a relative measure of the reliability of the C value, i.e. a high C and StudC value implies a strong spatial correlation and a reliable result, which occurs when more training points are captured within a smaller area.
The maps with the best spatial correlation to the training points for each mineral system component were selected for the final mineral potential model. Table 1 shows the eight spatial variables which were selected from a total of 60 mapped.
Kenex have been working with Duke Exploration in order to develop exploration targets for base and precious metal mineralisation in Australia. We have been involved throughout all stages of the exploration workflow, details of which are provided below. The Bundarra project represents one of the most successful exploration targeting projects that Kenex has been involved with and promises to be even more exciting in the future!
Basic concept, System Architecture, GPS and GLONASS Overview, Satellite Navigation, Time and GPS, User Position and Velocity Calculations, GPS Satellite Constellation, Operation Segment, User Receiving Equipment, Space Segment Phased Development, GPS Aided Geo augmented Navigation (GAGAN) Architecture.
William E. Willoughby, Randolph A. Jones, George L. Mason, Sally A. Shoop, James H. Lever U.S. Army Engineer Research and Development Center, CEERD-GM-M, 3909 Halls Ferry Road, Vicksburg, MS, USA 39180-6199
2012 ASPRS Track, Intertidal Coastal Vegetation Mapping, Joe ChuitaGIS in the Rockies
Sea Grant California supports the aquatic resources along the coast of California. Ocean imaging was tasked by Sea Grant to map the vegetation of the intertidal zones along a 290km stretch of the mid-northern coast of California. This product will provide a baseline vegetation classification dataset to be compared to in the future especially in Marine Protected Areas (MPAs).
Initially, to obtain the data, the coast was flown capturing images with a multispectral camera at 1 meter resolution. New data was obtained that captured imagery with 30cm resolution. Each of these datasets was useful due to the varying tide levels.
The data was classified using training sets and the Maximum Likelihood Classification routines in ArcGIS. The vegetation classifications were analyzed and subsequently manually edited to improve accuracy. Since tide levels varied, each dataset contributed information to the final product. The 30cm data was resampled to match the 1 meter resolution data and the two were combined to eliminate areas classified as whitewater or improve the kelp classification in the water where possible.
The final product resulted in a 16 class classification of the intertidal zones which includes: Mixed Red/Brown Algae, Green Algae, Blue-Green Algae, Wrack, and Kelp. The final classification yielded an 86% accuracy assessment utilizing the Congalton method for determining accuracy.
2015 Broken Hill Resources Investment Symposium - Geological Survey of South...Symposium
"Curnamona Proterozoic Geochronology".
Liz Jagodzinski, Geochronologist, Geological Survey of South Australia.
Technical presentation at 2015 Broken Hill Resources Investment symposium.
2013 ICEEFP 3D Tracking Error Analyses_Darin EtheringtonChrista Woodley
To 3-D track acoustically tagged fish with measured certainty, error analyses are needed to verify the tracking system‘s performance. The methods detailed below utilize JSATS cabled hydrophone array systems and acoustic micro-transmitters. These processes are conducted after deployment of the array systems, and verify the positional accuracy of tagged fish movements through the tracking baseline of a detection array.
Veracity Networks provides service with 97% customer satisfaction; customers don't only sign up with us because of our top of the line product, but also because of our customer support delivered with a local touch. We deliver a life changing product by delivering what we promise. We convey excellent care with consistency, and proactive with our customer care.
Democratizing Fuzzing at Scale by Abhishek Aryaabh.arya
Presented at NUS: Fuzzing and Software Security Summer School 2024
This keynote talks about the democratization of fuzzing at scale, highlighting the collaboration between open source communities, academia, and industry to advance the field of fuzzing. It delves into the history of fuzzing, the development of scalable fuzzing platforms, and the empowerment of community-driven research. The talk will further discuss recent advancements leveraging AI/ML and offer insights into the future evolution of the fuzzing landscape.
Sachpazis:Terzaghi Bearing Capacity Estimation in simple terms with Calculati...Dr.Costas Sachpazis
Terzaghi's soil bearing capacity theory, developed by Karl Terzaghi, is a fundamental principle in geotechnical engineering used to determine the bearing capacity of shallow foundations. This theory provides a method to calculate the ultimate bearing capacity of soil, which is the maximum load per unit area that the soil can support without undergoing shear failure. The Calculation HTML Code included.
Welcome to WIPAC Monthly the magazine brought to you by the LinkedIn Group Water Industry Process Automation & Control.
In this month's edition, along with this month's industry news to celebrate the 13 years since the group was created we have articles including
A case study of the used of Advanced Process Control at the Wastewater Treatment works at Lleida in Spain
A look back on an article on smart wastewater networks in order to see how the industry has measured up in the interim around the adoption of Digital Transformation in the Water Industry.
Automobile Management System Project Report.pdfKamal Acharya
The proposed project is developed to manage the automobile in the automobile dealer company. The main module in this project is login, automobile management, customer management, sales, complaints and reports. The first module is the login. The automobile showroom owner should login to the project for usage. The username and password are verified and if it is correct, next form opens. If the username and password are not correct, it shows the error message.
When a customer search for a automobile, if the automobile is available, they will be taken to a page that shows the details of the automobile including automobile name, automobile ID, quantity, price etc. “Automobile Management System” is useful for maintaining automobiles, customers effectively and hence helps for establishing good relation between customer and automobile organization. It contains various customized modules for effectively maintaining automobiles and stock information accurately and safely.
When the automobile is sold to the customer, stock will be reduced automatically. When a new purchase is made, stock will be increased automatically. While selecting automobiles for sale, the proposed software will automatically check for total number of available stock of that particular item, if the total stock of that particular item is less than 5, software will notify the user to purchase the particular item.
Also when the user tries to sale items which are not in stock, the system will prompt the user that the stock is not enough. Customers of this system can search for a automobile; can purchase a automobile easily by selecting fast. On the other hand the stock of automobiles can be maintained perfectly by the automobile shop manager overcoming the drawbacks of existing system.
TECHNICAL TRAINING MANUAL GENERAL FAMILIARIZATION COURSEDuvanRamosGarzon1
AIRCRAFT GENERAL
The Single Aisle is the most advanced family aircraft in service today, with fly-by-wire flight controls.
The A318, A319, A320 and A321 are twin-engine subsonic medium range aircraft.
The family offers a choice of engines
Immunizing Image Classifiers Against Localized Adversary Attacksgerogepatton
This paper addresses the vulnerability of deep learning models, particularly convolutional neural networks
(CNN)s, to adversarial attacks and presents a proactive training technique designed to counter them. We
introduce a novel volumization algorithm, which transforms 2D images into 3D volumetric representations.
When combined with 3D convolution and deep curriculum learning optimization (CLO), itsignificantly improves
the immunity of models against localized universal attacks by up to 40%. We evaluate our proposed approach
using contemporary CNN architectures and the modified Canadian Institute for Advanced Research (CIFAR-10
and CIFAR-100) and ImageNet Large Scale Visual Recognition Challenge (ILSVRC12) datasets, showcasing
accuracy improvements over previous techniques. The results indicate that the combination of the volumetric
input and curriculum learning holds significant promise for mitigating adversarial attacks without necessitating
adversary training.
CFD Simulation of By-pass Flow in a HRSG module by R&R Consult.pptxR&R Consult
CFD analysis is incredibly effective at solving mysteries and improving the performance of complex systems!
Here's a great example: At a large natural gas-fired power plant, where they use waste heat to generate steam and energy, they were puzzled that their boiler wasn't producing as much steam as expected.
R&R and Tetra Engineering Group Inc. were asked to solve the issue with reduced steam production.
An inspection had shown that a significant amount of hot flue gas was bypassing the boiler tubes, where the heat was supposed to be transferred.
R&R Consult conducted a CFD analysis, which revealed that 6.3% of the flue gas was bypassing the boiler tubes without transferring heat. The analysis also showed that the flue gas was instead being directed along the sides of the boiler and between the modules that were supposed to capture the heat. This was the cause of the reduced performance.
Based on our results, Tetra Engineering installed covering plates to reduce the bypass flow. This improved the boiler's performance and increased electricity production.
It is always satisfying when we can help solve complex challenges like this. Do your systems also need a check-up or optimization? Give us a call!
Work done in cooperation with James Malloy and David Moelling from Tetra Engineering.
More examples of our work https://www.r-r-consult.dk/en/cases-en/
CFD Simulation of By-pass Flow in a HRSG module by R&R Consult.pptx
Restoration & Mattress Survey
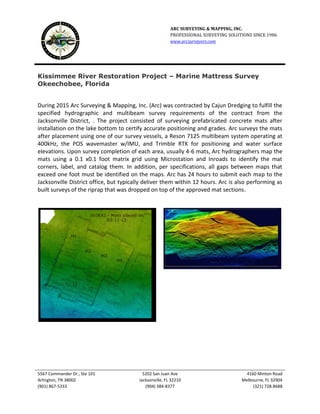
1. ARC SURVEYING & MAPPING, INC.
PROFESSIONAL SURVEYING SOLUTIONS SINCE 1986
www.arcsurveyors.com
5567 Commander Dr., Ste 101 5202 San Juan Ave 4160 Minton Road
Arlington, TN 38002 Jacksonville, FL 32210 Melbourne, FL 32904
(901) 867-5333 (904) 384-8377 (321) 728-8688
Kissimmee River Restoration Project – Marine Mattress Survey
Okeechobee, Florida
During 2015 Arc Surveying & Mapping, Inc. (Arc) was contracted by Cajun Dredging to fulfill the
specified hydrographic and multibeam survey requirements of the contract from the
Jacksonville District, . The project consisted of surveying prefabricated concrete mats after
installation on the lake bottom to certify accurate positioning and grades. Arc surveys the mats
after placement using one of our survey vessels, a Reson 7125 multibeam system operating at
400kHz, the POS wavemaster w/IMU, and Trimble RTK for positioning and water surface
elevations. Upon survey completion of each area, usually 4-6 mats, Arc hydrographers map the
mats using a 0.1 x0.1 foot matrix grid using Microstation and Inroads to identify the mat
corners, label, and catalog them. In addition, per specifications, all gaps between maps that
exceed one foot must be identified on the maps. Arc has 24 hours to submit each map to the
Jacksonville District office, but typically deliver them within 12 hours. Arc is also performing as
built surveys of the riprap that was dropped on top of the approved mat sections.