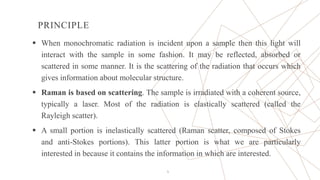
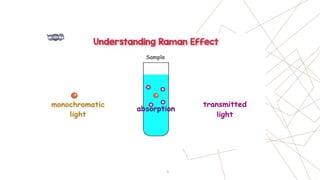
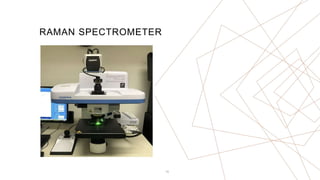
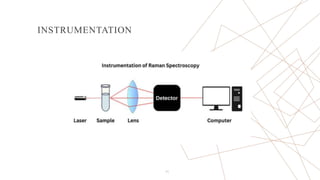
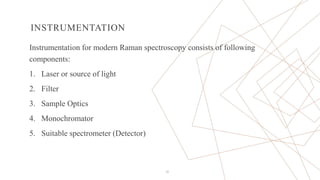
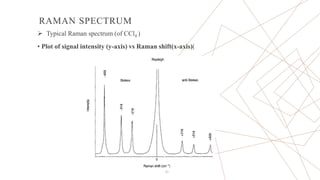
DEPARTMENT OF PHARMACEUTICAL SCIENCES
RASHTRASANT TUKADOJI MAHARAJ NAGPUR
UNIVERSITY, NAGPUR - 440033
Topic: RAMAN SPECTROSCOPY
PRESENTED BY
TAHMINA KHAN
M. PHARM. FRIST YEAR
PHARMACEUTICAL CHEMISTRY
CONTENT
 INTRODUCTION
 PRINCIPLE
 QUANTUM THEORY OF RAMAN SCATTERING
 INSTRUMENTATION
 RAMAN SPECTRUM
 COMPARISON BETWEEN RAMAN AND IR SPECTROSCOPY
 APPLICATION
 REFERENCE
2
1. RAYLEIGH SCATTERING
2. STOKES SCATTERING
3. ANTI-STOKES SCATTERING
INTRODUCTION
 Raman spectroscopy was discovered by C. V. Raman in 1928.
 He was awarded by Noble prize in 1930 and Bharat ratan in 1954
 It is a spectroscopic technique used to observe vibration, rotational, and
other low-frequency modes in a system.
 Raman spectroscopy is commonly used in chemistry to provide a
fingerprint by which molecules can be identified.
4
PRINCIPLE
 When monochromatic radiation is incident upon a sample then this light will
interact with the sample in some fashion. It may be reflected, absorbed or
scattered in some manner. It is the scattering of the radiation that occurs which
gives information about molecular structure.
 Raman is based on scattering. The sample is irradiated with a coherent source,
typically a laser. Most of the radiation is elastically scattered (called the
Rayleigh scatter).
 A small portion is inelastically scattered (Raman scatter, composed of Stokes
and anti-Stokes portions). This latter portion is what we are particularly
interested in because it contains the information in which are interested.
5
6
Quantum Theory Of Raman Scattering
The emitted radiation is of three types
1. Rayleigh scattering
7
There is no net absorption or
Emission of light the
Output =input
hvs= hvI
vs = v i
2. Stokes scattering
8
There is net absorption of rad. So
Scattered Energy = Input-absorbed
Energy
hvs= hvI -hv o
vs < v i
3. Anti-stokes Scattering
9
There is net absorption of rad.
So
Scattered Energy = Input-
Emitted Energy
hvs= hvI + hvo
vs > v i
RAMAN SPECTROMETER
10
INSTRUMENTATION
11
INSTRUMENTATION
Instrumentation for modern Raman spectroscopy consists of following
components:
1. Laser or source of light
2. Filter
3. Sample Optics
4. Monochromator
5. Suitable spectrometer (Detector)
12
13
1) Laser or source of light
 Laser are generally the only source strong enough to scatter lots of light
and lead to detectable in Raman spectroscopy.
 The sources used in modern Raman spectrometry are nearly always
lasers because their high intensity is necessary to produce Raman
scattering of sufficient intensity to be measured with a reasonable
signal-to-noise ratio.
S.No. Laser wavelength
01 Nd:YAG 1064nm
02 Helium : Neon 633nm
03 Argon ion 488.0 or 514.5nm
04 Ga:Al:As diode 785.0 or 830.0nm
05 Krypton 530.9 or 647.1mn
14
List of Various Laser Source
2) FILTER
 It is used to eliminated unwanted radiations.
 For getting monochromatic radiation filters used.
 They may be made of Nikel oxide, glass or quartz glass.
 Sometimes a suitable coloured solution such as an aqueous solution of
ferri cyanide or iodide in CCl2 may be used as monochromator.
15
3) Sample Optics :
 For study Raman effects the type of sample holder to be used depends upon
intensity of light , nature and availability of solvent.
1. For Liquid Samples:
 A major advantage of sample handling in Raman spectroscopy compared with
infrared arises because water is a weak Raman scattered but a strong absorber of
infrared radiation. Thus, aqueous solutions can be studied by Raman spectroscopy
but not by infrared.
 This advantage is particularly important for biological and inorganic systems
and in studies dealing with water pollution problems.
16
2. For Solid Samples:
 Solid sample used in Raman spectroscopy is in the form of pellets and
powders.
3. For Gas samples:
 Gases required sample optics bigger than those for liquid. (for more
quantity)
 Gas are normally contain in glass tubes, 1-2 cm in diameter and about 1mm
thick.
 Gases can also be sealed in small capillary tubes
17
MONOCHROMATOR
 Raman spectroscopy incorporate two or more grating monochromators
It is used:
1. To increase the resolving power of spectrometer.
2. To reduce background caused by Rayleigh scattering by the sample.
18
4) Raman Spectrometers
 Raman spectrometers were similar in design and used the same type of
components as the classical ultraviolet/visible dispersing instruments i.e
photomultiplier or photocounting
 Most employed double grating systems to minimize the spurious radiation
reaching the transducer. Photomultipliers served as transducers.
 In this photon incident on photocathode causes the emission of electron, the
number emitted being proportional to that of photon ,and the amplify the
signal in recorder.
19
PHOTOMULTIPLIER
20
RAMAN SPECTRUM
 Typical Raman spectrum (of CCl4 )
• Plot of signal intensity (y-axis) vs Raman shift(x-axis)(
21
PEAK POSITION
 The 4000-2500 cm -1 is the region where single bonds (X-H) absorb
 The 2500-2000 cm -1 ,is referred to as the multiple bond (-N=C=O ) region
 The 2000-1500 cm -1, region is where double bond (-C=O, -C=N , -C=C- ) occur
 Below 1500 cm -1 , some group e.g. nitro (O=N=O) do have specific bonds but many
molecule have complete pattern of Carbon –Carbon and Carbon-Nitrogen
vibrations . The region is generally referred to as the fingerprint region .
 The significant bond below 650 cm -1 usually arise from inorganic group , metal
organic group or lattice vibration.
22
COMPARISON BETWEEN RAMAN AND IR SPECTROSCOPY
RAMAN SPECTROSCOPY IR SPECTROSCOPY
 Analysis of scattered light of the
vibrating molecule
 Analysis of absorption of the vibrating
molecule.
 Vibration is Raman active if it causes a
change in the polarizability
 Vibration is IR active if change in the
dipole moment during the vibration
occurs
 Molecules may not have a dipole
moment
 chemical bond must have the
characteristic of an electric dipole .
 Water can be used as solvent.  Water can not be used as solvent due to
intense absorption.
 No need for specific sample
preparation.
 Required specific sample preparation.
 Expensive instrumentation costs are
relatively very high.
 Relatively expensive instrumentation.
23
APPLICATION
1. Raman Spectra of Inorganic Species
 The Raman technique is often superior to infrared for spectroscopy investigating
inorganic systems because aqueous solutions can be employed.
 In addition, the vibrational energies of metal-ligand bonds are generally in the range
of 100 to 700 cm-1, a region of the infrared that is experimentally difficult to study.
4. Biological Applications of Raman Spectroscopy
 Raman spectroscopy has been applied widely for the of biological systems. The
advantages of his technique include the small sample requirement, the minimal
sensitivity toward interference by water, the spectral detail, and the conformational
and environmental sensitivity.
24
2. Raman Spectra of Organic Species
 Raman spectra are similar to infrared spectra in that they have regions that are useful
for functional group detection and fingerprint regions that permit the identification of
specific compounds.
 Raman spectra yield more information about certain types of organic compounds than
do their infrared counterparts.
3. Quantitative applications
 Raman spectra tend to be less cluttered with peaks than infrared spectra. As a
consequence, peak overlap in mixtures is less likely, and quantitative measurements
are simpler.
 In addition, Raman sampling devices are not subject to attack by moisture, and small
amounts of water in a sample do not interfere.
25
WHY RAMAN SPECTRA IS BETTER THAN OTHER?
 Rotational spectroscopy is observed for the substance is Gaseous state, Vibrational spectra can be observed
for gaseous & Liquid state however Raman Spectra can be used with solids, liquids or gases.
 Raman Spectra can be used obtained even for O2, N2, C12 etc. which have no permanent dipole moment.
Such a study has not been possible by IR spectroscopy.
 Raman spectra is independent of incident frequency. It can be obtained for visible spectrum range which is
easy to adjust rather than IR or radio waves.
 No sample preparation needed.
 Not interfered by water.
 Non-destructive.
 Highly specific like a chemical fingerprint of a material.
 Raman spectra are acquired quickly within seconds.
 Samples packaging. Can be analyzed through glass or a polymer.
26
REFERENCE
 Instrumental Analysis by Skoog Holler Crouch; 533-550
 Elementary Organic Spectroscopy Y R Sharma ; 164-190
 Purohit, Vishwas. “Sir C.V.Raman and Raman Spectroscopy (1888-1970).”
 Buzzle.com. 1 Apr. 2005. 19 Apr. 2009
http://www.buzzle.com/editorials/4-1 2005-67909.asp.
27
THANK YOU.
28

raman spectroscopy 2.pptx

  • 1.
    DEPARTMENT OF PHARMACEUTICALSCIENCES RASHTRASANT TUKADOJI MAHARAJ NAGPUR UNIVERSITY, NAGPUR - 440033 Topic: RAMAN SPECTROSCOPY PRESENTED BY TAHMINA KHAN M. PHARM. FRIST YEAR PHARMACEUTICAL CHEMISTRY
  • 2.
    CONTENT  INTRODUCTION  PRINCIPLE QUANTUM THEORY OF RAMAN SCATTERING  INSTRUMENTATION  RAMAN SPECTRUM  COMPARISON BETWEEN RAMAN AND IR SPECTROSCOPY  APPLICATION  REFERENCE 2 1. RAYLEIGH SCATTERING 2. STOKES SCATTERING 3. ANTI-STOKES SCATTERING
  • 4.
    INTRODUCTION  Raman spectroscopywas discovered by C. V. Raman in 1928.  He was awarded by Noble prize in 1930 and Bharat ratan in 1954  It is a spectroscopic technique used to observe vibration, rotational, and other low-frequency modes in a system.  Raman spectroscopy is commonly used in chemistry to provide a fingerprint by which molecules can be identified. 4
  • 5.
    PRINCIPLE  When monochromaticradiation is incident upon a sample then this light will interact with the sample in some fashion. It may be reflected, absorbed or scattered in some manner. It is the scattering of the radiation that occurs which gives information about molecular structure.  Raman is based on scattering. The sample is irradiated with a coherent source, typically a laser. Most of the radiation is elastically scattered (called the Rayleigh scatter).  A small portion is inelastically scattered (Raman scatter, composed of Stokes and anti-Stokes portions). This latter portion is what we are particularly interested in because it contains the information in which are interested. 5
  • 6.
  • 7.
    Quantum Theory OfRaman Scattering The emitted radiation is of three types 1. Rayleigh scattering 7 There is no net absorption or Emission of light the Output =input hvs= hvI vs = v i
  • 8.
    2. Stokes scattering 8 Thereis net absorption of rad. So Scattered Energy = Input-absorbed Energy hvs= hvI -hv o vs < v i
  • 9.
    3. Anti-stokes Scattering 9 Thereis net absorption of rad. So Scattered Energy = Input- Emitted Energy hvs= hvI + hvo vs > v i
  • 10.
  • 11.
  • 12.
    INSTRUMENTATION Instrumentation for modernRaman spectroscopy consists of following components: 1. Laser or source of light 2. Filter 3. Sample Optics 4. Monochromator 5. Suitable spectrometer (Detector) 12
  • 13.
    13 1) Laser orsource of light  Laser are generally the only source strong enough to scatter lots of light and lead to detectable in Raman spectroscopy.  The sources used in modern Raman spectrometry are nearly always lasers because their high intensity is necessary to produce Raman scattering of sufficient intensity to be measured with a reasonable signal-to-noise ratio.
  • 14.
    S.No. Laser wavelength 01Nd:YAG 1064nm 02 Helium : Neon 633nm 03 Argon ion 488.0 or 514.5nm 04 Ga:Al:As diode 785.0 or 830.0nm 05 Krypton 530.9 or 647.1mn 14 List of Various Laser Source
  • 15.
    2) FILTER  Itis used to eliminated unwanted radiations.  For getting monochromatic radiation filters used.  They may be made of Nikel oxide, glass or quartz glass.  Sometimes a suitable coloured solution such as an aqueous solution of ferri cyanide or iodide in CCl2 may be used as monochromator. 15
  • 16.
    3) Sample Optics:  For study Raman effects the type of sample holder to be used depends upon intensity of light , nature and availability of solvent. 1. For Liquid Samples:  A major advantage of sample handling in Raman spectroscopy compared with infrared arises because water is a weak Raman scattered but a strong absorber of infrared radiation. Thus, aqueous solutions can be studied by Raman spectroscopy but not by infrared.  This advantage is particularly important for biological and inorganic systems and in studies dealing with water pollution problems. 16
  • 17.
    2. For SolidSamples:  Solid sample used in Raman spectroscopy is in the form of pellets and powders. 3. For Gas samples:  Gases required sample optics bigger than those for liquid. (for more quantity)  Gas are normally contain in glass tubes, 1-2 cm in diameter and about 1mm thick.  Gases can also be sealed in small capillary tubes 17
  • 18.
    MONOCHROMATOR  Raman spectroscopyincorporate two or more grating monochromators It is used: 1. To increase the resolving power of spectrometer. 2. To reduce background caused by Rayleigh scattering by the sample. 18
  • 19.
    4) Raman Spectrometers Raman spectrometers were similar in design and used the same type of components as the classical ultraviolet/visible dispersing instruments i.e photomultiplier or photocounting  Most employed double grating systems to minimize the spurious radiation reaching the transducer. Photomultipliers served as transducers.  In this photon incident on photocathode causes the emission of electron, the number emitted being proportional to that of photon ,and the amplify the signal in recorder. 19
  • 20.
  • 21.
    RAMAN SPECTRUM  TypicalRaman spectrum (of CCl4 ) • Plot of signal intensity (y-axis) vs Raman shift(x-axis)( 21
  • 22.
    PEAK POSITION  The4000-2500 cm -1 is the region where single bonds (X-H) absorb  The 2500-2000 cm -1 ,is referred to as the multiple bond (-N=C=O ) region  The 2000-1500 cm -1, region is where double bond (-C=O, -C=N , -C=C- ) occur  Below 1500 cm -1 , some group e.g. nitro (O=N=O) do have specific bonds but many molecule have complete pattern of Carbon –Carbon and Carbon-Nitrogen vibrations . The region is generally referred to as the fingerprint region .  The significant bond below 650 cm -1 usually arise from inorganic group , metal organic group or lattice vibration. 22
  • 23.
    COMPARISON BETWEEN RAMANAND IR SPECTROSCOPY RAMAN SPECTROSCOPY IR SPECTROSCOPY  Analysis of scattered light of the vibrating molecule  Analysis of absorption of the vibrating molecule.  Vibration is Raman active if it causes a change in the polarizability  Vibration is IR active if change in the dipole moment during the vibration occurs  Molecules may not have a dipole moment  chemical bond must have the characteristic of an electric dipole .  Water can be used as solvent.  Water can not be used as solvent due to intense absorption.  No need for specific sample preparation.  Required specific sample preparation.  Expensive instrumentation costs are relatively very high.  Relatively expensive instrumentation. 23
  • 24.
    APPLICATION 1. Raman Spectraof Inorganic Species  The Raman technique is often superior to infrared for spectroscopy investigating inorganic systems because aqueous solutions can be employed.  In addition, the vibrational energies of metal-ligand bonds are generally in the range of 100 to 700 cm-1, a region of the infrared that is experimentally difficult to study. 4. Biological Applications of Raman Spectroscopy  Raman spectroscopy has been applied widely for the of biological systems. The advantages of his technique include the small sample requirement, the minimal sensitivity toward interference by water, the spectral detail, and the conformational and environmental sensitivity. 24
  • 25.
    2. Raman Spectraof Organic Species  Raman spectra are similar to infrared spectra in that they have regions that are useful for functional group detection and fingerprint regions that permit the identification of specific compounds.  Raman spectra yield more information about certain types of organic compounds than do their infrared counterparts. 3. Quantitative applications  Raman spectra tend to be less cluttered with peaks than infrared spectra. As a consequence, peak overlap in mixtures is less likely, and quantitative measurements are simpler.  In addition, Raman sampling devices are not subject to attack by moisture, and small amounts of water in a sample do not interfere. 25
  • 26.
    WHY RAMAN SPECTRAIS BETTER THAN OTHER?  Rotational spectroscopy is observed for the substance is Gaseous state, Vibrational spectra can be observed for gaseous & Liquid state however Raman Spectra can be used with solids, liquids or gases.  Raman Spectra can be used obtained even for O2, N2, C12 etc. which have no permanent dipole moment. Such a study has not been possible by IR spectroscopy.  Raman spectra is independent of incident frequency. It can be obtained for visible spectrum range which is easy to adjust rather than IR or radio waves.  No sample preparation needed.  Not interfered by water.  Non-destructive.  Highly specific like a chemical fingerprint of a material.  Raman spectra are acquired quickly within seconds.  Samples packaging. Can be analyzed through glass or a polymer. 26
  • 27.
    REFERENCE  Instrumental Analysisby Skoog Holler Crouch; 533-550  Elementary Organic Spectroscopy Y R Sharma ; 164-190  Purohit, Vishwas. “Sir C.V.Raman and Raman Spectroscopy (1888-1970).”  Buzzle.com. 1 Apr. 2005. 19 Apr. 2009 http://www.buzzle.com/editorials/4-1 2005-67909.asp. 27
  • 28.