SlideShare a Scribd company logo
Raman Spectroscopy
A) Introduction
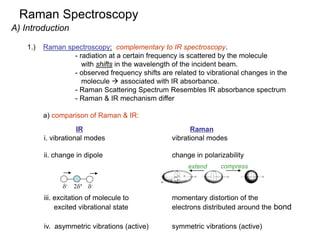
1.) Raman spectroscopy: complementary to IR spectroscopy.
- radiation at a certain frequency is scattered by the molecule
with shifts in the wavelength of the incident beam.
- observed frequency shifts are related to vibrational changes in the
molecule  associated with IR absorbance.
- Raman Scattering Spectrum Resembles IR absorbance spectrum
- Raman & IR mechanism differ
a) comparison of Raman & IR:
IR Raman
i. vibrational modes vibrational modes
ii. change in dipole change in polarizability
iii. excitation of molecule to momentary distortion of the
excited vibrational state electrons distributed around the bond
iv. asymmetric vibrations (active) symmetric vibrations (active)
d- 2d+ d-
extend compress
2.) Basic Principals of Raman Spectroscopy:
- light is scattered by the sample at various angles by momentary
absorption to virtual state and reemission
energy absorbed by molecule
from photon of light
not quantized
No change in
electronic states
Infinite number
of virtual states
- some scattered emissions occur at the same energy while others return
in a different state
Rayleigh Scattering
no change in energy
hnin = hnout
Elastic: collision between photon and molecule results in no change in energy
Inelastic: collision between photon and molecule results in a net change in energy
Raman Scattering
net change in energy
hnin <> hnout
Anti-Stokes: E = hn + DE
Two Types of Raman Scattering
Stokes: E = hn - DE
DE – the energy of the first vibration level of the ground state – IR vibration absorbance
Raman frequency shift and IR absorption peak frequency are identical

- Resulting Raman Spectrum
Probability of Emission Observed Intensity
Raleigh scattering >> Stokes >> anti-Stokes
difference in population of energy levels of vibrational transitions
Intensity of Raman lines are 0.001% intensity of the source
Lower energy higher energy

3.) Active Raman Vibrations:
- need change in polarizability of molecule during vibration
- polarizability related to electron cloud distribution
example:
O = C = O IR inactive
Raman active
O = C = O IR active
Raman inactive
IR & Raman are complimentary. Can be cases where vibration is both IR & Raman
active (eg. SO2 – non-linear molecule)
In general:
IR tends to emphasize polar functional groups (R-OH, , etc.)
Raman emphasizes aromatic & carbon backbone (C=C, -CH2-, etc.)
- Raman does not “see” many common polar solvents can
use with aqueous samples – advantage over IR
C
O
Raman frequency range: 4000 -50 cm-1(Stokes and anti-stokes)
- comparison of Raman and IR Spectra
4.) Instrumentation:
- Basic design
i. ) Light source:
- generally a laser to get required intensity of light for reasonable S/N
• Raman scattering is only 0.001% of light source
- Doesn’t have to be in IR region, since look at changes around central peak.
• visible source used because of high intensity
• allows use of glass/quartz sample cells & optics
• UV/Vis type detectors (photomultiplier tubes)
4.) Applications:
a) Qualitative Information
i. characteristic regions for different groups as in IR
ii. Raman correlation charts available
iii. Good for aqueous based samples
iv. Useful for a variety of samples, organic, inorganic & biological
b) Quantitative Information – not routinely used
i. fewer technical problems than IR, fewer peaks
ii. Interference from fluorescence
iii. Higher cost
iii. Signal weak – require modified Raman methods
1) Resonance Raman spectroscopy allows detection
of 10-3 ->10-7M by using lasers light with
wavelength approaching electronic absorption
2) Surface enhanced Raman spectroscopy places
samples on metal or rough surfaces that increase
Raman scattering

More Related Content

Similar to raman-824.ppt

Raman fluorescencespec
Raman fluorescencespecRaman fluorescencespec
Raman fluorescencespec
Archa Dave
 
1.b IR spec.ppt.........................
1.b IR spec.ppt.........................1.b IR spec.ppt.........................
1.b IR spec.ppt.........................
YogeshSalunke22
 

Similar to raman-824.ppt (20)

RAMAN SPECTROSCOPY AND ITS APPLICATIONS
RAMAN SPECTROSCOPY AND ITS APPLICATIONSRAMAN SPECTROSCOPY AND ITS APPLICATIONS
RAMAN SPECTROSCOPY AND ITS APPLICATIONS
 
IR Spectroscopy.pptx
IR Spectroscopy.pptxIR Spectroscopy.pptx
IR Spectroscopy.pptx
 
raman 18.ppt
raman 18.pptraman 18.ppt
raman 18.ppt
 
Field Ion - Infrared- Raman Spectroscopy
Field Ion - Infrared- Raman SpectroscopyField Ion - Infrared- Raman Spectroscopy
Field Ion - Infrared- Raman Spectroscopy
 
Raman spectroscopy by nitish kumar
Raman spectroscopy by nitish kumarRaman spectroscopy by nitish kumar
Raman spectroscopy by nitish kumar
 
Raman spectroscopy
Raman spectroscopy Raman spectroscopy
Raman spectroscopy
 
Infrared (IR) Spectroscopy
Infrared (IR) SpectroscopyInfrared (IR) Spectroscopy
Infrared (IR) Spectroscopy
 
Lasers ppt by Dr. P D Shirbhate, .
Lasers ppt by Dr. P D Shirbhate, .Lasers ppt by Dr. P D Shirbhate, .
Lasers ppt by Dr. P D Shirbhate, .
 
Prabhakar singh ii sem-paper-ir spectroscopy &amp; fluorimetry
Prabhakar singh  ii sem-paper-ir spectroscopy &amp; fluorimetryPrabhakar singh  ii sem-paper-ir spectroscopy &amp; fluorimetry
Prabhakar singh ii sem-paper-ir spectroscopy &amp; fluorimetry
 
Raman Spectroscopy.pptx
Raman Spectroscopy.pptxRaman Spectroscopy.pptx
Raman Spectroscopy.pptx
 
Infrared spectroscopy
Infrared spectroscopyInfrared spectroscopy
Infrared spectroscopy
 
Raman spectroscopy
Raman spectroscopyRaman spectroscopy
Raman spectroscopy
 
Raman fluorescencespec
Raman fluorescencespecRaman fluorescencespec
Raman fluorescencespec
 
Laser
LaserLaser
Laser
 
IR and NMR spectroscopy
IR and NMR spectroscopyIR and NMR spectroscopy
IR and NMR spectroscopy
 
Lasers.pptx
Lasers.pptxLasers.pptx
Lasers.pptx
 
IR spectroscopy
IR spectroscopyIR spectroscopy
IR spectroscopy
 
I R spectroscopy
I R spectroscopyI R spectroscopy
I R spectroscopy
 
Ir
IrIr
Ir
 
1.b IR spec.ppt.........................
1.b IR spec.ppt.........................1.b IR spec.ppt.........................
1.b IR spec.ppt.........................
 

Recently uploaded

power quality voltage fluctuation UNIT - I.pptx
power quality voltage fluctuation UNIT - I.pptxpower quality voltage fluctuation UNIT - I.pptx
power quality voltage fluctuation UNIT - I.pptx
ViniHema
 
Antenna efficency lecture course chapter 3.pdf
Antenna  efficency lecture course chapter 3.pdfAntenna  efficency lecture course chapter 3.pdf
Antenna efficency lecture course chapter 3.pdf
AbrahamGadissa
 
Hall booking system project report .pdf
Hall booking system project report  .pdfHall booking system project report  .pdf
Hall booking system project report .pdf
Kamal Acharya
 
LIGA(E)11111111111111111111111111111111111111111.ppt
LIGA(E)11111111111111111111111111111111111111111.pptLIGA(E)11111111111111111111111111111111111111111.ppt
LIGA(E)11111111111111111111111111111111111111111.ppt
ssuser9bd3ba
 
Automobile Management System Project Report.pdf
Automobile Management System Project Report.pdfAutomobile Management System Project Report.pdf
Automobile Management System Project Report.pdf
Kamal Acharya
 
Laundry management system project report.pdf
Laundry management system project report.pdfLaundry management system project report.pdf
Laundry management system project report.pdf
Kamal Acharya
 
Fruit shop management system project report.pdf
Fruit shop management system project report.pdfFruit shop management system project report.pdf
Fruit shop management system project report.pdf
Kamal Acharya
 
Digital Signal Processing Lecture notes n.pdf
Digital Signal Processing Lecture notes n.pdfDigital Signal Processing Lecture notes n.pdf
Digital Signal Processing Lecture notes n.pdf
AbrahamGadissa
 

Recently uploaded (20)

power quality voltage fluctuation UNIT - I.pptx
power quality voltage fluctuation UNIT - I.pptxpower quality voltage fluctuation UNIT - I.pptx
power quality voltage fluctuation UNIT - I.pptx
 
Antenna efficency lecture course chapter 3.pdf
Antenna  efficency lecture course chapter 3.pdfAntenna  efficency lecture course chapter 3.pdf
Antenna efficency lecture course chapter 3.pdf
 
Hall booking system project report .pdf
Hall booking system project report  .pdfHall booking system project report  .pdf
Hall booking system project report .pdf
 
The Benefits and Techniques of Trenchless Pipe Repair.pdf
The Benefits and Techniques of Trenchless Pipe Repair.pdfThe Benefits and Techniques of Trenchless Pipe Repair.pdf
The Benefits and Techniques of Trenchless Pipe Repair.pdf
 
Democratizing Fuzzing at Scale by Abhishek Arya
Democratizing Fuzzing at Scale by Abhishek AryaDemocratizing Fuzzing at Scale by Abhishek Arya
Democratizing Fuzzing at Scale by Abhishek Arya
 
LIGA(E)11111111111111111111111111111111111111111.ppt
LIGA(E)11111111111111111111111111111111111111111.pptLIGA(E)11111111111111111111111111111111111111111.ppt
LIGA(E)11111111111111111111111111111111111111111.ppt
 
Introduction to Casting Processes in Manufacturing
Introduction to Casting Processes in ManufacturingIntroduction to Casting Processes in Manufacturing
Introduction to Casting Processes in Manufacturing
 
Industrial Training at Shahjalal Fertilizer Company Limited (SFCL)
Industrial Training at Shahjalal Fertilizer Company Limited (SFCL)Industrial Training at Shahjalal Fertilizer Company Limited (SFCL)
Industrial Training at Shahjalal Fertilizer Company Limited (SFCL)
 
Sachpazis:Terzaghi Bearing Capacity Estimation in simple terms with Calculati...
Sachpazis:Terzaghi Bearing Capacity Estimation in simple terms with Calculati...Sachpazis:Terzaghi Bearing Capacity Estimation in simple terms with Calculati...
Sachpazis:Terzaghi Bearing Capacity Estimation in simple terms with Calculati...
 
Cloud-Computing_CSE311_Computer-Networking CSE GUB BD - Shahidul.pptx
Cloud-Computing_CSE311_Computer-Networking CSE GUB BD - Shahidul.pptxCloud-Computing_CSE311_Computer-Networking CSE GUB BD - Shahidul.pptx
Cloud-Computing_CSE311_Computer-Networking CSE GUB BD - Shahidul.pptx
 
Top 13 Famous Civil Engineering Scientist
Top 13 Famous Civil Engineering ScientistTop 13 Famous Civil Engineering Scientist
Top 13 Famous Civil Engineering Scientist
 
A case study of cinema management system project report..pdf
A case study of cinema management system project report..pdfA case study of cinema management system project report..pdf
A case study of cinema management system project report..pdf
 
Automobile Management System Project Report.pdf
Automobile Management System Project Report.pdfAutomobile Management System Project Report.pdf
Automobile Management System Project Report.pdf
 
ASME IX(9) 2007 Full Version .pdf
ASME IX(9)  2007 Full Version       .pdfASME IX(9)  2007 Full Version       .pdf
ASME IX(9) 2007 Full Version .pdf
 
Laundry management system project report.pdf
Laundry management system project report.pdfLaundry management system project report.pdf
Laundry management system project report.pdf
 
Fruit shop management system project report.pdf
Fruit shop management system project report.pdfFruit shop management system project report.pdf
Fruit shop management system project report.pdf
 
Digital Signal Processing Lecture notes n.pdf
Digital Signal Processing Lecture notes n.pdfDigital Signal Processing Lecture notes n.pdf
Digital Signal Processing Lecture notes n.pdf
 
Online resume builder management system project report.pdf
Online resume builder management system project report.pdfOnline resume builder management system project report.pdf
Online resume builder management system project report.pdf
 
fundamentals of drawing and isometric and orthographic projection
fundamentals of drawing and isometric and orthographic projectionfundamentals of drawing and isometric and orthographic projection
fundamentals of drawing and isometric and orthographic projection
 
Final project report on grocery store management system..pdf
Final project report on grocery store management system..pdfFinal project report on grocery store management system..pdf
Final project report on grocery store management system..pdf
 

raman-824.ppt

  • 1. Raman Spectroscopy A) Introduction 1.) Raman spectroscopy: complementary to IR spectroscopy. - radiation at a certain frequency is scattered by the molecule with shifts in the wavelength of the incident beam. - observed frequency shifts are related to vibrational changes in the molecule  associated with IR absorbance. - Raman Scattering Spectrum Resembles IR absorbance spectrum - Raman & IR mechanism differ a) comparison of Raman & IR: IR Raman i. vibrational modes vibrational modes ii. change in dipole change in polarizability iii. excitation of molecule to momentary distortion of the excited vibrational state electrons distributed around the bond iv. asymmetric vibrations (active) symmetric vibrations (active) d- 2d+ d- extend compress
  • 2. 2.) Basic Principals of Raman Spectroscopy: - light is scattered by the sample at various angles by momentary absorption to virtual state and reemission energy absorbed by molecule from photon of light not quantized No change in electronic states Infinite number of virtual states
  • 3. - some scattered emissions occur at the same energy while others return in a different state Rayleigh Scattering no change in energy hnin = hnout Elastic: collision between photon and molecule results in no change in energy Inelastic: collision between photon and molecule results in a net change in energy Raman Scattering net change in energy hnin <> hnout
  • 4. Anti-Stokes: E = hn + DE Two Types of Raman Scattering Stokes: E = hn - DE DE – the energy of the first vibration level of the ground state – IR vibration absorbance Raman frequency shift and IR absorption peak frequency are identical 
  • 5. - Resulting Raman Spectrum Probability of Emission Observed Intensity Raleigh scattering >> Stokes >> anti-Stokes difference in population of energy levels of vibrational transitions Intensity of Raman lines are 0.001% intensity of the source Lower energy higher energy 
  • 6. 3.) Active Raman Vibrations: - need change in polarizability of molecule during vibration - polarizability related to electron cloud distribution example: O = C = O IR inactive Raman active O = C = O IR active Raman inactive IR & Raman are complimentary. Can be cases where vibration is both IR & Raman active (eg. SO2 – non-linear molecule) In general: IR tends to emphasize polar functional groups (R-OH, , etc.) Raman emphasizes aromatic & carbon backbone (C=C, -CH2-, etc.) - Raman does not “see” many common polar solvents can use with aqueous samples – advantage over IR C O Raman frequency range: 4000 -50 cm-1(Stokes and anti-stokes)
  • 7. - comparison of Raman and IR Spectra
  • 8. 4.) Instrumentation: - Basic design i. ) Light source: - generally a laser to get required intensity of light for reasonable S/N • Raman scattering is only 0.001% of light source - Doesn’t have to be in IR region, since look at changes around central peak. • visible source used because of high intensity • allows use of glass/quartz sample cells & optics • UV/Vis type detectors (photomultiplier tubes)
  • 9. 4.) Applications: a) Qualitative Information i. characteristic regions for different groups as in IR ii. Raman correlation charts available iii. Good for aqueous based samples iv. Useful for a variety of samples, organic, inorganic & biological b) Quantitative Information – not routinely used i. fewer technical problems than IR, fewer peaks ii. Interference from fluorescence iii. Higher cost iii. Signal weak – require modified Raman methods 1) Resonance Raman spectroscopy allows detection of 10-3 ->10-7M by using lasers light with wavelength approaching electronic absorption 2) Surface enhanced Raman spectroscopy places samples on metal or rough surfaces that increase Raman scattering