Download as PDF, PPTX

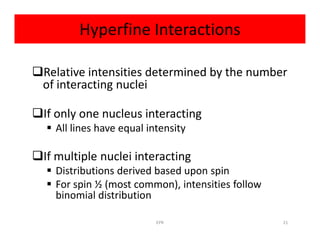
![Hyperfine Interactions
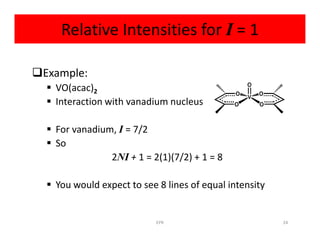
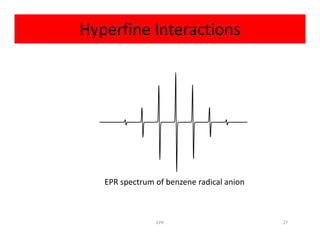
Example:
Radical anion of benzene [C6H6]-
Electron is delocalized over all six carbon atoms
• Exhibits coupling to six equivalent hydrogen atoms• Exhibits coupling to six equivalent hydrogen atoms
So
2NI + 1 = 2(6)(1/2) + 1 = 7
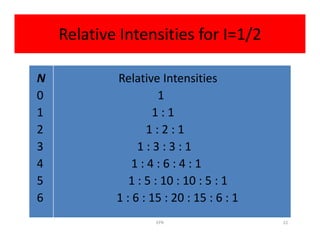
So spectrum should be seven lines with relative
intensities 1:6:15:20:15:6:1
26EPR](https://image.slidesharecdn.com/masreshaeprspectroscopy-150514113624-lva1-app6892/85/EPR-spectroscopy-26-320.jpg)


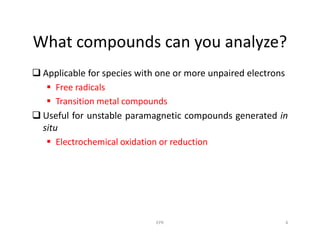
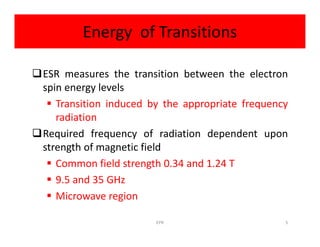
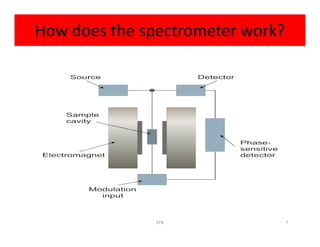
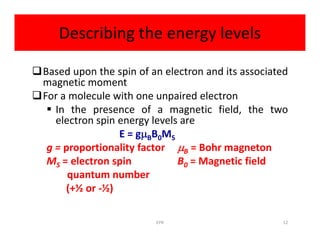
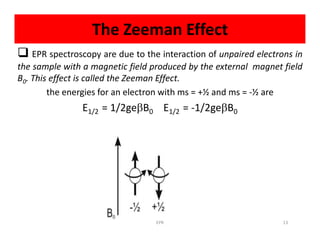
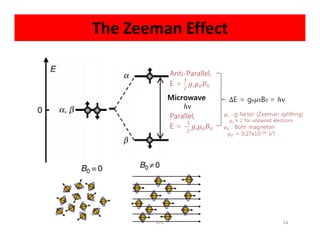
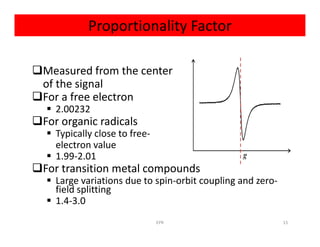
Electron paramagnetic resonance (EPR) spectroscopy measures transitions between electron spin energy levels when molecules with unpaired electrons are exposed to microwave radiation in an applied magnetic field. The document discusses the principles of EPR, including the Zeeman effect where electron spin states split into distinct energy levels. Hyperfine interactions between unpaired electrons and neighboring atomic nuclei provide information on the local electronic structure. More complex splitting patterns can arise from interactions with multiple equivalent nuclei, known as superhyperfine splitting. EPR spectroscopy thus provides insights into electron distributions and neighboring atomic environments.


