Download as PDF, PPTX


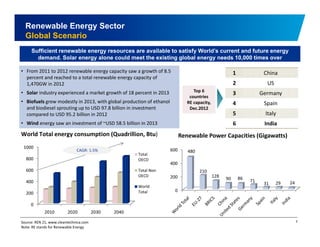
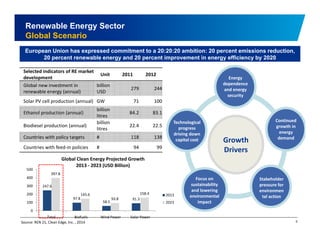
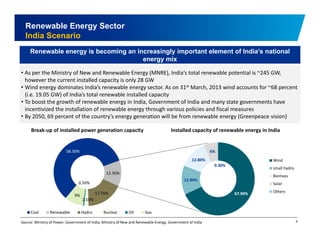
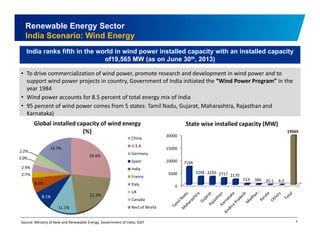
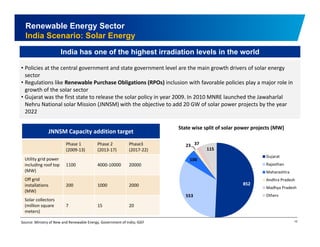

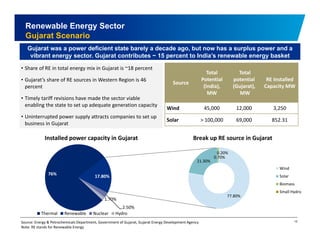

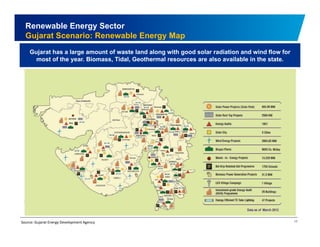
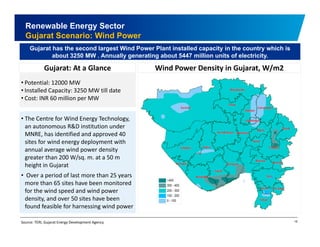
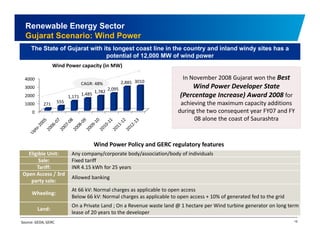
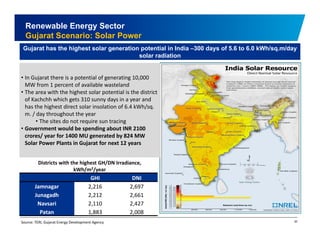


The document discusses the vibrant renewable energy landscape in Gujarat, India, highlighting its transition from power deficiency to surplus through significant investments in wind, solar, and biomass energy. Gujarat currently contributes approximately 15% to India's renewable energy capacity and has ambitious goals to increase its renewable energy share. The state has established a favorable regulatory environment and strategic partnerships to harness its vast potential in renewable resources.


