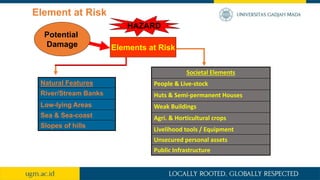
HAZARDS ANALYSIS
Natural Hazards Study
Dr. Danang Sri Hadmoko
ProSPER.Net Young Researchers’ School
“Ecosystem-based Disaster Risk Reduction and Climate Change
Adaptation” 3-10 March 2019
• Understanding the importance of natural hazard study
• The concepts of hazard, hazard event, secondary hazards, multiple
hazards and disaster
• Classify and describe types of hazards, explain hazard characteristics such as
magnitude, frequency, intensity and rate of onset and their importance
• Conduct hazard identification, hazard assessment and hazard mapping
and explain their functional value
The Objective of this Session
Understanding the importance of natural
hazard study
INDONESIA: THE WORLD’S BIGGEST ARCHIPELAGIC COUNTRY
250
million
17,508
islands
82.505
Villages
99,093 km
coastlines
34
Provinces
1158
Local
languages
95° E 105° E 115° E 125° E 135° E
0° N
5° N
0° N
5° N
Océan Indien
Océan Pacifique
Mer de Chine Méridionale
Plaque INDO-AUSTRALIENNE
Plaque CAROLINE
Plaque EURASIATIQUE
6.5 cm/an
Java
INDONESIA: JUNCTION OF 3 ACTIVE PLATE TECTONICS
Top 10 countries/territories in terms of absolute
losses (billion US$) 1998-2017
Number of disasters by major category per
year 1998-2017
UNISDR, 2018
In terms of occurrences, climate-related disasters dominate the picture over the past 20 years,
accounting for 91% of all 7,255 recorded events between 1998 and 2017
Numbers of disasters per type 1998-2017
UNISDR, 2018
The concepts/ terminology of hazard,
hazard event, secondary hazards,
multiple hazards and disaster
Hazards
• Hazards can include latent conditions that may represent future threats. They
can be natural in origin (geological, hydro-meteorological and biological) and/or
induced by human processes (environmental degradation and technological
hazards).
• Hazards can be single, sequential or combined in their origin and effects.
• Each hazard is characterized by its location, intensity, magnitude, area of extent
and probability.
Hazard is an event or occurrence that has
the potential for causing injuries to life and
damaging property and the environment.
A natural hazard refers to the probability
of occurrence in a specific time period
and geographic area of a potentially
damaging phenomenon.
There is a potential for the
occurrence of a disaster
event
Visualizing a Hazard
Elements at Risk
• People - death, injury, disease and stress
• Human activity – economic, educational etc.
• Property - property damage, economic loss of
• Environment - loss fauna and flora, pollution, loss of amenities.
A Hazard is a threat. A future source of danger. It has the potential
to cause harm to (element at risk):
Persons, buildings, crops or other such like societal components exposed to known
hazard, which are likely to be adversely affected by the impact of the hazard.
HAZARD
Potential
Damage Elements at Risk
Slopes of hills
Sea & Sea-coast
Low-lying Areas
River/Stream Banks
Natural Features
Unsecured personal assets
Livelihood tools / Equipment
Public Infrastructure
Agri. & Horticultural crops
Weak Buildings
Huts & Semi-permanent Houses
People & Live-stock
Societal Elements
Element at Risk
Visualizing Disaster
An event, either man‐made or natural, sudden or progressive, causing
widespread human, material or environmental losses
Natural Disaster vs Natural Phenomenon
• A natural disaster is the consequence of the combination of a
natural hazard (a physical event e.g. volcanic eruption,
earthquake, landslide) and human activities.
• A natural phenomena is the occurring of such kind of natural
processes within given magnitude which is not harmful to human
activities
A cyclone that surges over the ocean or an uninhabited
island does not result in a disaster.
However, it would be a disaster
if it hit the populated coast and
caused extensive loss of lives
and property.
Natural Disaster vs Natural Phenomenon
NASA
Natural Phenomenon VS Natural Disaster
Natural phenomenon Disaster
Dome’s photo: January 26, 2014
Imagery source: GeoEye-1
Ingredients of Risks
= H x V
C
Classify and describe types of hazards,
explain hazard characteristics such as
magnitude, frequency, intensity and rate
of onset and their importance
Type of Hazards
1. Natural hazards such as earthquakes
or floods arise from purely natural
processes in the environment.
2. Quasi-natural hazards such as smog or
desertification arise through the
interaction of natural processes and
human activities.
3. Technological (or man-made) hazards
such as the toxicity of pesticides to
fauna, accidental release of chemicals
or radiation from a nuclear plant.
These arise directly as a result of
human activities.
Type of Hazards
1. Endogenous vs Exogenous Hazards
2. Primary vs Secondary Hazards
3. Single vs Multiple Hazards vs Collateral Hazards
4. Natural Hazards vs Natural Hazard induced by humans vs
Technological Hazards
Type of Hazards
Endogenous
Hazards
Earthquake
Volcanic Eruption
Flood
Tsunami
Landslides
Forest Fire
Climate
Change
Drought
Exogenous
Hazards
Seismically
controlled
Climatically Controlled
Volcanic Eruption and associated hazards
VOLCANIC
GASSES
PYROCLASTIC
FLOWS
VOLCANIC
ASHESTSUNAMI
LAHARSCLIMATE
DISTURBANCE
8 Octobre 2007
23 Octobre 2007
26 Octobre 2007 29 Octobre 2007
Example of
Hazards:
Evolution of water
color at Kelud Lake
in 2007
(photos DVGHM)
Lava Dome, Anak Kelut,
December 2007
Effusive Eruption: Example of Disaster
Photo DVGHM
SECONDARY HAZARD: LAHAR
Anis Efizudin, VivaNews.com, 9 Desember 2010
Lahar is Javanese term to explain a rapidly flowing,
high-concentration, poorly sorted sediment-laden
mixtures of rock debris and water from a volcano.
- Lahars as main secondary hazard of Volcanic Eruption
Movie by Lavigne
Boyong, Merapi, December 1994
Boyong, Merapi, Februari 1995
LAHARS
Lahar in Code River (29 November 2010)
(Nearby Sardjito Hospital)
Flood Plain Flood Plain
the impact of 2010 MERAPI ERUPTION
in Code River “Yogyakarta City”
Lahar Flood in December 2010
PLINIAN ERUPTION OF KRAKATOA (1883)
Erupted on August 26–27, 1883
Segara Anak Lake
Barujari cone
Mount Rinjani
(3726 m)
Sector
collapse
CRISP, 2012
Sector
collapse
• VEI = 7 (> 100 km3)
• Eruption intensity = 12
• High dispersal index D
>49,000 km2
• Ultraplinian eruption
• Samalas volcano in Lombok
is a solid source candidate
for one the biggest volcanic
eruption of the Holocene,
AD 1257;
• Greater magnitude than
the nearby Tambora;
• Drastic local effects in
Indonesia:
• Total destruction of the
Pamatan Kingdom
• in Lombok (this ancient city
probably lies buried
beneath tephra deposits);
• No sovereign in Bali for 64
years since AD 1260 for an
unknown reason.
ULTRAPLINIAN ERUPTION OF SAMALAS (1257 AD)
• Large volume of aerosols into the atmosphere for at
least two years (two dark lunar eclipses observed in
Europe in May and November 1258)
• Climate disturbance in the continental northern
hemisphere in 1258: winter warming, widespread
summer cooling (a “year without a summer »
revealed by written sources and tree-ring data) =>
bad harvests that may have led to local disasters.
 Global impacts of the AD 1257 ultraplinian Samalas eruption
Archaeologists
recently determined
a date of AD 1258
for mass burial of
thousands of
medieval skeletons
in London, which
can thus be linked to
the global impacts
of the AD 1257
Samalas eruption.
Perturbation of Aerial Transportation
Ex.: Galunggung, 1982
“Ladies and gentlemen, this is your captain speaking. We
have a small problem. All four engines have stopped. We are
doing our damnedest to get them under control. I trust you
are not in too much distress”
Boeing 747 du vol 9 British Airways, 263 passagers
After the four reactors were shut down, the aircraft continued its flight for 16
minutes, losing 7500 meters from its initial altitude of 11,500 meters.
Example: Earthquake as a primary hazard
• Building collapse
• Dam failure
• Fire
• Hazardous material spill
• Interruption of power/ water supply/ communication/
transportation/ waste disposal
• Landslide
• Soil liquefaction
• Tsunami (tidal wave)
• Water pollution
SecondaryHazards
Hazard identification, hazard assessment and
hazard mapping
Natural Hazards Analysis
The identification, study and
monitoring of any hazard to
determine its potential, origin,
characteristics and behavior.
Identification Mapping
Assessment Monitoring Forecasting
Questions related to Hazards identification and
mapping
1. What kind of hazards that potentially threatening the area you live in ?
2. Could this hazard affect the area you live in?
3. Is this hazard a significant threat there?
4. How often does it pose a threat? E.g. Once every 5 years? 10 years?
5. What is a close estimate of the population size that could be affected by this hazard event? Give a
rating. Very high? High? Medium? Low?
6. What is the expected duration of the hazard?
7. What is the expected damage from the hazard event? Give a rating. Very high? High? Medium? Low?
8. What is the expected intensity of impact expected? Give a rating. Very high? High? Medium? Low?
9. How predictable is the threat?
10.Can the effect of the event be reduced?
Hazards Assessment / Zoning
Hazard zoning – The subdivision of the area in zones that are
characterized by the probability of occurrence of natural hazards of a
particular size/magnitude, area, volume, within a given period of
time.
Hazard Assessment is the process of estimating, for defined areas, the
probabilities of the occurrence of potentially-damaging phenomenon of
given magnitude within a specified period of time. UNDRO
Hazards Assessment
Spatial Probability/
Susceptibiity
Temporal Probability
Hazards assessment approach
1. Qualitative hazards assessment
2. Semi-quantitative hazards assessment
3. Quantitative hazards assessment
1. Probabilistic approach
2. Deterministic approach / physical-based approach
Determining hazards: an example
(HAZARDS)
Spatial
Probability
Temporal
Probability
Landuse
Soil
Geology
Slope
Landslide
event
Landslide
event
Triggering
factor
Eartrthquake
Rainfall
(VULNERABILITY)
Agriculture
Road
Houses
Infrastructure
Population
Element
at risk
Qualitative
Semi-
Quantitative
Probabilistic
Deterministic
METHODS
Magnitudo
Frequency
HAZARDS
Spatio-temporal
Probability
Potetntial damage
and loss of elemet
at risk
Economic value of
element at risk
(loss)
0 1 0 1 Rupiah
Total potential loss
Presenting Hazards Information: Example of Pegunungan Menoreh
U
Landslide probability map
ProSpatial probability of landslide = (V1*0,1297) + (V2*0,2396) + (V3*0,0916) + (V4*0,0855) +
(V5*0,136) + (V6*0,0714) + (V7*0,0374) + (V8*0,1339) + (V9*0,0748)
Histogram probabilitas kejadian
Spatial
Probability
(Sumber: Hadmoko, 2009)
Example of Spatial Probability Map -> Landslide
?
0 %10 %20 %25 %30 %40 %50 %60 %70 %75 %80 %90 %100 %
Very High
High
medium
low
Landslide probability:
Degree of Saturation:
Deterministic Approach (Hydrodynamic approach)
Example of microzonation of
tsunami hazards: Aceh
Run-up data:
tsunami Aceh
51 m
Lavigne,2005
Wave height measurement
using laser system
Hazards monitoring and forecasting
• Hazards are dynamic processes, they can be different from one year
to another, therefore hazards map should be updated in order to
adjust to the environmental dynamic/ change.
• Series of phenomena have to be monitored in order to determine the
pattern, therefore the future threat can be forecasted.
Terima Kasih

Lecture 5: Hazard Analysis

  • 1.
    HAZARDS ANALYSIS Natural HazardsStudy Dr. Danang Sri Hadmoko ProSPER.Net Young Researchers’ School “Ecosystem-based Disaster Risk Reduction and Climate Change Adaptation” 3-10 March 2019
  • 2.
    • Understanding theimportance of natural hazard study • The concepts of hazard, hazard event, secondary hazards, multiple hazards and disaster • Classify and describe types of hazards, explain hazard characteristics such as magnitude, frequency, intensity and rate of onset and their importance • Conduct hazard identification, hazard assessment and hazard mapping and explain their functional value The Objective of this Session
  • 3.
    Understanding the importanceof natural hazard study
  • 4.
    INDONESIA: THE WORLD’SBIGGEST ARCHIPELAGIC COUNTRY 250 million 17,508 islands 82.505 Villages 99,093 km coastlines 34 Provinces 1158 Local languages
  • 5.
    95° E 105°E 115° E 125° E 135° E 0° N 5° N 0° N 5° N Océan Indien Océan Pacifique Mer de Chine Méridionale Plaque INDO-AUSTRALIENNE Plaque CAROLINE Plaque EURASIATIQUE 6.5 cm/an Java INDONESIA: JUNCTION OF 3 ACTIVE PLATE TECTONICS
  • 7.
    Top 10 countries/territoriesin terms of absolute losses (billion US$) 1998-2017
  • 8.
    Number of disastersby major category per year 1998-2017 UNISDR, 2018 In terms of occurrences, climate-related disasters dominate the picture over the past 20 years, accounting for 91% of all 7,255 recorded events between 1998 and 2017
  • 9.
    Numbers of disastersper type 1998-2017 UNISDR, 2018
  • 11.
    The concepts/ terminologyof hazard, hazard event, secondary hazards, multiple hazards and disaster
  • 12.
    Hazards • Hazards caninclude latent conditions that may represent future threats. They can be natural in origin (geological, hydro-meteorological and biological) and/or induced by human processes (environmental degradation and technological hazards). • Hazards can be single, sequential or combined in their origin and effects. • Each hazard is characterized by its location, intensity, magnitude, area of extent and probability.
  • 13.
    Hazard is anevent or occurrence that has the potential for causing injuries to life and damaging property and the environment. A natural hazard refers to the probability of occurrence in a specific time period and geographic area of a potentially damaging phenomenon. There is a potential for the occurrence of a disaster event Visualizing a Hazard
  • 14.
    Elements at Risk •People - death, injury, disease and stress • Human activity – economic, educational etc. • Property - property damage, economic loss of • Environment - loss fauna and flora, pollution, loss of amenities. A Hazard is a threat. A future source of danger. It has the potential to cause harm to (element at risk): Persons, buildings, crops or other such like societal components exposed to known hazard, which are likely to be adversely affected by the impact of the hazard.
  • 15.
    HAZARD Potential Damage Elements atRisk Slopes of hills Sea & Sea-coast Low-lying Areas River/Stream Banks Natural Features Unsecured personal assets Livelihood tools / Equipment Public Infrastructure Agri. & Horticultural crops Weak Buildings Huts & Semi-permanent Houses People & Live-stock Societal Elements Element at Risk
  • 16.
    Visualizing Disaster An event,either man‐made or natural, sudden or progressive, causing widespread human, material or environmental losses
  • 17.
    Natural Disaster vsNatural Phenomenon • A natural disaster is the consequence of the combination of a natural hazard (a physical event e.g. volcanic eruption, earthquake, landslide) and human activities. • A natural phenomena is the occurring of such kind of natural processes within given magnitude which is not harmful to human activities
  • 18.
    A cyclone thatsurges over the ocean or an uninhabited island does not result in a disaster. However, it would be a disaster if it hit the populated coast and caused extensive loss of lives and property. Natural Disaster vs Natural Phenomenon NASA
  • 19.
    Natural Phenomenon VSNatural Disaster Natural phenomenon Disaster
  • 20.
    Dome’s photo: January26, 2014 Imagery source: GeoEye-1
  • 21.
  • 22.
    Classify and describetypes of hazards, explain hazard characteristics such as magnitude, frequency, intensity and rate of onset and their importance
  • 23.
    Type of Hazards 1.Natural hazards such as earthquakes or floods arise from purely natural processes in the environment. 2. Quasi-natural hazards such as smog or desertification arise through the interaction of natural processes and human activities. 3. Technological (or man-made) hazards such as the toxicity of pesticides to fauna, accidental release of chemicals or radiation from a nuclear plant. These arise directly as a result of human activities.
  • 24.
    Type of Hazards 1.Endogenous vs Exogenous Hazards 2. Primary vs Secondary Hazards 3. Single vs Multiple Hazards vs Collateral Hazards 4. Natural Hazards vs Natural Hazard induced by humans vs Technological Hazards
  • 25.
    Type of Hazards Endogenous Hazards Earthquake VolcanicEruption Flood Tsunami Landslides Forest Fire Climate Change Drought Exogenous Hazards Seismically controlled Climatically Controlled
  • 26.
    Volcanic Eruption andassociated hazards VOLCANIC GASSES PYROCLASTIC FLOWS VOLCANIC ASHESTSUNAMI LAHARSCLIMATE DISTURBANCE
  • 27.
    8 Octobre 2007 23Octobre 2007 26 Octobre 2007 29 Octobre 2007 Example of Hazards: Evolution of water color at Kelud Lake in 2007 (photos DVGHM)
  • 28.
    Lava Dome, AnakKelut, December 2007 Effusive Eruption: Example of Disaster Photo DVGHM
  • 29.
    SECONDARY HAZARD: LAHAR AnisEfizudin, VivaNews.com, 9 Desember 2010 Lahar is Javanese term to explain a rapidly flowing, high-concentration, poorly sorted sediment-laden mixtures of rock debris and water from a volcano.
  • 30.
    - Lahars asmain secondary hazard of Volcanic Eruption Movie by Lavigne
  • 31.
    Boyong, Merapi, December1994 Boyong, Merapi, Februari 1995 LAHARS
  • 32.
    Lahar in CodeRiver (29 November 2010) (Nearby Sardjito Hospital) Flood Plain Flood Plain
  • 33.
    the impact of2010 MERAPI ERUPTION in Code River “Yogyakarta City” Lahar Flood in December 2010
  • 34.
    PLINIAN ERUPTION OFKRAKATOA (1883) Erupted on August 26–27, 1883
  • 35.
    Segara Anak Lake Barujaricone Mount Rinjani (3726 m) Sector collapse CRISP, 2012 Sector collapse
  • 36.
    • VEI =7 (> 100 km3) • Eruption intensity = 12 • High dispersal index D >49,000 km2 • Ultraplinian eruption • Samalas volcano in Lombok is a solid source candidate for one the biggest volcanic eruption of the Holocene, AD 1257; • Greater magnitude than the nearby Tambora; • Drastic local effects in Indonesia: • Total destruction of the Pamatan Kingdom • in Lombok (this ancient city probably lies buried beneath tephra deposits); • No sovereign in Bali for 64 years since AD 1260 for an unknown reason. ULTRAPLINIAN ERUPTION OF SAMALAS (1257 AD)
  • 37.
    • Large volumeof aerosols into the atmosphere for at least two years (two dark lunar eclipses observed in Europe in May and November 1258) • Climate disturbance in the continental northern hemisphere in 1258: winter warming, widespread summer cooling (a “year without a summer » revealed by written sources and tree-ring data) => bad harvests that may have led to local disasters.  Global impacts of the AD 1257 ultraplinian Samalas eruption Archaeologists recently determined a date of AD 1258 for mass burial of thousands of medieval skeletons in London, which can thus be linked to the global impacts of the AD 1257 Samalas eruption.
  • 39.
    Perturbation of AerialTransportation Ex.: Galunggung, 1982 “Ladies and gentlemen, this is your captain speaking. We have a small problem. All four engines have stopped. We are doing our damnedest to get them under control. I trust you are not in too much distress” Boeing 747 du vol 9 British Airways, 263 passagers After the four reactors were shut down, the aircraft continued its flight for 16 minutes, losing 7500 meters from its initial altitude of 11,500 meters.
  • 40.
    Example: Earthquake asa primary hazard • Building collapse • Dam failure • Fire • Hazardous material spill • Interruption of power/ water supply/ communication/ transportation/ waste disposal • Landslide • Soil liquefaction • Tsunami (tidal wave) • Water pollution SecondaryHazards
  • 41.
    Hazard identification, hazardassessment and hazard mapping
  • 42.
    Natural Hazards Analysis Theidentification, study and monitoring of any hazard to determine its potential, origin, characteristics and behavior. Identification Mapping Assessment Monitoring Forecasting
  • 43.
    Questions related toHazards identification and mapping 1. What kind of hazards that potentially threatening the area you live in ? 2. Could this hazard affect the area you live in? 3. Is this hazard a significant threat there? 4. How often does it pose a threat? E.g. Once every 5 years? 10 years? 5. What is a close estimate of the population size that could be affected by this hazard event? Give a rating. Very high? High? Medium? Low? 6. What is the expected duration of the hazard? 7. What is the expected damage from the hazard event? Give a rating. Very high? High? Medium? Low? 8. What is the expected intensity of impact expected? Give a rating. Very high? High? Medium? Low? 9. How predictable is the threat? 10.Can the effect of the event be reduced?
  • 44.
    Hazards Assessment /Zoning Hazard zoning – The subdivision of the area in zones that are characterized by the probability of occurrence of natural hazards of a particular size/magnitude, area, volume, within a given period of time. Hazard Assessment is the process of estimating, for defined areas, the probabilities of the occurrence of potentially-damaging phenomenon of given magnitude within a specified period of time. UNDRO
  • 45.
  • 46.
    Hazards assessment approach 1.Qualitative hazards assessment 2. Semi-quantitative hazards assessment 3. Quantitative hazards assessment 1. Probabilistic approach 2. Deterministic approach / physical-based approach
  • 47.
    Determining hazards: anexample (HAZARDS) Spatial Probability Temporal Probability Landuse Soil Geology Slope Landslide event Landslide event Triggering factor Eartrthquake Rainfall (VULNERABILITY) Agriculture Road Houses Infrastructure Population Element at risk Qualitative Semi- Quantitative Probabilistic Deterministic METHODS Magnitudo Frequency HAZARDS Spatio-temporal Probability Potetntial damage and loss of elemet at risk Economic value of element at risk (loss) 0 1 0 1 Rupiah Total potential loss
  • 48.
    Presenting Hazards Information:Example of Pegunungan Menoreh U
  • 49.
    Landslide probability map ProSpatialprobability of landslide = (V1*0,1297) + (V2*0,2396) + (V3*0,0916) + (V4*0,0855) + (V5*0,136) + (V6*0,0714) + (V7*0,0374) + (V8*0,1339) + (V9*0,0748) Histogram probabilitas kejadian Spatial Probability (Sumber: Hadmoko, 2009)
  • 50.
    Example of SpatialProbability Map -> Landslide ?
  • 51.
    0 %10 %20%25 %30 %40 %50 %60 %70 %75 %80 %90 %100 % Very High High medium low Landslide probability: Degree of Saturation: Deterministic Approach (Hydrodynamic approach)
  • 52.
    Example of microzonationof tsunami hazards: Aceh
  • 53.
  • 54.
  • 55.
    Hazards monitoring andforecasting • Hazards are dynamic processes, they can be different from one year to another, therefore hazards map should be updated in order to adjust to the environmental dynamic/ change. • Series of phenomena have to be monitored in order to determine the pattern, therefore the future threat can be forecasted.
  • 56.

Editor's Notes

  • #8 Between 1998 and 2017 climate-related and geophysical disasters killed 1.3 million people and left a further 4.4 billion injured
  • #18 Environmental events become hazards once they threaten to affect society and/or the environment adversely. A physical event, such as a volcanic eruption, that does not affect human beings is a natural phenomenon but not a natural hazard. A natural phenomenon that occurs in a populated area is a hazardous event. A hazardous event that causes unacceptably large numbers of fatalities and/or overwhelming property damage is a natural disaster. In areas where there are no human interests, natural phenomena do not constitute hazards nor do they result in disasters.
  • #47 This method uses ranking such as ‘high’, ‘moderate’ and ‘low ‘to assess a hazard event. Where there is a lack of sufficient data for quantitative evaluation, or where certain variables cannot be expressed numerically, this qualitative ranking may be appropriate to take hazard mitigation decisions. We can use: geomorphic signature, for example: deposits, watermark caused by floods.