Downloaded 173 times


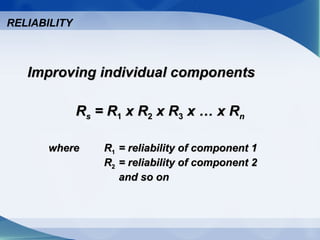
![A redundant process is installed to support theA redundant process is installed to support the
earlier example where Rearlier example where Rss = .713= .713
RR11
0.90
0.90
RR22
0.80
0.80
RR33
0.99
= [.9 + .9(1 - .9)] x [.8 + .8(1 - .8)] x .99= [.9 + .9(1 - .9)] x [.8 + .8(1 - .8)] x .99
= [.9 + (.9)(.1)] x [.8 + (.8)(.2)] x .99= [.9 + (.9)(.1)] x [.8 + (.8)(.2)] x .99
= .99 x .96 x .99 = .94= .99 x .96 x .99 = .94
Reliability hasReliability has
increasedincreased
fromfrom .713.713 toto .94.94
PROVIDING REDUNDANCY EXAMPLE](https://image.slidesharecdn.com/report002opeman-130709001348-phpapp02/85/Maintenance-and-Reliability-12-320.jpg)


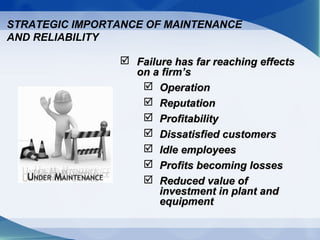
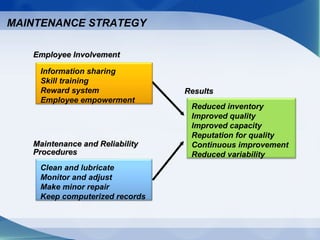
This document discusses maintenance and reliability of power generating plants. It notes that every year each plant undergoes 1-3 weeks of maintenance and every three years they undergo 6-8 weeks of complete overhaul. Preventive maintenance is important as it discovered a cracked rotor blade that could have destroyed expensive equipment. The document discusses ways to improve reliability such as improving individual components and providing redundancy. It also discusses the importance of maintenance for operational and financial reasons and strategies for effective maintenance like employee involvement, proper procedures, and computerized record keeping.


![002 Maintenance M Overview 20 06 06[1]](https://cdn.slidesharecdn.com/ss_thumbnails/002-maintenance-m-overview-20-06-061-1221944333735887-9-thumbnail.jpg?width=640&height=640&fit=bounds)


