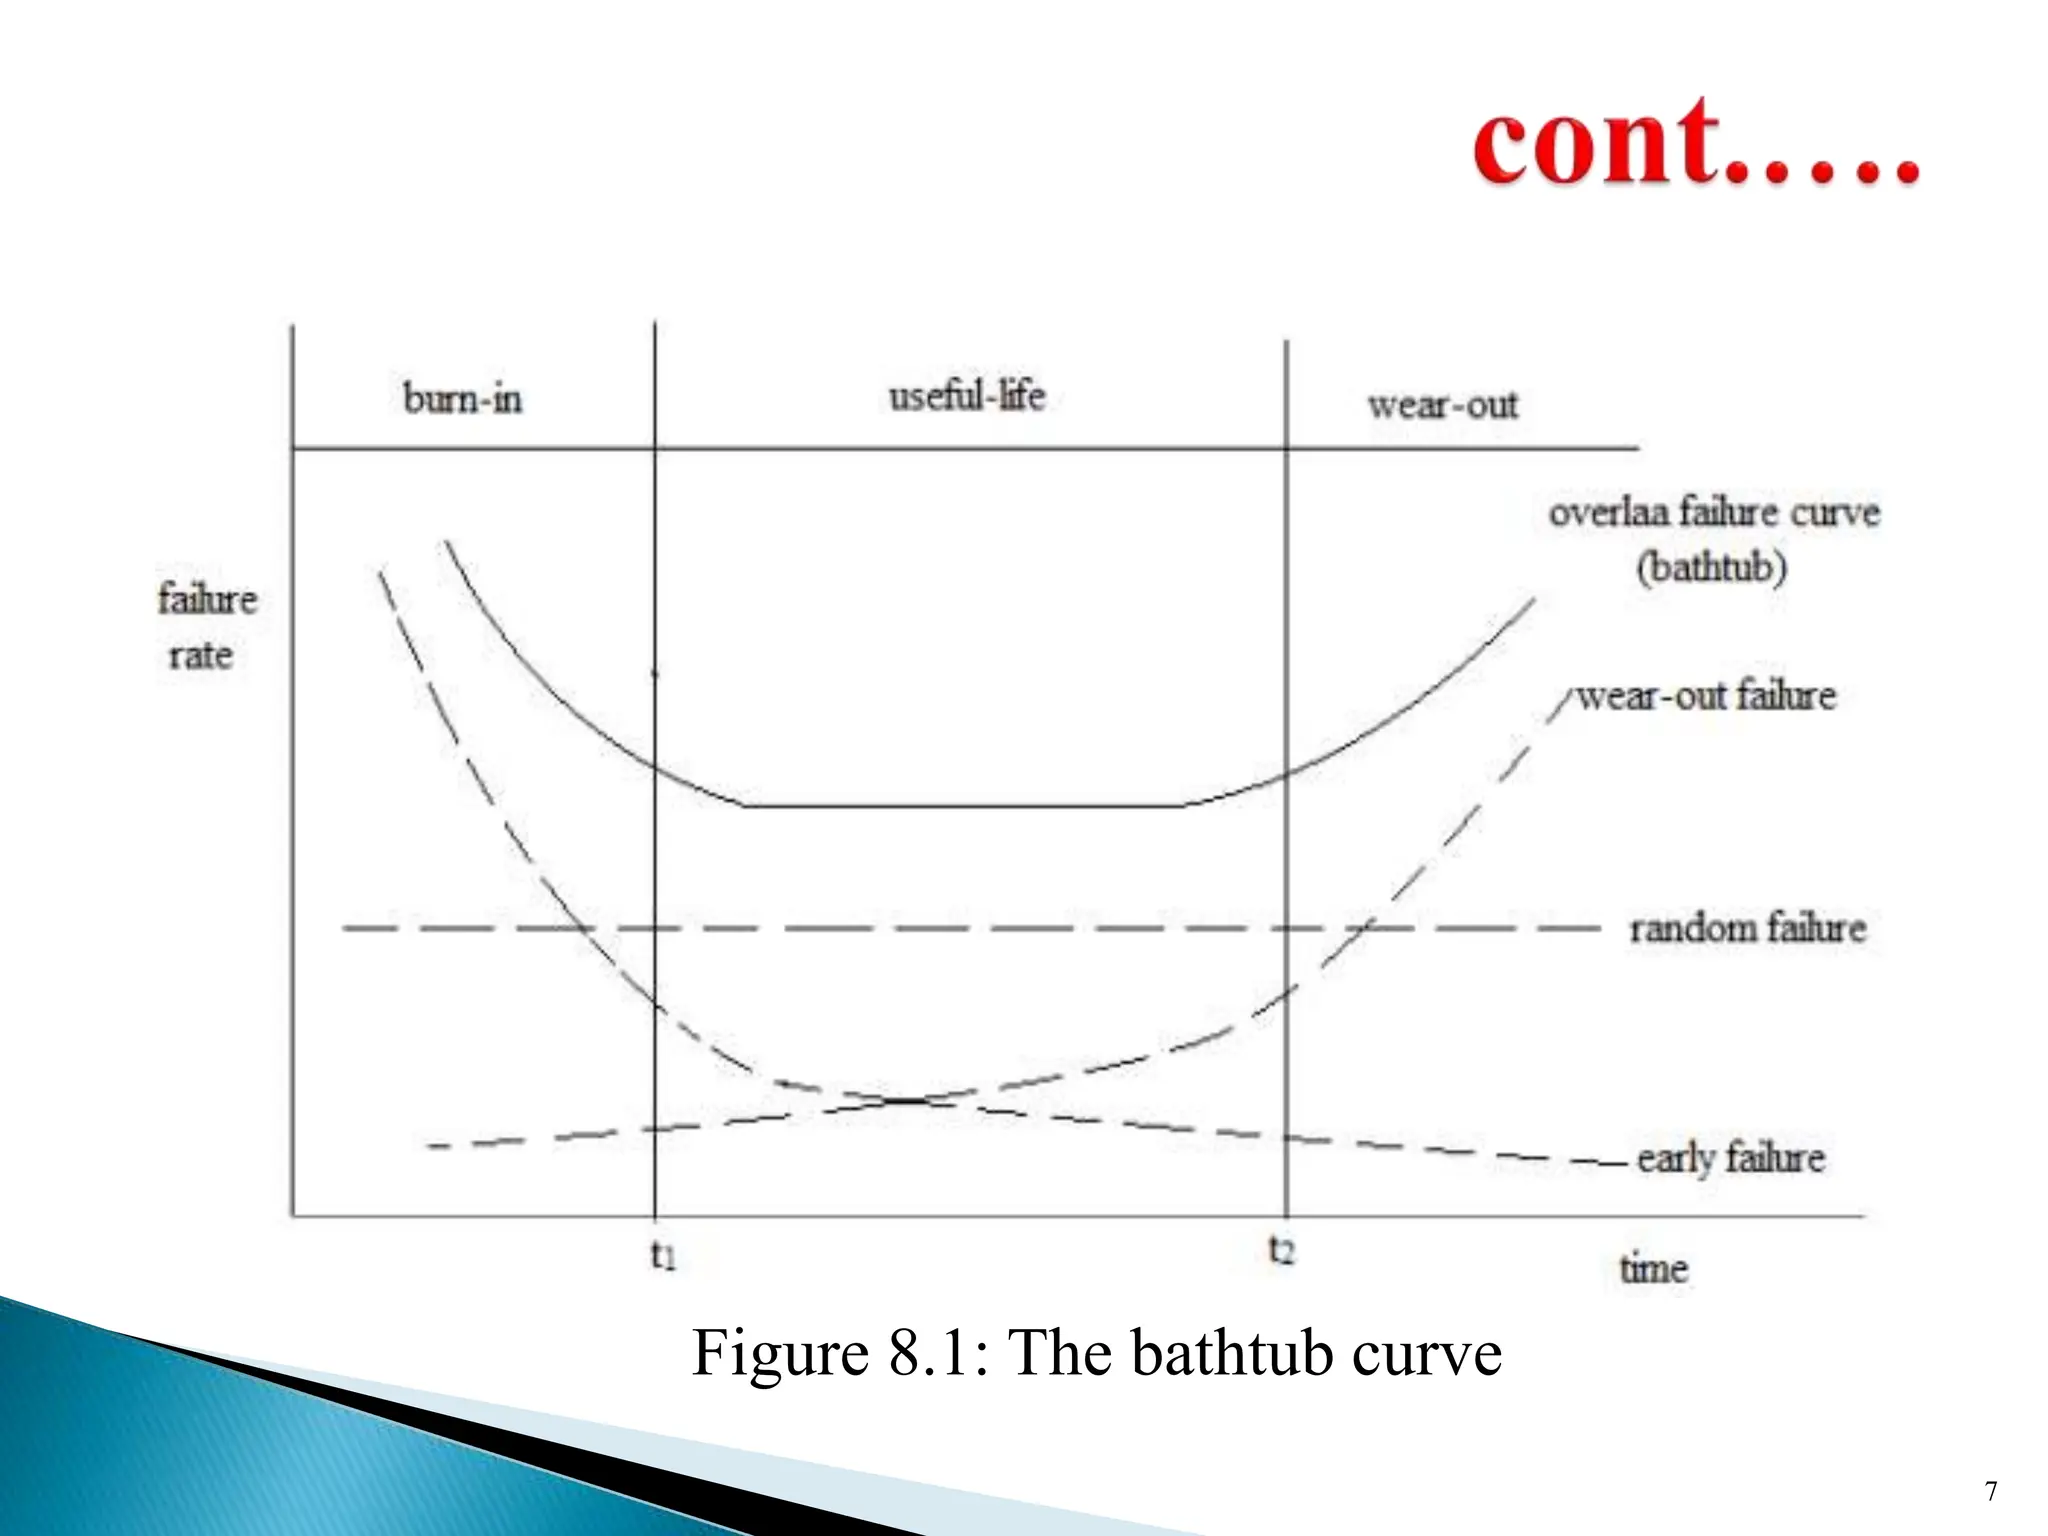
The document discusses the importance of reliability and availability in equipment management, defining reliability as the probability of an item performing a required function over time under specified conditions. It introduces the bathtub curve to illustrate equipment failure phases: infant mortality, useful life, and wear-out periods. Additionally, it explains various types of availability—instantaneous, inherent, achieved, and operational—each addressing different aspects of equipment performance and maintenance efficiency.


![ii. Average Uptime Availability
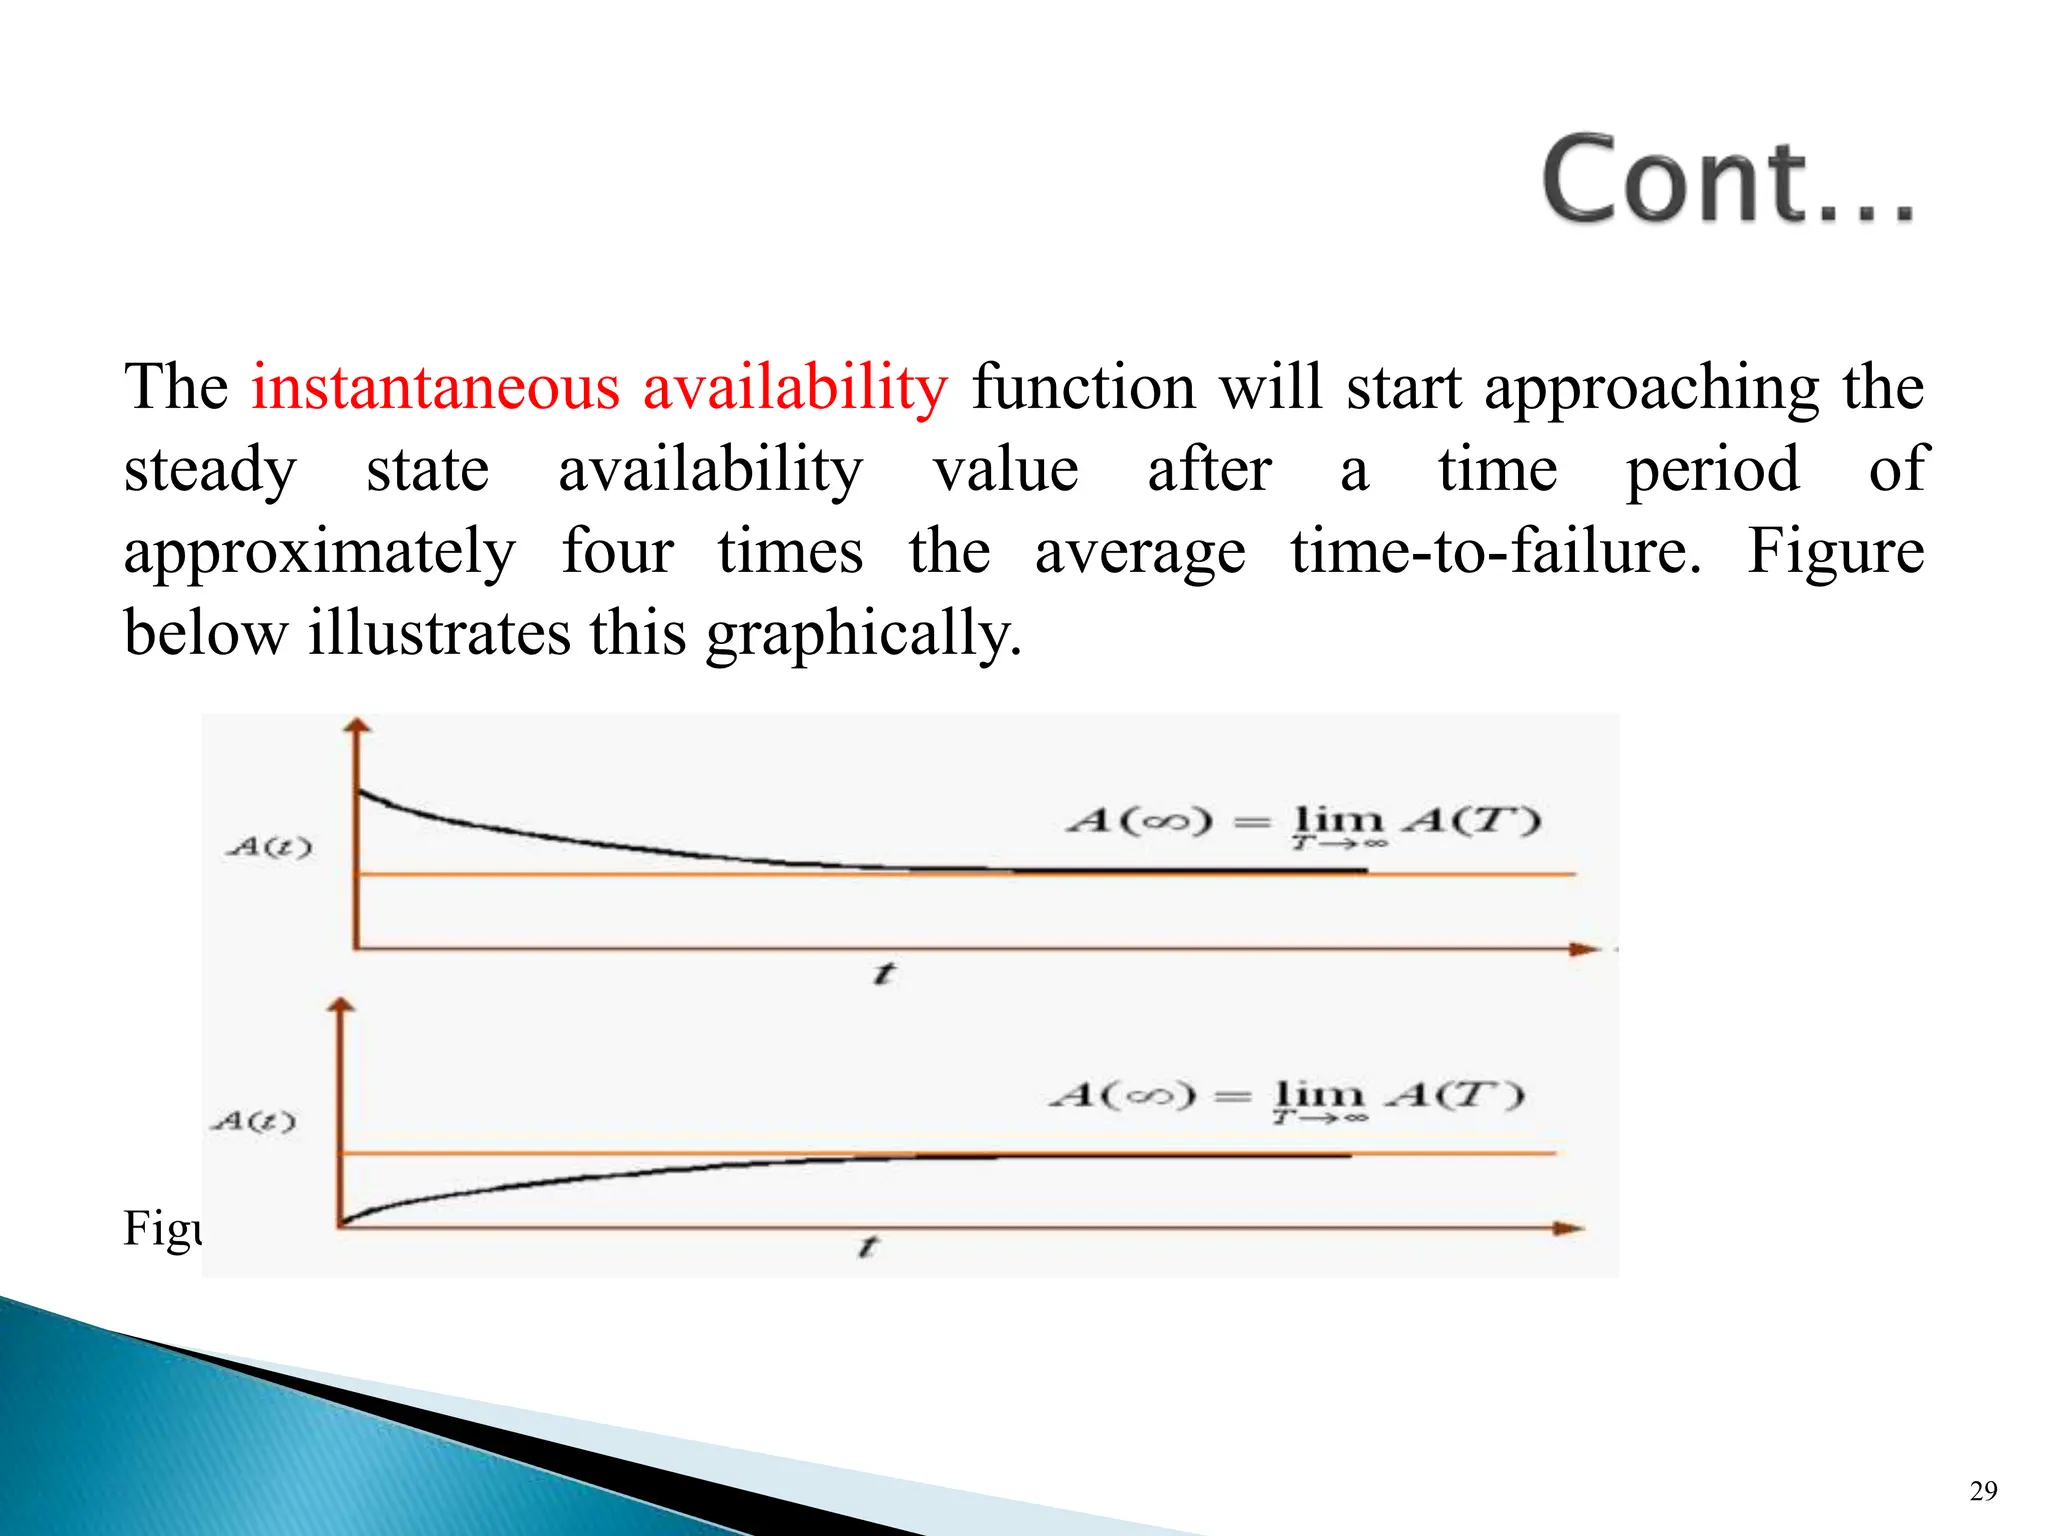
The mean availability is the proportion of time during a
mission or time period that the system is available for
use. It represents the mean value of the instantaneous
availability function over the period
(0, T] and is given by:
27](https://image.slidesharecdn.com/chapter8-240422171642-2a33e465/75/chapter-8-discussabout-reliability-pptx-27-2048.jpg)

![The mean of the maintenance times is:
θ = ∑ ti / k
where:
k = total number of maintenance
tasks performed
ti = ith maintenance time, for i= 1,
2, 3, ...... K
The standard deviation is :
σ = [ ∑ (ti – θ)²/ (k – 1)]½](https://image.slidesharecdn.com/chapter8-240422171642-2a33e465/75/chapter-8-discussabout-reliability-pptx-78-2048.jpg)