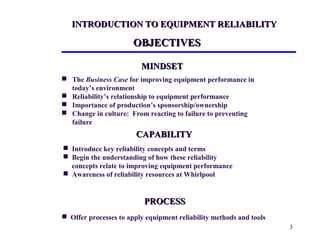
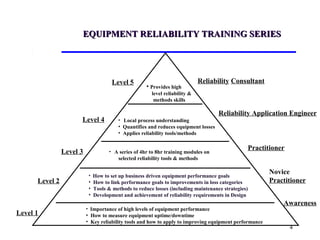
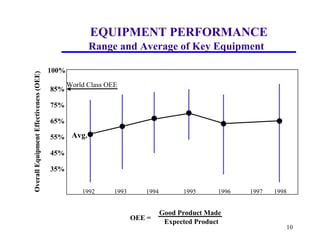
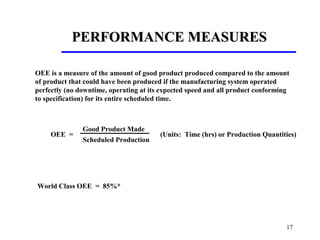
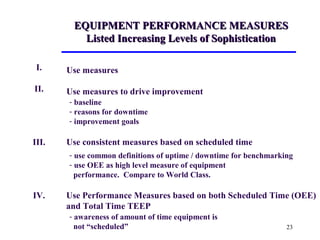
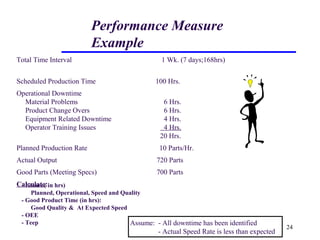
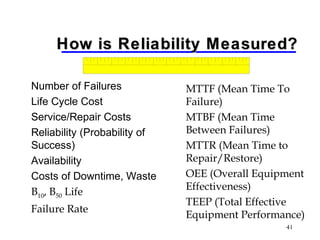
This document provides an overview of equipment reliability training at different levels. It discusses measuring and improving equipment performance through metrics like Overall Equipment Effectiveness (OEE) and Total Effective Equipment Performance (TEEP). The training introduces reliability concepts and processes to apply reliability tools and methods. It aims to change culture from reacting to failures to preventing failures through early reliability considerations in equipment design, purchasing, and maintenance.
Maintenance Planning and Scheduling are key elements that influence the true success of any organization. Many times we have a planner or planner/scheduler, but do not know how to use him or her effectively or efficiently.
When working for Petrobras at PRSI (Pasadena Refining System Inc.) I had this opportunity to share my experience as a Maintenance Manager in Brazil with PRSI operators and maintenance crew.
One of the major challenges for Gas Turbine users is to ensure high level of engine availability and reliability, and efficient operation during their complete life-cycle. For this purpose, Various maintenance approaches have been introduced over the years for the gas turbine maintenance: Breakdown Maintenance or Run to Failure, Preventive Maintenance or Scheduled Maintenance and Condition-Based Maintenance (CBM). Here the focus is on CBM or predictive maintenance.
Introduction to Reliability Centered MaintenanceDibyendu De
Introduces Reliability Centered Maintenance, strategies employed, formulation of effective maintenance plan, reduction of consequences of failures and failure rate.
Planned Maintenance is a proactive approach to maintenance that focuses on minimizing the downtime and costs associated with machine breakdowns. As one of the key pillars of the TPM Excellence framework, the goal of Planned Maintenance is to have trouble-free equipment that produce defect-free products.
Planned Maintenance achieves and sustains availability of machines at an optimum maintenance cost, reduces spares inventory, and improves reliability and maintainability of machines.
In this presentation developed by our JIPM-certified TPM Instructor, you will learn how to plan and organize the Plan Maintenance activities to strengthen the capabilities of your Maintenance department. It clarifies the roles of the Operations and Maintenance departments in supporting the TPM initiative and provides step-by-step guidance on the implementation of the Planned Maintenance pillar.
LEARNING OBJECTIVES
1. Understand what is Planned Maintenance and why it is important in TPM implementation
2. Acquire knowledge on how to plan and organize Planned Maintenance activities
3. Describe the seven implementation steps of Planned Maintenance
4. Gain knowledge on the JIPM TPM Excellence Criteria for Planned Maintenance
CONTENTS
1. Introduction to Planned Maintenance
2. What is Planned Maintenance?
3. Planning & Organizing for Planned Maintenance
4. The 7 Steps of Planned Maintenance
5. JIPM TPM Excellence Criteria for Planned Maintenance
To download this complete presentation, goto:
https://www.oeconsulting.com.sg/training-presentations
Reliability Centered Maintenance Implementation and Case StudyWaseem Akram
This is the presentation based on final year project which deals with the implementation of "Reliability Centered Maintenance and Contribution of Quality Management System". A case study analysis has also been attached in this presentation.
This is a presentation to the top management as to why reliability is important and what is the difference between a maintenance engineer and a reliability engineer.
This presentation outlines the processes and benefits of applying enhanced maintenance planning techniques such as Reliability Centred Maintenance at your place of work. Please go to www.simenergy.co.uk for more information.
The Critical KPI to drive Manufacturing ProductivityJason Corder
A net reduction in cost of operations directly and positively affects the bottom line. Companies can boost revenue without sacrificing profitability by factoring in long-term debt-to capital ratio. Since finance puts a premium on a company’s ability to maximize productivity and use existing assets, you have to continually measure, analyze, and adjust your processes. This is accomplished by a rigorous practice of productivity gains, cost cutting with increased efficiencies, and maximizing returns on fixed assets.
The International Journal of Engineering & Science is aimed at providing a platform for researchers, engineers, scientists, or educators to publish their original research results, to exchange new ideas, to disseminate information in innovative designs, engineering experiences and technological skills. It is also the Journal's objective to promote engineering and technology education. All papers submitted to the Journal will be blind peer-reviewed. Only original articles will be published.
Assignment-I (15%)
Write a brief technical note on the following points.
1. The concept of autonomous maintenance, its characteristics, benefits, and the steps required to implement autonomous maintenance.
2. Overall equipment maintenance (OEE) is the key performance indicator developed to measure equipment/machinery effectiveness. Considering this write a note on the following issues:
a. Definition and measurement of OEE describing each stages in the analysis
b. Taking a specific scientific paper (i.e. from journal articles, unpublished thesis or dissertation papers), demonstrate how OEE is applied to industrial applications comparing to standard settings.
N.B. For question #2, you must put the reference you are considering for your report.
[Note: This is a partial preview. To download this presentation, visit:
https://www.oeconsulting.com.sg/training-presentations]
The goal of Total Productive Maintenance (TPM) is to increase equipment effectiveness so that each piece of equipment can be operated to its full potential and maintained at that level. To maximize equipment effectiveness, you need a measurement tool that can help you understand your equipment problems so that you can take steps to eliminate them. The key to this understanding is Overall Equipment Effectiveness (OEE).
OEE is a crucial measure in TPM that tells you how well your equipment is running. It links three elements in one percentage: the time the machine is actually running, the quantity of products the machine is turning out, and the quantity of good output.
LEARNING OBJECTIVES
1. Understand the concept and philosophy of TPM and its relationship with OEE
2. Explain the importance of OEE and how it relates to value-adding work of the factory
3. Understand OEE concepts such as Availability, Performance, Quality and the Six Major Losses
4. Describe the steps of collecting and processing OEE data and reporting results
5. Define approaches for reducing equipment-related losses to raise OEE
To download this presentation, visit:
https://www.oeconsulting.com.sg/training-presentations
About
Indigenized remote control interface card suitable for MAFI system CCR equipment. Compatible for IDM8000 CCR. Backplane mounted serial and TCP/Ethernet communication module for CCR remote access. IDM 8000 CCR remote control on serial and TCP protocol.
• Remote control: Parallel or serial interface.
• Compatible with MAFI CCR system.
• Compatible with IDM8000 CCR.
• Compatible with Backplane mount serial communication.
• Compatible with commercial and Defence aviation CCR system.
• Remote control system for accessing CCR and allied system over serial or TCP.
• Indigenized local Support/presence in India.
• Easy in configuration using DIP switches.
Technical Specifications
Indigenized remote control interface card suitable for MAFI system CCR equipment. Compatible for IDM8000 CCR. Backplane mounted serial and TCP/Ethernet communication module for CCR remote access. IDM 8000 CCR remote control on serial and TCP protocol.
Key Features
Indigenized remote control interface card suitable for MAFI system CCR equipment. Compatible for IDM8000 CCR. Backplane mounted serial and TCP/Ethernet communication module for CCR remote access. IDM 8000 CCR remote control on serial and TCP protocol.
• Remote control: Parallel or serial interface
• Compatible with MAFI CCR system
• Copatiable with IDM8000 CCR
• Compatible with Backplane mount serial communication.
• Compatible with commercial and Defence aviation CCR system.
• Remote control system for accessing CCR and allied system over serial or TCP.
• Indigenized local Support/presence in India.
Application
• Remote control: Parallel or serial interface.
• Compatible with MAFI CCR system.
• Compatible with IDM8000 CCR.
• Compatible with Backplane mount serial communication.
• Compatible with commercial and Defence aviation CCR system.
• Remote control system for accessing CCR and allied system over serial or TCP.
• Indigenized local Support/presence in India.
• Easy in configuration using DIP switches.
Cosmetic shop management system project report.pdfKamal Acharya
Buying new cosmetic products is difficult. It can even be scary for those who have sensitive skin and are prone to skin trouble. The information needed to alleviate this problem is on the back of each product, but it's thought to interpret those ingredient lists unless you have a background in chemistry.
Instead of buying and hoping for the best, we can use data science to help us predict which products may be good fits for us. It includes various function programs to do the above mentioned tasks.
Data file handling has been effectively used in the program.
The automated cosmetic shop management system should deal with the automation of general workflow and administration process of the shop. The main processes of the system focus on customer's request where the system is able to search the most appropriate products and deliver it to the customers. It should help the employees to quickly identify the list of cosmetic product that have reached the minimum quantity and also keep a track of expired date for each cosmetic product. It should help the employees to find the rack number in which the product is placed.It is also Faster and more efficient way.
Saudi Arabia stands as a titan in the global energy landscape, renowned for its abundant oil and gas resources. It's the largest exporter of petroleum and holds some of the world's most significant reserves. Let's delve into the top 10 oil and gas projects shaping Saudi Arabia's energy future in 2024.
CFD Simulation of By-pass Flow in a HRSG module by R&R Consult.pptxR&R Consult
CFD analysis is incredibly effective at solving mysteries and improving the performance of complex systems!
Here's a great example: At a large natural gas-fired power plant, where they use waste heat to generate steam and energy, they were puzzled that their boiler wasn't producing as much steam as expected.
R&R and Tetra Engineering Group Inc. were asked to solve the issue with reduced steam production.
An inspection had shown that a significant amount of hot flue gas was bypassing the boiler tubes, where the heat was supposed to be transferred.
R&R Consult conducted a CFD analysis, which revealed that 6.3% of the flue gas was bypassing the boiler tubes without transferring heat. The analysis also showed that the flue gas was instead being directed along the sides of the boiler and between the modules that were supposed to capture the heat. This was the cause of the reduced performance.
Based on our results, Tetra Engineering installed covering plates to reduce the bypass flow. This improved the boiler's performance and increased electricity production.
It is always satisfying when we can help solve complex challenges like this. Do your systems also need a check-up or optimization? Give us a call!
Work done in cooperation with James Malloy and David Moelling from Tetra Engineering.
More examples of our work https://www.r-r-consult.dk/en/cases-en/
Hybrid optimization of pumped hydro system and solar- Engr. Abdul-Azeez.pdffxintegritypublishin
Advancements in technology unveil a myriad of electrical and electronic breakthroughs geared towards efficiently harnessing limited resources to meet human energy demands. The optimization of hybrid solar PV panels and pumped hydro energy supply systems plays a pivotal role in utilizing natural resources effectively. This initiative not only benefits humanity but also fosters environmental sustainability. The study investigated the design optimization of these hybrid systems, focusing on understanding solar radiation patterns, identifying geographical influences on solar radiation, formulating a mathematical model for system optimization, and determining the optimal configuration of PV panels and pumped hydro storage. Through a comparative analysis approach and eight weeks of data collection, the study addressed key research questions related to solar radiation patterns and optimal system design. The findings highlighted regions with heightened solar radiation levels, showcasing substantial potential for power generation and emphasizing the system's efficiency. Optimizing system design significantly boosted power generation, promoted renewable energy utilization, and enhanced energy storage capacity. The study underscored the benefits of optimizing hybrid solar PV panels and pumped hydro energy supply systems for sustainable energy usage. Optimizing the design of solar PV panels and pumped hydro energy supply systems as examined across diverse climatic conditions in a developing country, not only enhances power generation but also improves the integration of renewable energy sources and boosts energy storage capacities, particularly beneficial for less economically prosperous regions. Additionally, the study provides valuable insights for advancing energy research in economically viable areas. Recommendations included conducting site-specific assessments, utilizing advanced modeling tools, implementing regular maintenance protocols, and enhancing communication among system components.
Welcome to WIPAC Monthly the magazine brought to you by the LinkedIn Group Water Industry Process Automation & Control.
In this month's edition, along with this month's industry news to celebrate the 13 years since the group was created we have articles including
A case study of the used of Advanced Process Control at the Wastewater Treatment works at Lleida in Spain
A look back on an article on smart wastewater networks in order to see how the industry has measured up in the interim around the adoption of Digital Transformation in the Water Industry.
Immunizing Image Classifiers Against Localized Adversary Attacksgerogepatton
This paper addresses the vulnerability of deep learning models, particularly convolutional neural networks
(CNN)s, to adversarial attacks and presents a proactive training technique designed to counter them. We
introduce a novel volumization algorithm, which transforms 2D images into 3D volumetric representations.
When combined with 3D convolution and deep curriculum learning optimization (CLO), itsignificantly improves
the immunity of models against localized universal attacks by up to 40%. We evaluate our proposed approach
using contemporary CNN architectures and the modified Canadian Institute for Advanced Research (CIFAR-10
and CIFAR-100) and ImageNet Large Scale Visual Recognition Challenge (ILSVRC12) datasets, showcasing
accuracy improvements over previous techniques. The results indicate that the combination of the volumetric
input and curriculum learning holds significant promise for mitigating adversarial attacks without necessitating
adversary training.
3. 3
OBJECTIVESOBJECTIVES
MINDSETMINDSET
The Business Case for improving equipment performance in
today’s environment
Reliability’s relationship to equipment performance
Importance of production’s sponsorship/ownership
Change in culture: From reacting to failure to preventing
failure
CAPABILITYCAPABILITY
Introduce key reliability concepts and terms
Begin the understanding of how these reliability
concepts relate to improving equipment performance
Awareness of reliability resources at Whirlpool
PROCESSPROCESS
Offer processes to apply equipment reliability methods and tools
INTRODUCTION TO EQUIPMENT RELIABILITYINTRODUCTION TO EQUIPMENT RELIABILITY
4. 4
EQUIPMENT RELIABILITY TRAINING SERIESEQUIPMENT RELIABILITY TRAINING SERIES
Awareness
• Importance of high levels of equipment performance
• How to measure equipment uptime/downtime
• Key reliability tools and how to apply to improving equipment performance
Novice
Practitioner
Practitioner• A series of 4hr to 8hr training modules on
selected reliability tools & methods
Reliability Application Engineer
• Local process understanding
• Quantifies and reduces equipment losses
• Applies reliability tools/methods
Reliability Consultant
Level 4
Level 5
Level 3
Level 2
Level 1
• Provides high
level reliability &
methods skills
• How to set up business driven equipment performance goals
• How to link performance goals to improvements in loss categories
• Tools & methods to reduce losses (including maintenance strategies)
• Development and achievement of reliability requirements in Design
5. 5
EQUIPMENT RELIABILITYEQUIPMENT RELIABILITY
TRAINING SERIESTRAINING SERIES
Reliability Awareness (4 Hrs) - at the completion of this training level, the
person should be able to describe the following:
Equipment Performance
1) The importance of high levels of equipment performance and lower (including maintenance) costs in today’s
competitive marketplace
2) The key factors that affect equipment performance (5M’s)
3) Downtime categories and opportunities for improvement
4) The key elements of high level equipment performance measures (Efficiency, OEE and TEEP)
5) Can perform a simple OEE / TEEP calculation
RAM Concepts/Reliability Basics
6) The concepts Reliability, Availability and Maintainability (RAM) and how each of these impacts equipment
performance
7) The importance of defining function and failure
8) The difference between a repairable and a non-repairable system and the associated measures (MTTF,
MTBF and MTTR)
9) The relationship between equipment reliability and process reliability
10) Conceptually define FMEA and FTA their applications
6. 6
EQUIPMENT RELIABILITYEQUIPMENT RELIABILITY
TRAINING SERIESTRAINING SERIES
Reliability Elements in the Asset Life Cycle
11) How, at a conceptual; level, reliability can be integrated into all phases of the Asset Life Cycle
(the “7 Rights”) in order to achieve predictable and high levels of equipment reliability. Specifically,
can describe the key reliability considerations in the equipment design, purchasing and maintenance
phases of the Asset Life Cycle.
12) The important role that operational and maintenance strategies play in improving the reliability of existing
equipment. How to optimize maintenance tasks to reduce costs and still be effective.
Resources
13) Aware of the key support resources for reliability tools, methods and diagnostic technologies.
Reliability Awareness (4 Hrs) - cont’d.
9. 9
Improvement Thrusts:
• Extreme Price Competition
• Forced to make substantial Price Reductions
(lowers Profit $)
The Need for Change
• Reduce Costs
• Improve Equipment Performance
“30 / 30”
TEEP
INTRODUCTION TO EQUIPMENT RELIABILITYINTRODUCTION TO EQUIPMENT RELIABILITY
10. 10
EQUIPMENT PERFORMANCE
Range and Average of Key Equipment
OverallEquipmentEffectiveness(OEE)
100%
85%
75%
65%
55%
45%
35%
OEE =
Good Product Made
Expected Product
World Class OEE
Avg.
1992 1993 1994 1995 1996 1997 1998
11. 11
EQUIPMENT PERFORMANCEEQUIPMENT PERFORMANCE
OPPORTUNITIESOPPORTUNITIES
Reduced wastes
Reduced cycle time
Reduced inventory
Reduced product variability
More efficient use of direct labor
Reduced maintenance costs
- type of work (less reactive)
- extent of work (reduce PM’s)
Reduced schedule disruption
Increased EVA
Reduced capital expenditures
InIn
FocusFocus
- 6 Sigma- 6 Sigma
- 10X- 10X
- AOP Goals- AOP Goals
- Lean Manufacturing- Lean Manufacturing
NeedsNeeds
moremore
focusfocus
• Reduce Costs
• Utilize the “hidden factory”
-- Increase Uptime of existing equipment
12. 12
INTRODUCTION TO EQUIPMENT RELIABILITYINTRODUCTION TO EQUIPMENT RELIABILITY
Equipment Performance
Equipment Reliability
Exercise
13. 13
INTRODUCTION TO EQUIPMENT RELIABILITYINTRODUCTION TO EQUIPMENT RELIABILITY
Equipment Performance
MethodsMaterials Machines Measures Manpower
Reliability Maintainability
— Develop
— Design
— Purchase
— Fabricate
— Install
— Operate
— Maintain
— Store
(How well
equipment performs)
The “Rights
of Reliability:
14. 14
PARTNERSHIP WITH OPERATIONSPARTNERSHIP WITH OPERATIONS
REDUCING COSTS IS A SHARED GOAL
- Reducing Operations Cost
- Reducing Maintenance Costs (but not sub-optimize)
HIGH LEVELS OF EQUIPMENT PERFORMANCE
- Important to Operation
- Important to Capital Projects Team
- Important to Maintenance
OPERATIONS MUST LEAD IMPROVEMENT EFFORT
- Operation “Owns” Asset
- Operations Sets Performance Expectation
- Operation has “most” control of improvement opportunities
25% of Downtime
75% of Downtime
Maintenance
Manufacturing
15. 15
• Measure
• Measure
• Measure
THREE MOST IMPORTANT FACTORS INTHREE MOST IMPORTANT FACTORS IN
IMPROVING PERFORMANCEIMPROVING PERFORMANCE
16. 16
EQUIPMENT/PROCESS EFFECTIVENESS MEASURESEQUIPMENT/PROCESS EFFECTIVENESS MEASURES
Planned
Losses
Operational
Losses
Good ProductionSpeed
Losses
Quality
Losses
A
B
C
D
E
(Total Time)
(Scheduled Time)
(Up Time)
( (O E E T E PEverallOEE quipment ffectiveness) = E/B TEEP otal ffective quipment erformance) = E/A
• Weekends/Holidays
• Shifts not worked
• No Schedule
• Breaks/Lunch
• Meetings/Tours
• Training
• General Cleaning
• PM’s
• Capital Improvement
• Development
• Set-ups/Change-overs
• No Personnel
• No Material
• Equipment Breakdown
• Jams and Minor Stoppages
• Support System Failures
• Reduction from
expected speed
• Product not meeting First
Pass Yield Specs,
which includes:
- Held Product
- Defects/Waste/Scrap
- Machine Rejects
- Quality Samples
- Rework
• First Pass Yield
(Product made right the first time)
17. 17
PERFORMANCE MEASURESPERFORMANCE MEASURES
OEE is a measure of the amount of good product produced compared to the amount
of product that could have been produced if the manufacturing system operated
perfectly (no downtime, operating at its expected speed and all product conforming
to specification) for its entire scheduled time.
OEE =
Scheduled Production
Good Product Made
(Units: Time (hrs) or Production Quantities)
World Class OEE = 85%*
18. 18
PERFORMANCE MEASURESPERFORMANCE MEASURES
TEEP is a measure of the amount of good product produced compared to the amount
of product that could have been produced if the manufacturing system operated
perfectly (no downtime, operating at its expected speed and all product conforming
to specification) for the total amount of time (calendar time) over the time period
under consideration.
TEEP =
Total Time
Scheduled Time
(Units: Time (hrs) or Production Quantities)
Also, TEEP can be considered as follows:
TEEP = OEE x Utilization (where Utilization =
Total Time or Total Expected Units
Good Product Made
)
19. 19
OEE / TEEPOEE / TEEP
OEE = Efficiency X Performance Rate X Quality
Actual Rate
Expected Rate
Good Product Made
Total Product Made
XXXXOEE =
Uptime
Scheduled Time
World Class Equipment Performance
(Performance Rate) (Quality)
XXXXOEE =
(Efficiency)
95%90% 99% = 85%
OEE / TEEP can also be expressed in terms of a formula as follows:
TEEP =
Scheduled Time
Total Time
XX
Good Product Time
Scheduled Time
TEEP =
OEE XX Utilization
20. 20
EQUIPMENT RELIABILITY TRAINING SERIESEQUIPMENT RELIABILITY TRAINING SERIES
The Real Value of measuring OEE/TEEP:
•Understand causes of equipment downtime so that
improvements can be made
•OEE/TEEP is also as valuable as an Equipment
Performance Measure
21. 21
OEE / TEEPOEE / TEEP
EXAMPLEEXAMPLE
Time interval: 24 hrs.
Shift worked: A & B (C not worked - no demand)
Operational downtime Losses:
1.5 hrs equipment (mechanical) breakdown
1.3 hrs no material
1.2 hrs set up
4.0 hrs total loss
1 hr PM during A shift
Speed loss: 5%
Quality loss: 3%
Determine: - categorize machine time losses
- determine amount of time machine
was at “standard”
- calculate OEE & TEEP
Total
Time
24 hrs
Solution:
Planned
Loss
Operational
Loss
Speed
Loss
Quality
Loss
Good Product
Time
8 hr. C Shift
1 hr. PM
9 hrs
4 hrs Uptime
(Time Basis)
Therefore Uptime = 11 hrs (by difference)
22. 22
OEE / TEEPOEE / TEEP
EXAMPLEEXAMPLE
OEE = Good Product / Scheduled = 10.1 hrs / 15 hrs = 67%
TEEP = Good Product / Total Time = 10.1 hrs / 24 hrs = 42%
Speed Losses = Uptime x Speed Loss Rate = 11 hrs x (0.05) = 0.6 hrs
Quality Losses = (Uptime - Speed Loss) x Quality Loss Rate = (11 hrs - 0.6 hrs) x (0.03) = 0.312 hrs
Planned
Loss
Operational
Loss
Speed
Loss
Quality
Loss
Good Product
Time
9 hrs 4 hrs 0.6 hrs 0.3 hrs ? hrs
Total
Time
24 hrs
10.1 hrsGood Product Time (by difference) =
Scheduled Time
Scheduled Time = Total Time - Planned Loss
Scheduled Time = 24 hrs - 9 hrs = 15 hrs
23. 23
EQUIPMENT PERFORMANCE MEASURESEQUIPMENT PERFORMANCE MEASURES
Listed Increasing Levels of SophisticationListed Increasing Levels of Sophistication
I.
II.
III.
IV.
Use measures
Use measures to drive improvement
- awareness of amount of time equipment is
not “scheduled”
Use Performance Measures based on both Scheduled Time (OEE)
and Total Time TEEP
- baseline
- reasons for downtime
- improvement goals
- use common definitions of uptime / downtime for benchmarking
- use OEE as high level measure of equipment
performance. Compare to World Class.
Use consistent measures based on scheduled time
24. 24
Total Time Interval 1 Wk. (7 days;168hrs)
Scheduled Production Time 100 Hrs.
Operational Downtime
Material Problems 6 Hrs.
Product Change Overs 6 Hrs.
Equipment Related Downtime 4 Hrs.
Operator Training Issues 4 Hrs.
20 Hrs.
Planned Production Rate 10 Parts/Hr.
Actual Output 720 Parts
Good Parts (Meeting Specs) 700 Parts
Calculate:
Performance Measure
Example
Assume: - All downtime has been identified
- Actual Speed Rate is less than expected
- Losses ( in hrs)
Planned, Operational, Speed and Quality
- Good Product Time (in hrs):
Good Quality & At Expected Speed
- OEE
- Teep
25. 25
EQUIPMENT RELIABILITY TRAINING SERIESEQUIPMENT RELIABILITY TRAINING SERIES
Planned
Loss
Operational
Loss
Speed
Loss
Quality
Loss
Good Product
Time
___ hrs ___ hrs ___ hrs ___ hrs ___ hrs
Total time =
Scheduled Time =
Uptime =
26. 26
EQUIPMENT RELIABILITY TRAINING SERIESEQUIPMENT RELIABILITY TRAINING SERIES
Planned
Loss
Operational
Loss
Speed
Loss
Quality
Loss
Good Product
Time
68 hrs 20 hrs hrs hrs ? hrs
Total time =
Scheduled Time =
Uptime =
SOLUTION
- data is given
- obtained by difference
168 hrs
100 hrs
80 hrs
Speed Loss: Parts @ expected speed = 80 hrs X 10 parts = 800 parts
hrActual parts = 720 parts
Speed Loss parts lost
expected speed
== 800 parts - 720 parts
10 parts/hr
= 8 hrs
27. 27
EQUIPMENT RELIABILITY TRAINING SERIESEQUIPMENT RELIABILITY TRAINING SERIES
Quality Loss: =
parts lost
expected speed = 2 hrs
(Time)
Planned
Loss
Operational
Loss
Speed
Loss
Quality
Loss
Good Product
Time
68 hrs 20 hrs 8 hrs 2 hrs 70 hrs
OEE =
Good Product Time
Scheduled Time
=
70 hrs
100 hrs
= 70 %
TEEP =
Good Product Time
Total Time
=
70 hrs
168 hrs
= 42 %
Also OEE =
Good Parts
Total Scheduled Time
=
700 parts
100 hrs x 10 parts
= 70 %
hr
720 parts made - 700 parts good
10 parts/hr
28. 28
Record, Categorize and Reduce Equipment
Downtime Losses
Understand and encourage the use of OEE and
TEEP Charts
PERFORMANCE OBJECTIVES
Equipment Performance
30. 30
• Describe the three components of RAM
• Record the “right” failure data
– run time to failure
– machine conditions at failure
– by category
• Use data to analyze failures
– charts
– measures (MTBF, MTTR, OEE,
Availability)
Performance ExpectationsPerformance Expectations
RAM Definitions, Measures &
Tools
31. 31David Garvin, Managing Quality, Free Press, 1988
Quality -Quality - A New DefinitionA New Definition
The
QUALITY
of some subject (i.e. of some product or process) means
the extent to which the subject satisfies the expectations
and needs of the users in operational environments over
a period of time.
32. 32
Reliability =Reliability = Quality over TimeQuality over Time
Reliability is the time dimension to
quality. Product or processes that
meet or exceed customer
expectations, not just when they
are new but over a period of time,
are generally considered to have
high reliability.
Time may be some other measure
than hours like footage, cycles,
indexes, images, copies or
actuations.
33. 33
What is Reliability?What is Reliability?
When we speak of
the reliability of a
product or
process we are
using an
umbrella term
which includes
the concepts of:
Reliability
Maintainability
Availability
Manufacturability
Safety
Serviceability
other ....ilities
34. 34
Components of ReliabilityComponents of Reliability
RELIABILITY …
How long will it last?
MAINTAINABILITY …
How long does it take to repair?
AVAILABILITY …
Is it capable of running when I need it?
SAFETY …
Could someone get hurt?
35. 35
Reliability is Probability ofReliability is Probability of
SuccessSuccess
Reliability is the
probability that an
item will perform its
intended function
adequately for a
specified period of
time under the
specified operating
conditions.
⇒Probability - A number
between 0 and 1
⇒Intended Function -
What is it supposed to do?
⇒Time - For how long:
24x7x365 or many short runs?
⇒Operating
Conditions - Where is it
going to be
installed?
36. 36
What is Failure?What is Failure?
A product or process is said to have failed when it no
longer performs its intended function adequately.
Consider a fuse. Its job is to protect a circuit from
overloading.
If a fuse blows because there was an over-current spike,
the fuse did its job.
However, if there was a current spike and the fuse did not
blow and the wiring caught fire, then the fuse failed!
Therefore, function needs to be clearly defined.
37. 37
ReliabilityReliability
Reliability is the
probability that an
item will perform its
intended function
adequately for a
specified period of
time under the
specified operating
conditions.
Example
A packaging line is designed
to fill 1000 multipacks of film
without a failure. This
constitutes one run. One
hundred runs were initiated
and 90 runs were completed
successfully. The packaging
line reliability can be
estimated by
R(t=1K) = = = 0.9
# of Successful Trials
Total Number of Trials
90
100
38. 38
MaintainabilityMaintainability
Maintainability is the
probability that an item
can be restored to
satisfactory operating
condition within a
specified period of
time under stated
conditions by personnel
having prescribed skill
levels, resources and
procedures.
Example
A piece of equipment was
designed so that all failures
could be fixed in less than 30
minutes by entry level techs.
Reviewing the most recent
100 service events, 15 of then
took longer than 30 minutes
to remedy.
M(t=30) = = = 0.85
# of Successful Events
Total Number of Events
85
100
39. 39
AvailabilityAvailability
Availability is the
probability that an item,
when used under given
conditions, will perform
satisfactorily when
called upon.
Example
Nine times out of ten, when I
walk up to the copier at 8AM,
the copier is ready to process
my job. It is not in STANDBY
and does not have a sign
stating that service has been
called.
A(t= 8) = = = 0.9
# of Successful Trials
Total Number of Trials
9
10
40. 40
Repairable and Nonrepairable DevicesRepairable and Nonrepairable Devices
NONREPAIRABLE
• One-shot device
• If it breaks, throw it out.
• Examples
– Bearings
– Light Bulbs
– Electronic Components
• Replacement strategies
REPAIRABLE
• If it breaks, fix it.
• Employ preventive and
predictive maintenance
strategies.
• Examples
– Spoolers
– Packaging equipment
– Pumps
– Knife sets
Note: The distinction between repairable and nonrepairable devices is critical to how we
collect and analyze data.
41. 41
How is Reliability Measured?How is Reliability Measured?
Number of Failures
Life Cycle Cost
Service/Repair Costs
Reliability (Probability of
Success)
Availability
Costs of Downtime, Waste
B10, B50 Life
Failure Rate
MTTF (Mean Time To
Failure)
MTBF (Mean Time
Between Failures)
MTTR (Mean Time to
Repair/Restore)
OEE (Overall Equipment
Effectiveness)
TEEP (Total Effective
Equipment Performance)
42. 42
ReliabilityReliability
Reliability is the
probability that an
item will perform its
intended function
adequately for a
specified period of
time under the
specified operating
conditions.
Example
A packaging line is designed
to fill 1000 multipacks of film
without a failure. This
constitutes one run. One
hundred runs were initiated
and 90 runs were completed
successfully. The packaging
line reliability can be
estimated by
R(t=1K) = = = 0.9
# of Successful Trials
Total Number of Trials
90
100
MEASURE
S
43. 43
Mean Time To FailureMean Time To Failure
Mean Time To Failure
(MTTF) applies to
nonrepairable items.
MTTF = Sum Failure Times
Number of Failures
Example: Run times to
failure are
10,7,26,20,21,53,32,24,15,19
MTTF=227/10=22.7 hr
Histogram of Failure Tim es
0.0
1.0
2.0
3.0
5 10 15 20 25 30 35 40 45 50 55
Time
NumberofFailures
MEASURE
S
H
10 20 30 40 50
44. 44
What Data Should BeWhat Data Should Be
Collected?Collected?
1.
2.
3.
4.
5.
6.
7.
8.
9.
10.
MEASURE
S
46. 46
Mean Time Between FailuresMean Time Between Failures
For Repairable Items, the arrival order of the
failure times is important
MEAN TIME BETWEEN FAILURES applies to
“neutral” repairable items.
Sum Inter-arrival Times
Number of Failures
MTBF =
For example:
51+43+27+177+15+65+32
7
MTBF = =
410
7 = 58.6
51 43 27 177 15 65 32
MEASURE
S
47. 47
For Repairable Equipment, WhatFor Repairable Equipment, What
Data Should Be Collected?Data Should Be Collected?
1. Event Date
2. Clock Time
3. Machine clocks, meters,
counters
4. Failure Mode
What was
seen/smelled/heard?
5. Machine Parameters
What was the machine
doing prior to the
event?
6. Time to repair or restore
Did the repair go
smoothly?
7. What adjustments were
made?
8. Parts used
Were the parts broken?
Were the replacements
new or rebuilt?
9. Root cause of the stoppage
What actually happened?
10. Failure Mechanism
MEASURE
S
48. 48
Mean Time To RepairMean Time To Repair
Mean Time To Repair
(MTTR) applies to time
actually spent performing
a repair.
MTTR = Sum Repair Times
Number of Repairs
Example: Repair times in
hours for 10 cellular
phones: 0.1, 0.6, 1.3, .05,
0.4, 1.1, 0.15, 0.1, 0.3, 0.2
MTTR=4.3/10=.43 hours
Histogram of Repair Times
0
1
2
3
4
5
6
0.25 0.5 0.75 1 1.25 1.5
Time
NumberofRepairs
MEASURE
S
.25 .50 .75 1.00 1.25 1.50
49. 49
What Additional DataWhat Additional Data
Should Be Collected ForShould Be Collected For
Repairs?Repairs?
1.
2.
3.
4.
5.
MEASURE
S
50. 50
AvailabilityAvailability
Availability is the proportion of the the time the
system is operating.
Over a long period of time, AVAILABILITY is
Uptime MTBF
Uptime + Downtime MTBF + MTTR
AVAILABILITY combines RELIABILITY AND MAINTAINABILITY.
Note: This is the classical definition of Availability which excludes changeover
time, scheduled maintenance and idle time.
MEASURE
S
UP UP UP UP
DOWN DOWN DOWN0 T
A = =
51. 51
Reliability Measures SummaryReliability Measures Summary
There are a variety of RAM measures.
One number, for example the MTBF, might not be
adequate.
For repairable systems, keep the data in time order
and generate a time line plot.
For nonrepairable data, a histogram does a good
job of displaying the variability in the data.
52. 52
Intent of Reliability MethodsIntent of Reliability Methods
To prevent failures from occurring
To mitigate the effect of a failure
To restore the system to a working state quickly if it
did fail and, additionally, to measure and predict
failure
53. 53
Methods to Prevent FailuresMethods to Prevent Failures
The best time to think about failure prevention is in
the development and design phases of a
project.
RAM concepts in the project requirements and
specification documents
Robust Design
Load/Strength Analysis
Failure Mode, Effects & Criticality Analysis (FMECA)
Fault Tree Analysis (FTA)
Part Selection and Derating
Flow Dynamics Analysis
54. 54
• Describe the three components of RAM
• Record the “right” failure data
– run time to failure
–machine conditions at failure
–by category
• Use data to analyze failures
– charts
–measures (MTBF, MTTR, OEE,
Availability)
Performance ExpectationsPerformance Expectations
RAM Definitions, Measures &
Tools
56. 56
Reliability: New Equipment
Recognize the “Design for Reliability” Process
Ensure reliability REQUIREMENTS exist.
Base decisions on Life Cycle Costing.
Include reliability SPECIFICATIONS in Requests for
Quotes and Purchase Orders.
Conduct formal reliability design reviews based upon
FMECA guidelines. Enlist support from company experts.
Request R.A.M information from vendors.
Start involving cross functional team with new hardware
early in the develop/design process.
Performance ExpectationsPerformance Expectations
57. 57
ASSET LIFE CYCLEASSET LIFE CYCLE
Project
Launch
Concept,
Development
and
Design
Final Engineering
Purchase
Fabricate
Install
Startup
Commission
Accreditation
Operate
and
Maintain
Decommission
“PROJECT LIFE”
LaunchConcept Design Execution Commissioning Utilization
REMEMBER
“PROJECT LIFE” IS NOT
ASSET LIFE.
THINK BEYOND
PROJECT LIFE!
End of Useful
Life
Editor's Notes
One of the original definitions of Quality was conformance to specification.
David Garvin - Professor at Harvard Business School
His definition of quality goes beyond that put forth by Deming/Juran. Has the concept of performance past time zero.
Change in definition parallels what has happened in the quality community: moved from QC (quality control of the product) to QA (quality assurance of the process)
Quality is performance at Time 0
Take it out of the box, plug it in, and turn the switch to ON.
Does the motor start running?
Reliability talks about the likelihood of it continuing to run once it started.
Metrics:
Electronics - Power-on Hours
Mechanical Parts - Starts/Stops, cycles, indexes
Continuous Processes - Footage, gallons
Other potential … ilities are
Testability
Diagnosability
Flexibility
We’ll spend a few minutes giving some basic definitions and examples of the first three terms and then will discuss some commonly used measures.
Rather than saying Reliability, Availability and Maintainability every time, we will use the acronym RAM.
Think of our RAM with the big curly horns as an animal that is accustomed to butting heads with obstacles but will eventually be able to charge through the hole it created.
PROBABILITY
- How many of you have ever been to a casino or bought a lottery ticket? What was your chance of winning? Somewhere between 0 and 1 and closer to 0 than to 1.
- How likely is it that you could run 1 mile in 4 minutes or walk 1 mile in 1 hour?
INTENDED FUNCTION ADEQUATELY (defined by situation)
- Need to state clearly what equipment is intended to do.
- What is the function of a screw driver? To turn a screw, to open a paint can, to prop open a window?
- Even if you want to turn a screw, need to say either Phillips or straight, what size head, handle length, magnetic or not,…
TIME
What is the mission length: 24x7x365 or 8x5x50?
Car travel: Drive to 5 miles in Spring or to 2000m in winter?
OPERATING CONDITIONS
Climate controlled room or ambient?
EMI shielding? Is it fixed or portable?
The idea of defining a FAILURE in the context of NOT performing the STATED FUNCTION is a critical concept.
How can we say something is doing or not doing a good job if the performance criteria have not been stated clearly, unambiguously?
INTENDED FUNCTION: To load rolls of film into a carton called a multipack
MISSION LENGTH: 1000 multipacks = 1 run
If the mission length were less than 1000 packs, then the reliability might have been higher than 90%.
FAILURE: No equipment breakage, not cause damage to carton or contents.
However, people rarely talk about a product or process being 90% or 80 % reliable after some amount of usage.
They use some other metrics which we will discuss later.
Key words are
PROBABILITY
A number between 0 and 1
SATISFACTORY OPERATING CONDITION
Again, need a definition of what is satisfactory
SPECIFIED PERIOD OF TIME
What is the downtime standard against which you are checking?
STATED CONDITIONS
Are they working on scaffolding, outdoors in winter with gloves…?
PRESCRIBED SKILL LEVELS, RESOURCES, PROCEDURES
What training do the people have, what tools will they have and where will they be located, what guidelines or procedures will they be able to use?
Key words are
PROBABILITY
A number between 0 and 1
GIVEN CONDITIONS
Excludes abuse or unusual demands
PERFORM SATISFACTORILY
What is the standard against which satisfactory performance is compared?
Not all potentially repairable items are repaired.
If the cost of repair is close to the cost of a new item, it is usually scrapped.
Circuit boards costing less than $400 are thrown away. So they become nonrepairable by definition.
The distinction between repairable and nonrepairable really becomes important when we analyze data and report performance using a reliability measure
Note: Reliability = RAM in its umbrella sense
Life Cycle Cost: The total cost of a resource from inception through decommissioning.
Pay me now or pay me later
Service/Repair Costs: Might also include the cost of downtime and waste
B10 Life: 10th percentile of failure of the life distribution
B50 Life: 50th percentile of failure or the median life
What is the difference between MTTF and MTBF?
Not just a spelling error
Goes back to previous discussion of repairable and nonrepairable devices
MTTF is used for nonrepairable items and time to first failure of repairable items.
Repair: Active wrench time, just doing the fixing
Restore: Travel, diagnose, fix, certify, enter in database
INTENDED FUNCTION: To load rolls of film into a carton called a multipack
MISSION LENGTH: 1000 multipacks = 1 run
If the mission length were less than 1000 packs, then the reliability might have been higher than 90%.
However, people rarely talk about a product or process being 90% or 80 % reliable after some amount of usage.
They use some other metrics which we will discuss later.
Assume the data are from a small fan, called a muffin fan, that is used for cooling in many computers.
You can take the data, put it into your calculator or a computer program, and get the mean or arithmetic average = 22.7 hours.
Highly recommend that you PLOT the data as a histogram. A histogram is an excellent tool for showing the spread of the data (fan life).
If your goal is to have a fan that will survive more that 40 hours of use, then there is much to be learned by investigating why one fan of ten lasted for more than 50 hours.
90% failed on or before 40 seconds, 10% survived >40 sec
What additional data should you collect to aid in your investigation?
Situation: Too many fans are failing after as short amount of time. Your job is to improve the field life. Solicit input from people in class what additional data should be collected.
Like a toe-tag on a body in a detective story
Examples are:
Duty Cycle
Environment: Temperature, rH, dirt
Stresses
Manufacturer
Batch within a manufacturer
What was happening with the system when the item failed
Each line represents the service histories of three machines since their installation.
The numbers on the lines are the run times and the vertical line indicates a failure.
The downtime is not shown.
If you were to draw a face in the box which represents the state of the system now, would you draw a Happy face, a Sad face or a Neutral face and why?
For the Happy system, when would you predict the next failure to be? (Answer: Greater than 177 hours).
For the Sad system, when would you predict the next failure to be? (Answer: Less than 15 hours)
What about the Neutral System?
If you look closely at the data on each line, what do you observe? (Answer: The numbers are all the same, just reordered. Average is less than 60 hours).
If Happy, underestimate current performance if use the average. Opposite with Sad.
Mean Time Between Failures can always be calculated
regardless of whether the system is happy, sad or neutral.
It is the interpretation of the current status of the equipment that is incorrect:
Underestimate MTBF if Happy
Overestimate MTBF if Sad
Many of the items suggested for the nonrepairable items are valid for repairable but additional data are needed so that the events are kept in chronological order.
Repairable items should be identified uniquely so that they can be tracked from the manufacturing line to the repair shop to inventory and back to possibly a different manufacturing line.
Need to understand if the repair was done well.
Kodak is authorized repairshop for pumps, motors
How many times can an item be repaired before it is no longer usable?
Assume the data are from the repair of cellular phones.
You can take the data, put it into your calculator or a computer program, and get the mean or arithmetic average time to repair = .43 hours.
Highly recommend that you PLOT the data as a histogram. A histogram is an excellent tool for showing the spread of the data (repair time).
If your goal is to do all repairs in less than 1.0 hour, then need to investigate why 2 repairs took longer.
What additional data should you collect to aid in your investigation?
Solicit input from people in class of what additional data should be collected for Repairs.
Examples are:
What actually was done to the phone - parts replacement or an adjustment?
Some types of repairs take longer than others.
Were the phones identical - same vendor, same model?
Some models are easier to disassemble and troubleshoot than others
Who did the repair - person’s level of experience?
How many times has the item been repaired before this?
What was the date and time of the repair?
If it is 3 AM, repair person might not be awake.
Border wars can be fought over the definition of AVAILABILITY.
The Inherent Availability is the best the system can be and uses only the sum of the actual running times divided by the sum of the running times and downtime associated with active repair.
The downtime if for active wrench time. It does not include thelogistics delay time of getting a person there, diagnosing the problem, getting the parts/tools, restoring the system.
Downtime does not include other non-repair stoppages like product changeovers and idle time.
Operational Availability takes some of these issues into account but is outside the scope of this discussion.
Quick summary of material which started with the Ruler.
No real need for discussion.
The Reliability Professional’s first job is to prevent failures from occurring.
A list of methods to attempt to prevent failures is on the next slide
Ideally, anticipate what could go wrong and change the design so that the event cannot occur.
Given that all failures cannot be prevented, try to have the item fail soft rather than hard.
Have a drive system coast to a stop rather than to a screeching halt.
Use condition-based indicators to warn of impending problems.
If the item is in a failed state, have diagnostics built-in and troubleshooting procedures written so that the repair staff can do their work efficiently.
Methods to Prevent Failures should include anything involved in the up front planning for a project that has a reliability and maintainability nuance.
RAM Specs should be a part of the overall project specification . They should reflect the needs of the client, operations and maintenance.
Robust Design - Designing a process so that it is insensitive to noise variables
Load/Strength Analysis - Strength of materials under repeated loads
FMECA - A systematic approach for looking at potential failure events and their effects with the intent of lessening their likelihood of occurrence and lessening their effect if they do occur - Bottom Up
Fault Tree Analysis - Starts with and undesired Top Event and asks what events singly or in combination could have caused it to occur
Part Selection and Derating - Recommended parts based on prior experience, using motors at lesser stresses to extend their life
Flow Dynamics Analysis - How fluids flow through pipes and couplings, how cooling air should be ducted through equipment
New Equipment Reliability
This part of presentation deals with how do we build reliability into the new equipment we’re designing, buying, integrating, etc
This could apply to new equipment or upgrades. (If your area has a capital budget review capital budget numbers with group)
This diagram is probably representative of the way project managers/engineers/designers look at projects -- with utilization showing up as just a small part of the picture. But within utilization is usually the majority of the costs. This needs to be considered on a project.
Need to look beyond “Project Life” as a goal for engineering & design community.
Importance of identifying longterm ongoing costs which will be incurred during the utilization phase. These long term costs can be dramatically affected (positively and negatively) by what you do in the design, fabrication, purchasing, installation and commissioning.
What you do in design directly affects Life Cycle costs.
Lowest purchase price is not always the best solution. Need to identify life cycle cost, the total cost of an asset during its life. Goal of corporation is lowest Life Cycle Cost and highest Net Present Value.
Example - need to appreciate intended use and life of product. Example used was different grades of quality of tools. Highest quality and cost --SNAP-ON TOOLS
Mid range quality and cost -- CRAFTSMAN
Low quality and cost -- K MART Special
Which tools would you use if worked on Bobby Hamilton’s pit crew?
Which tools would you use if were a backyard handyman?
Which tools woul you use if were going to use tools only once?