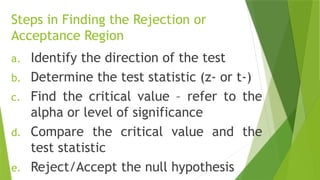
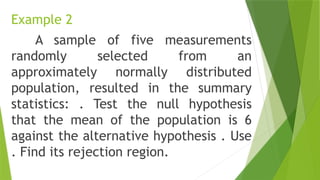
REJECTION
REGION
Learning Competencies:
Identifies the appropriate rejection region
for a given level of significance when:
(a) the population variance is assumed to
be known;
(b) the population variance is assumed to
be unknown; and
(c) the Central Limit Theorem is to be used.
One-Tailed Test
In a one-tailed test, the rejection
region lies on one end of the
distribution.
Two-Tailed Test
In a two-tailed test, the rejection
region lies on both ends of the
distribution.
Rejection Region / Critical Region
It refers to the region where the
value of the test statistic lies, for which
we will reject the null hypothesis.
Rejection Region / Critical Region
It starts on the critical value following the
direction of the test. It is always equal to the
critical value towards the direction of the test.
Critical Value
It refers to the specific value that
determines whether the test statistic is
within the rejection region or
acceptance region.
Degrees of Freedom
It indicates the number of
independent values that can vary in an
analysis without breaking any
constraints.
Critical Value for Z-Test
Level of
Significance
/ Confidence
Level
Critical Value
Two-tailed
test
Right-tailed
test
Left-tailed
test
0.01 / 99% 2.33 -2.33
0.02 / 98% 2.05 -2.05
0.04 / 96% 1.75 -1.75
0.05 / 95% 1.65 -1.65
Critical Value for T-Test
Steps in Finding the Rejection or
Acceptance Region
a. Identify the direction of the test
b. Determine the test statistic (z- or t-)
c. Find the critical value – refer to the
alpha or level of significance
d. Compare the critical value and the
test statistic
e. Reject/Accept the null hypothesis
When to Reject the Null Hypothesis
One-Tailed Test
Two-Tailed Test
When to Accept the Null Hypothesis
One-Tailed Test
Two-Tailed Test
Test Statistic
Example 1
A standardized problem-solving test was
administered to Senior High School students with a
mean and standard deviation of 85 and 8
respectively. An average of 87.5 was shown from a
random sample of 60 students who were given the
same test. Is there enough evidence to show that
this group has a higher performance compared to the
general group of students? Determine its rejection
region using critical value at .
Example 2
A sample of five measurements
randomly selected from an
approximately normally distributed
population, resulted in the summary
statistics: . Test the null hypothesis
that the mean of the population is 6
against the alternative hypothesis . Use
. Find its rejection region.
Example 3
In her research, Janina wants to determine
if the new learning modality during pandemic
has an effect on the students’ math
performance. Two hundred randomly selected
learners participated in her study. She found
out that the sample mean and sample standard
deviations were 92 and 10 respectively. In a
more recent study, the mean was 94. is the
new learning modality effective based on the
evidences at hand? Use . Determine the
rejection region of this problem.
Example 4
A doctor says that the mean age of
COVID-19 infected persons is above 60
years old. A medical doctor finds that a
random of 15 samples have a mean age
of 55 years old and a standard deviation
of 5 years. Is this enough evidence to
accept the doctor’s claim at ? Assume
the population is normally distributed.
Find its rejection region.
Example 5
The average score of SHS students in
the First Quarter Exam in General
Mathematics was 86, with a standard
deviation of 10. A random sample of 39
students was taken from the STEM strand
and found out that their mean score was
90. Is this an indication that STEM students
performed better than the rest of SHS
students? Use to test the hypothesis. Find
the rejection region of this problem.
ACTIVITY 9
Find the rejection region of each of the
following.

Rejection-Region.pptx..............................

  • 1.
  • 2.
    Learning Competencies: Identifies theappropriate rejection region for a given level of significance when: (a) the population variance is assumed to be known; (b) the population variance is assumed to be unknown; and (c) the Central Limit Theorem is to be used.
  • 3.
    One-Tailed Test In aone-tailed test, the rejection region lies on one end of the distribution.
  • 4.
    Two-Tailed Test In atwo-tailed test, the rejection region lies on both ends of the distribution.
  • 5.
    Rejection Region /Critical Region It refers to the region where the value of the test statistic lies, for which we will reject the null hypothesis.
  • 6.
    Rejection Region /Critical Region It starts on the critical value following the direction of the test. It is always equal to the critical value towards the direction of the test.
  • 7.
    Critical Value It refersto the specific value that determines whether the test statistic is within the rejection region or acceptance region.
  • 8.
    Degrees of Freedom Itindicates the number of independent values that can vary in an analysis without breaking any constraints.
  • 9.
    Critical Value forZ-Test Level of Significance / Confidence Level Critical Value Two-tailed test Right-tailed test Left-tailed test 0.01 / 99% 2.33 -2.33 0.02 / 98% 2.05 -2.05 0.04 / 96% 1.75 -1.75 0.05 / 95% 1.65 -1.65
  • 10.
  • 11.
    Steps in Findingthe Rejection or Acceptance Region a. Identify the direction of the test b. Determine the test statistic (z- or t-) c. Find the critical value – refer to the alpha or level of significance d. Compare the critical value and the test statistic e. Reject/Accept the null hypothesis
  • 12.
    When to Rejectthe Null Hypothesis One-Tailed Test Two-Tailed Test
  • 13.
    When to Acceptthe Null Hypothesis One-Tailed Test Two-Tailed Test
  • 14.
  • 15.
    Example 1 A standardizedproblem-solving test was administered to Senior High School students with a mean and standard deviation of 85 and 8 respectively. An average of 87.5 was shown from a random sample of 60 students who were given the same test. Is there enough evidence to show that this group has a higher performance compared to the general group of students? Determine its rejection region using critical value at .
  • 16.
    Example 2 A sampleof five measurements randomly selected from an approximately normally distributed population, resulted in the summary statistics: . Test the null hypothesis that the mean of the population is 6 against the alternative hypothesis . Use . Find its rejection region.
  • 17.
    Example 3 In herresearch, Janina wants to determine if the new learning modality during pandemic has an effect on the students’ math performance. Two hundred randomly selected learners participated in her study. She found out that the sample mean and sample standard deviations were 92 and 10 respectively. In a more recent study, the mean was 94. is the new learning modality effective based on the evidences at hand? Use . Determine the rejection region of this problem.
  • 18.
    Example 4 A doctorsays that the mean age of COVID-19 infected persons is above 60 years old. A medical doctor finds that a random of 15 samples have a mean age of 55 years old and a standard deviation of 5 years. Is this enough evidence to accept the doctor’s claim at ? Assume the population is normally distributed. Find its rejection region.
  • 19.
    Example 5 The averagescore of SHS students in the First Quarter Exam in General Mathematics was 86, with a standard deviation of 10. A random sample of 39 students was taken from the STEM strand and found out that their mean score was 90. Is this an indication that STEM students performed better than the rest of SHS students? Use to test the hypothesis. Find the rejection region of this problem.
  • 20.
    ACTIVITY 9 Find therejection region of each of the following.