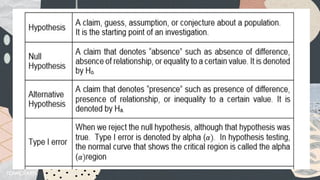
Hypothesis is consideredan educated guess
which provides proposed outcomes based on
experience and theoretical knowledge which is
likely to be correct. According to Cambridge
Dictionary, it is an idea or explanation for
something that is based on known facts but has
not yet been proven.
6.
1. Drinking milkbefore going to bed will make you sleep
better.
2. The average weight of senior high school students in
NNHS is 48 kilograms.
3. Sanitizer Y is better than Sanitizer X in terms of germ-
killing effects.
4. Private employees have higher savings than government
employees after retirement.
5. There is no significant relationship between the intellectual
quotient and emotional quotient of STEM students.
7.
A fact isan observation about the world
around us.
1. Asia is the largest continent in the world in terms of area.
2. The boiling point of water is 100 degrees Celsius.
3. The sum of the angles of a triangle is always 180 degrees.
4. Davao is nearer to Cebu than to Manila in terms of nautical
miles.
8.
Activity 1:
A. Tellwhether the following statement as a hypothesis or a fact. On
the space provided before each item, write H if the statement is a
hypothesis and F if it is a fact
_____1. Drug A is less efficient than Drug B as treatment of a
certain disease.
_____2. An hour is equal to sixty minutes.
_____3. The mean percentage score of a group of HUMSS
students in a general mathematics midterm exam is above 80.
9.
_____4. Blood isthicker in consistency than water.
___5. The new teaching strategy has no significant change
in the statistics pre-test and post-test results.
___6. Sleeping at least 6 hours will make you do better on
tests than if you get less sleep.
___7. Planets travel in ellipses with one focus being the
Sun.
___8. The number of pets in a household is unrelated to the
number of people living in it.
___9. Rodrigo Roa Duterte is the 16th President of the
Philippines.
___10. All daisies have the same number of petals.
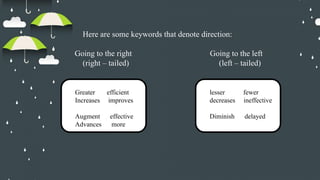
Here are somekeywords that denote direction:
Going to the right Going to the left
(right – tailed) (left – tailed)
Greater efficient
Increases improves
Augment effective
Advances more
lesser fewer
decreases ineffective
Diminish delayed
13.
In making decisions,conclusions are formed and these
conclusions are the bases of actions. But this is not always the case in
Statistics because the decisions that are made were based on sample
information. The best thing to do is to control the probability with
which error occurs.
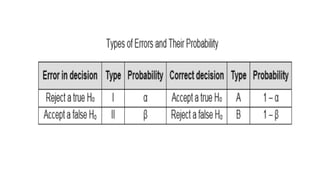
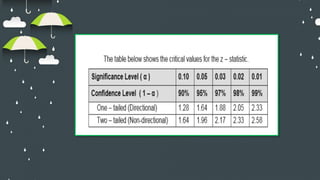
The probability of committing a Type I error is denoted by the
Greek letter α (alpha) while the probability of committing a Type II
error is denoted by β (beta). These probabilities are shown on the table
below.
14.
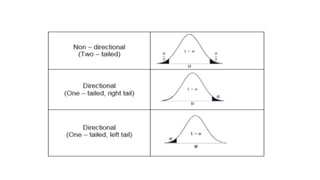
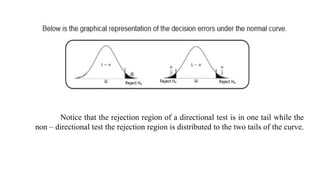
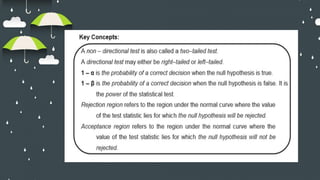
Notice that therejection region of a directional test is in one tail while the
non – directional test the rejection region is distributed to the two tails of the curve.
15.
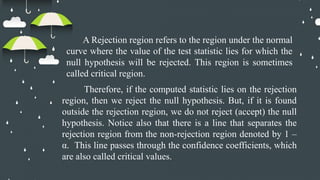
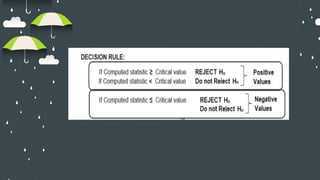
A Rejection regionrefers to the region under the normal
curve where the value of the test statistic lies for which the
null hypothesis will be rejected. This region is sometimes
called critical region.
Therefore, if the computed statistic lies on the rejection
region, then we reject the null hypothesis. But, if it is found
outside the rejection region, we do not reject (accept) the null
hypothesis. Notice also that there is a line that separates the
rejection region from the non-rejection region denoted by 1 –
α. This line passes through the confidence coefficients, which
are also called critical values.
17.
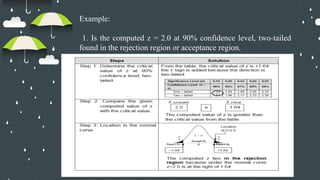
Example:
1. Is thecomputed z = 2.0 at 90% confidence level, two-tailed
found in the rejection region or acceptance region.
18.
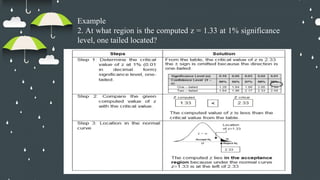
Example
2. At whatregion is the computed z = 1.33 at 1% significance
level, one tailed located?
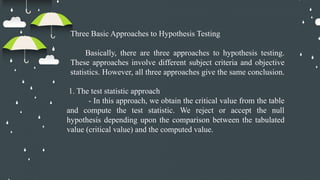
Three Basic Approachesto Hypothesis Testing
Basically, there are three approaches to hypothesis testing.
These approaches involve different subject criteria and objective
statistics. However, all three approaches give the same conclusion.
1. The test statistic approach
- In this approach, we obtain the critical value from the table
and compute the test statistic. We reject or accept the null
hypothesis depending upon the comparison between the tabulated
value (critical value) and the computed value.
22.
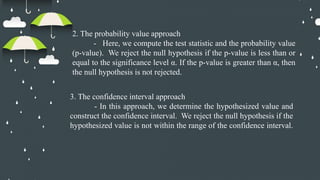
2. The probabilityvalue approach
- Here, we compute the test statistic and the probability value
(p-value). We reject the null hypothesis if the p-value is less than or
equal to the significance level α. If the p-value is greater than α, then
the null hypothesis is not rejected.
3. The confidence interval approach
- In this approach, we determine the hypothesized value and
construct the confidence interval. We reject the null hypothesis if the
hypothesized value is not within the range of the confidence interval.
23.
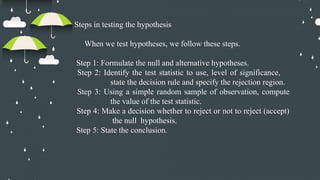
Steps in testingthe hypothesis
When we test hypotheses, we follow these steps.
Step 1: Formulate the null and alternative hypotheses.
Step 2: Identify the test statistic to use, level of significance,
state the decision rule and specify the rejection region.
Step 3: Using a simple random sample of observation, compute
the value of the test statistic.
Step 4: Make a decision whether to reject or not to reject (accept)
the null hypothesis.
Step 5: State the conclusion.
24.
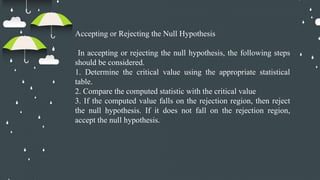
Accepting or Rejectingthe Null Hypothesis
In accepting or rejecting the null hypothesis, the following steps
should be considered.
1. Determine the critical value using the appropriate statistical
table.
2. Compare the computed statistic with the critical value
3. If the computed value falls on the rejection region, then reject
the null hypothesis. If it does not fall on the rejection region,
accept the null hypothesis.
26.
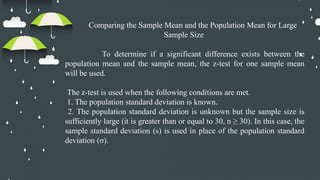
Comparing the SampleMean and the Population Mean for Large
Sample Size
To determine if a significant difference exists between the
population mean and the sample mean, the z-test for one sample mean
will be used.
The z-test is used when the following conditions are met.
1. The population standard deviation is known.
2. The population standard deviation is unknown but the sample size is
sufficiently large (it is greater than or equal to 30, n ≥ 30). In this case, the
sample standard deviation (s) is used in place of the population standard
deviation (σ).
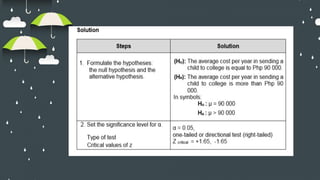
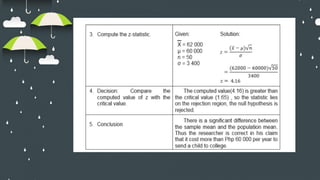
27.
Example 1.
A seniorhigh school researcher believes that it costs more
than Php 60 000 a year to send a child to college. To test this
claim, a random sample of 50 families having college students
were selected. It was found that the average expenses for these
families reveal a mean of Php 62 000 with a standard deviation
of Php 3 400. Test whether the senior high school researcher’s
claim is valid using a 0.05 level of significance.
30.
Comparing the SampleMean and the Population Mean for
Small Sample Size
What if the condition is change? What if σ is not given and the
sample size is small (n<30)? In this case, the t-test for one sample mean
shall be used instead of the z-test. Please recall that the t-distribution and
how to get the critical values of t from the table had already been
discussed in the preceding module.
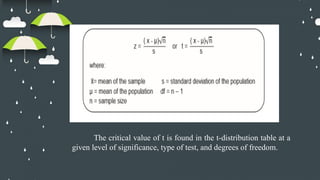
To compare the sample mean and the population mean when the
sample size is less than 30 and the population standard deviation is not
known, we use the following formula.
X
31.
The critical valueof t is found in the t-distribution table at a
given level of significance, type of test, and degrees of freedom.
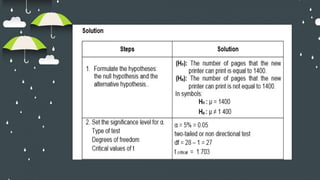
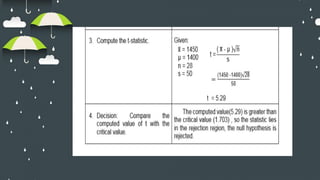
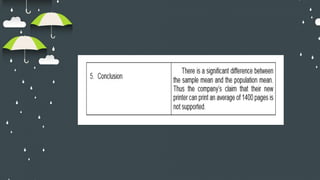
32.
Example 1.
A printermanufacturing company claims that their new
printer in the market is ink efficient. It can print an average of 1400
pages of text documents. To check this claim, a random sample of
28 printers has been tested and revealed a mean of 1450 pages with
a standard deviation of 50. Does this result support the company’s
claim? Test the validity of the claim at 5% significance level.
36.
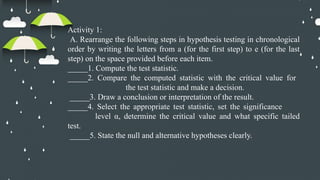
Activity 1:
A. Rearrangethe following steps in hypothesis testing in chronological
order by writing the letters from a (for the first step) to e (for the last
step) on the space provided before each item.
_____1. Compute the test statistic.
_____2. Compare the computed statistic with the critical value for
the test statistic and make a decision.
_____3. Draw a conclusion or interpretation of the result.
_____4. Select the appropriate test statistic, set the significance
level α, determine the critical value and what specific tailed
test.
_____5. State the null and alternative hypotheses clearly.
37.
B. Read eachstatement carefully. Write T if the statement is correct;
write F if it is wrong on the space provided before each item.
_____6. The first step in a hypothesis testing is to formulate the null
and alternative hypotheses.
_____7. The alternative hypothesis is the hypothesis of “no
difference”.
_____8. Sample data are collected to serve as evidence of proof.
_____9. It is important to set before the conduct of the research
𝛼𝛼
or the experiment because the Type I error is the more critical error to
make.
_____10. For test statistics concerning means, we make use of either
z statistic or t-statistic depending on the conditions provided.