Downloaded 198 times

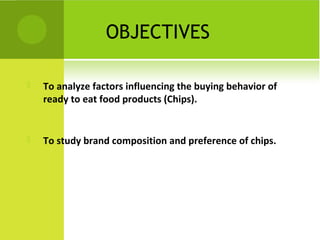


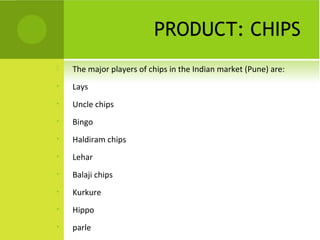
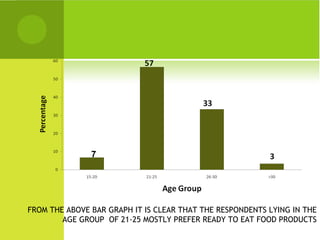
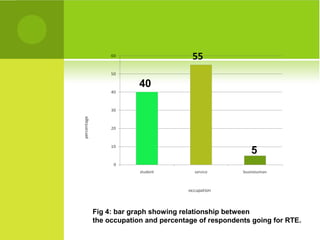
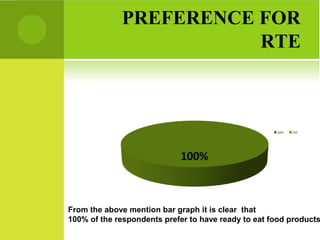
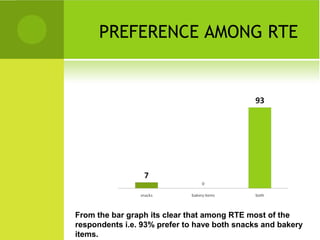


The document presents research on consumer behavior towards ready-to-eat food products (chips) in India. The objectives are to analyze factors influencing buying behavior of chips and study brand composition and preference. A survey was conducted using a questionnaire to collect data from respondents in Pune on their chip preferences. The analysis found that most respondents aged 21-25 prefer ready-to-eat foods. Service sector workers also showed high preference. Uncle Chips and Lays were the most popular brands. Factors like age, occupation, and income influence buying behavior of chips.